| Param | Original file | Final file |
|---|---|---|
| Filename | modeM0/AS1A14_083T05_9000006554_56381cztM0_level2.fits | modeM0/AS1A14_083T05_9000006554_56381cztM0_level2_quad_clean.evt |
| Size (bytes) | 715,780,800 | 94,507,200 |
| Size | 682.6 MB | 90.1 MB |
| Events in quadrant A | 6,557,211 | 602,497 |
| Events in quadrant B | 3,581,953 | 728,782 |
| Events in quadrant C | 4,817,004 | 624,911 |
| Events in quadrant D | 10,981,285 | 403,489 |
| Mode SS | |||
|---|---|---|---|
| Quadrant | BADHDUFLAG | Total packets | Discarded packets |
| A | 0 | 144 | 0 |
| B | 0 | 144 | 0 |
| C | 0 | 144 | 0 |
| D | 0 | 144 | 0 |
| Mode M0 | |||
|---|---|---|---|
| Quadrant | BADHDUFLAG | Total packets | Discarded packets |
| A | 0 | 24465 | 0 |
| B | 0 | 15761 | 0 |
| C | 0 | 19589 | 0 |
| D | 0 | 37666 | 3 |
| Quadrant | Total seconds | Saturated seconds | Saturation percentage |
|---|---|---|---|
| A | 7203 | 856 | 11.883937% |
| B | 7203 | 74 | 1.027350% |
| C | 7204 | 390 | 5.413659% |
| D | 7203 | 2690 | 37.345550% |
Noise dominated data is calculated using 1-second bins in cleaned event files. If a bin has >2000 counts, and if more than 50% of those come from <1% of pixels, then it is considered to be noise-dominated and hence unusable.
| Quadrant | # 1 sec bins | Bins with >0 counts | Bins with >2000 counts | High rate bins dominated by noise | Noise dominated (total time) | Noise dominated (detector-on time) | Marked lightcurve |
|---|---|---|---|---|---|---|---|
| A | 7203 | 7203 | 791 | 791 | 10.98% | 10.98% |  |
| B | 7203 | 7203 | 37 | 37 | 0.51% | 0.51% |  |
| C | 7204 | 7204 | 299 | 299 | 4.15% | 4.15% |  |
| D | 7203 | 7203 | 2333 | 2333 | 32.39% | 32.39% |  |
Top three noisy pixels from each quadrant. If the there are fewer than three noisy pixels in the level2.evt file, extra rows are filled as -1
| Pixel properties | Quadrant properties | ||||||
|---|---|---|---|---|---|---|---|
| Quadrant | DetID | PixID | Counts | Sigma | Mean | Median | Sigma |
| A | 12 | 3 | 1816909 | 10018.12 | 723 | 703 | 181.3 |
| A | 3 | 14 | 425970 | 2345.75 | 723 | 703 | 181.3 |
| A | 3 | 79 | 303325 | 1669.25 | 723 | 703 | 181.3 |
| B | 5 | 185 | 181351 | 1108.67 | 763 | 735 | 162.9 |
| B | 4 | 21 | 70656 | 429.2 | 763 | 735 | 162.9 |
| B | 10 | 247 | 65572 | 397.99 | 763 | 735 | 162.9 |
| C | 13 | 3 | 538639 | 2691.79 | 732 | 726 | 199.8 |
| C | 15 | 230 | 484626 | 2421.5 | 732 | 726 | 199.8 |
| C | 12 | 254 | 415319 | 2074.68 | 732 | 726 | 199.8 |
| D | 8 | 129 | 6691688 | 39108.22 | 595 | 567 | 171.1 |
| D | 12 | 3 | 1179342 | 6889.7 | 595 | 567 | 171.1 |
| D | 2 | 249 | 497985 | 2907.31 | 595 | 567 | 171.1 |
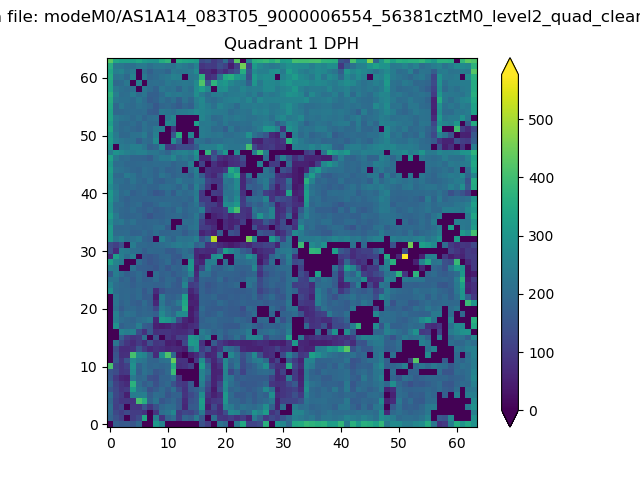
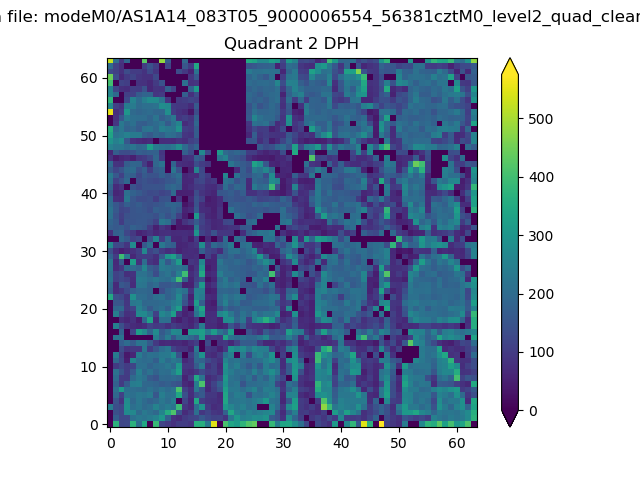
Histogram calculated using DETX and DETY for each event in the final _common_clean file
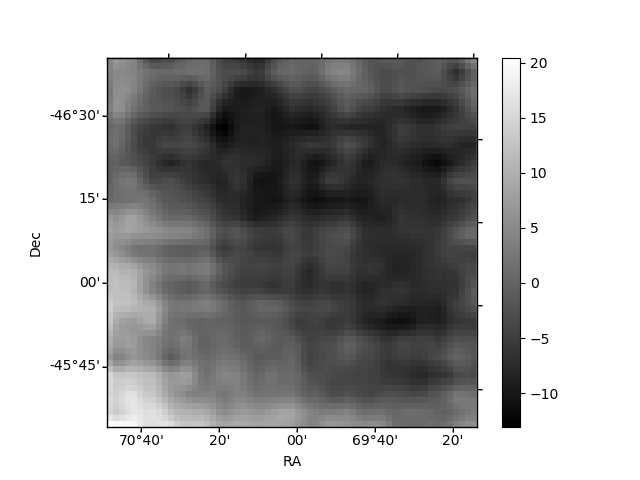
| Quadrant A |  |
 |
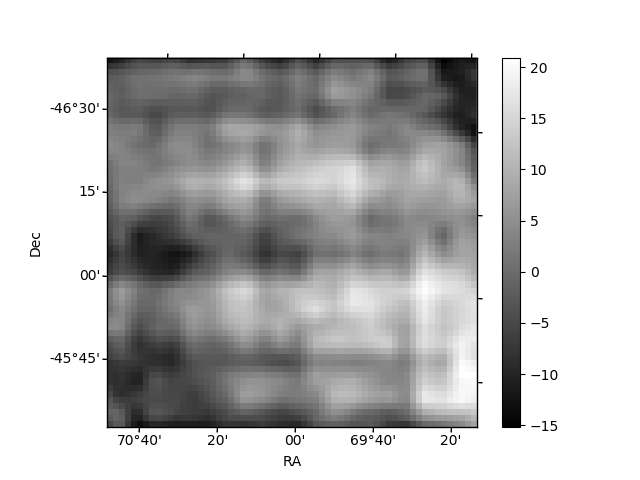
Quadrant B |
|---|---|---|---|
| Quadrant D |  |
 |
Quadrant C |
| Plot type | Count rate plots | Images |
|---|---|---|
| Comparison with Poisson distribution Blue bars denote a histogram of data divided into 1 sec bins. Red curve is a Poisson curve with rate = median count rate of data. |
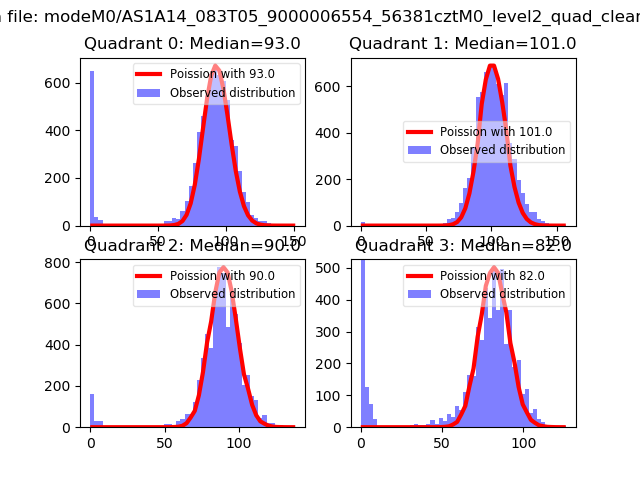 |
 |
| Quadrant-wise count rates Data is divided into 100 sec bins |
 |
|
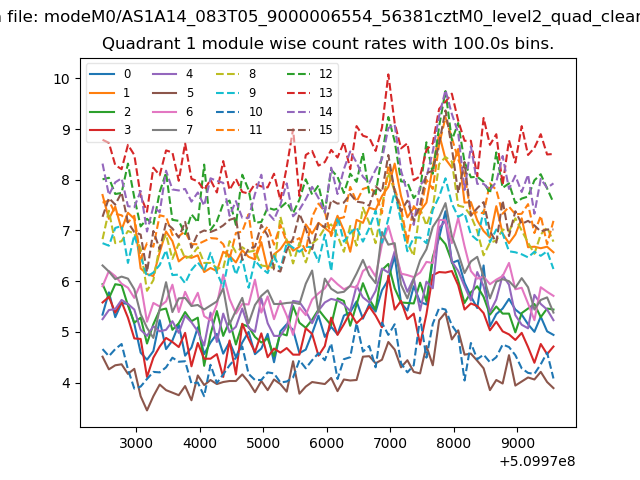
| Module-wise count rates for Quadrant A Data is divided into 100 sec bins |
 |
 |
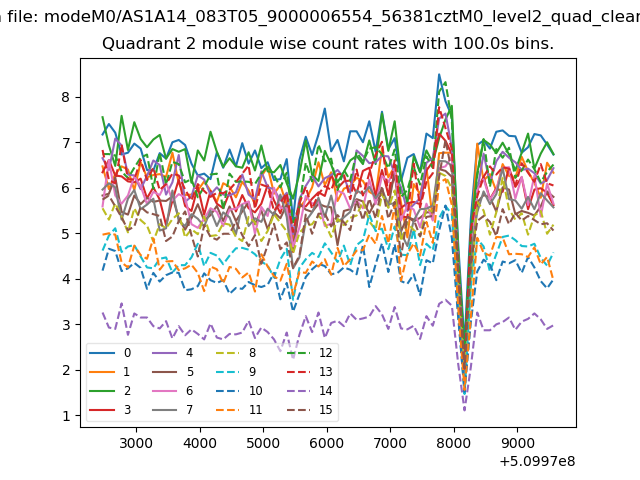
| Module-wise count rates for Quadrant B Data is divided into 100 sec bins |
 |
 |
| Module-wise count rates for Quadrant C Data is divided into 100 sec bins |
 |
 |
| Module-wise count rates for Quadrant D Data is divided into 100 sec bins |
 |
 |
| Parameter | Plot |
|---|---|
| CZT HV Monitor | 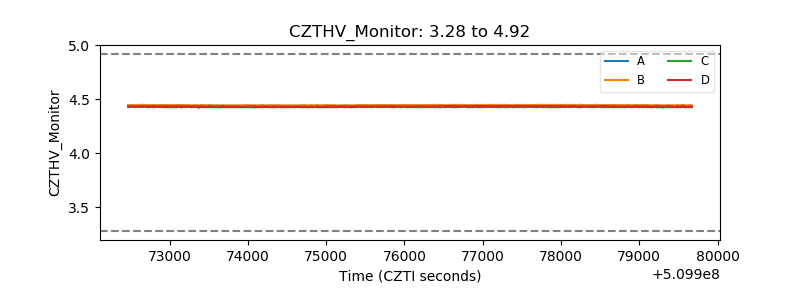 |
| D_VDD |  |
| Temperature 1 | 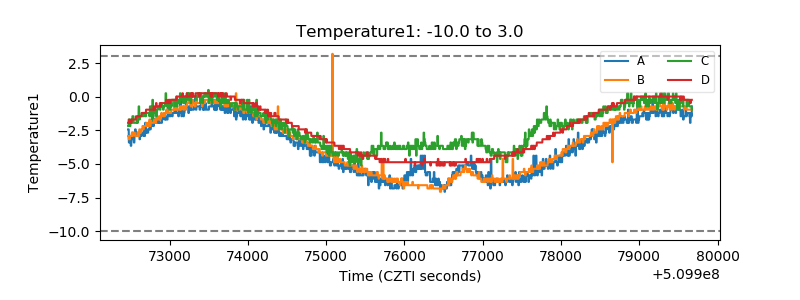 |
| Veto HV Monitor | 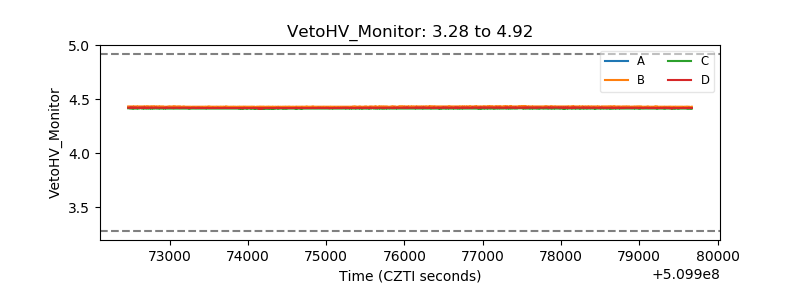 |
| Veto LLD |  |
| Alpha Counter | 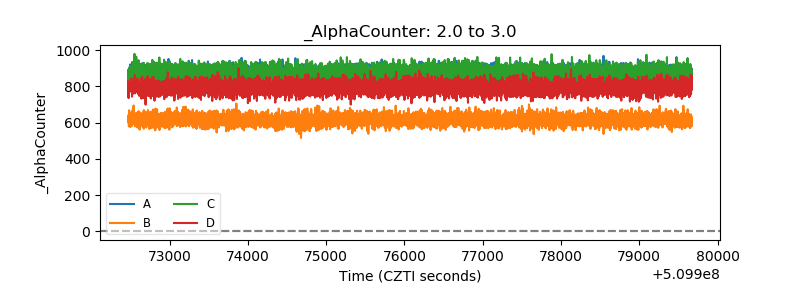 |
| _CPM_Rate | 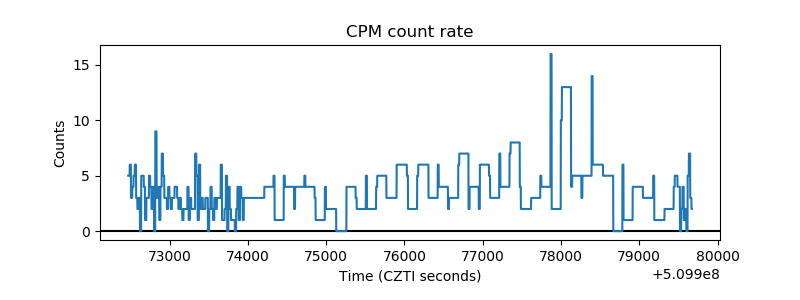 |
| CZT Counter | 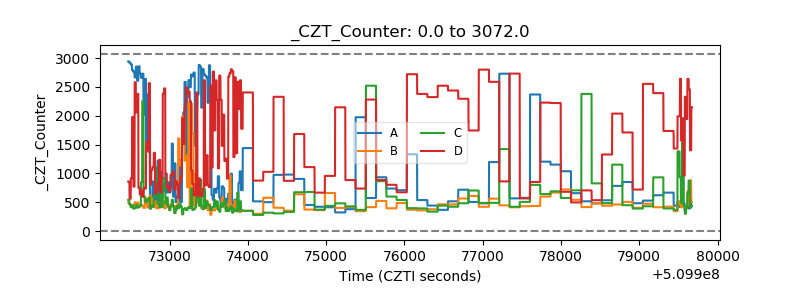 |
| +2.5 Volts monitor | 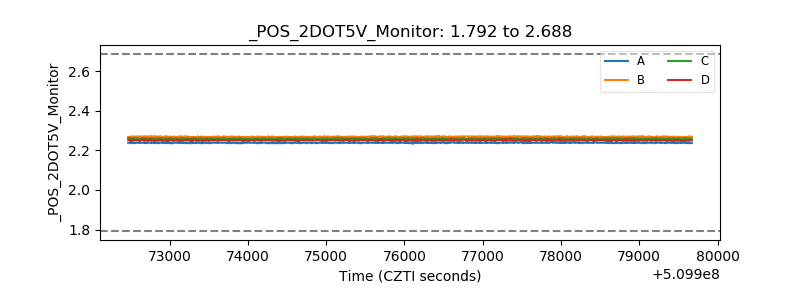 |
| +5 Volts monitor | 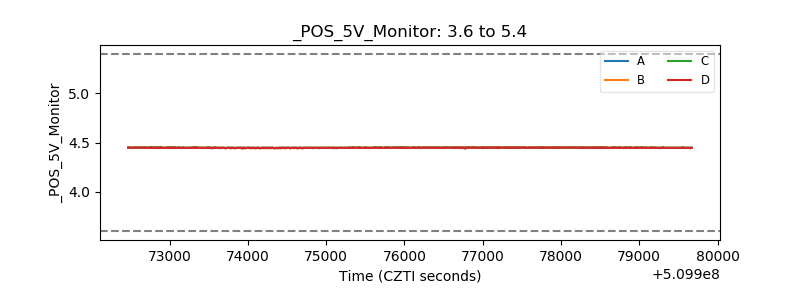 |
| _ROLL_ROT | 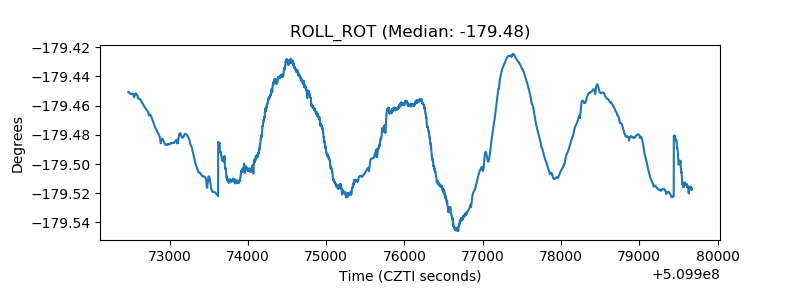 |
| _Roll_DEC | 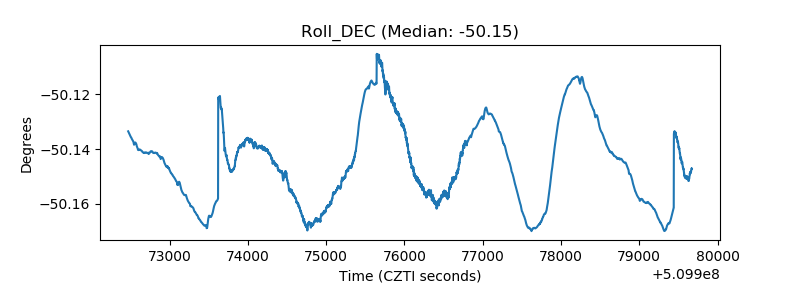 |
| _Roll_RA |  |
| Veto Counter | 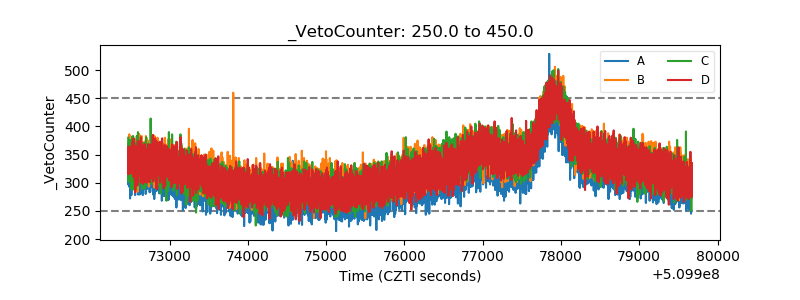 |