| Param | Original file | Final file |
|---|---|---|
| Filename | modeM0/AS1A14_083T05_9000006554_56382cztM0_level2.fits | modeM0/AS1A14_083T05_9000006554_56382cztM0_level2_quad_clean.evt |
| Size (bytes) | 867,461,760 | 94,207,680 |
| Size | 827.3 MB | 89.8 MB |
| Events in quadrant A | 5,520,507 | 677,751 |
| Events in quadrant B | 4,083,879 | 774,999 |
| Events in quadrant C | 4,695,696 | 677,655 |
| Events in quadrant D | 17,219,379 | 191,500 |
| Mode SS | |||
|---|---|---|---|
| Quadrant | BADHDUFLAG | Total packets | Discarded packets |
| A | 0 | 152 | 0 |
| B | 0 | 152 | 0 |
| C | 0 | 152 | 0 |
| D | 0 | 152 | 0 |
| Mode M0 | |||
|---|---|---|---|
| Quadrant | BADHDUFLAG | Total packets | Discarded packets |
| A | 0 | 21854 | 0 |
| B | 0 | 17499 | 0 |
| C | 0 | 19517 | 0 |
| D | 0 | 56384 | 7 |
| Quadrant | Total seconds | Saturated seconds | Saturation percentage |
|---|---|---|---|
| A | 7624 | 548 | 7.187828% |
| B | 7624 | 118 | 1.547744% |
| C | 7625 | 254 | 3.331148% |
| D | 7624 | 5697 | 74.724554% |
Noise dominated data is calculated using 1-second bins in cleaned event files. If a bin has >2000 counts, and if more than 50% of those come from <1% of pixels, then it is considered to be noise-dominated and hence unusable.
| Quadrant | # 1 sec bins | Bins with >0 counts | Bins with >2000 counts | High rate bins dominated by noise | Noise dominated (total time) | Noise dominated (detector-on time) | Marked lightcurve |
|---|---|---|---|---|---|---|---|
| A | 7624 | 7624 | 480 | 480 | 6.30% | 6.30% |  |
| B | 7624 | 7624 | 47 | 47 | 0.62% | 0.62% |  |
| C | 7625 | 7625 | 217 | 217 | 2.85% | 2.85% |  |
| D | 7624 | 7624 | 5823 | 5823 | 76.38% | 76.38% |  |
Top three noisy pixels from each quadrant. If the there are fewer than three noisy pixels in the level2.evt file, extra rows are filled as -1
| Pixel properties | Quadrant properties | ||||||
|---|---|---|---|---|---|---|---|
| Quadrant | DetID | PixID | Counts | Sigma | Mean | Median | Sigma |
| A | 7 | 64 | 852151 | 4307.01 | 804 | 783 | 197.7 |
| A | 3 | 79 | 358477 | 1809.55 | 804 | 783 | 197.7 |
| A | 12 | 3 | 341823 | 1725.3 | 804 | 783 | 197.7 |
| B | 5 | 172 | 200484 | 1136.07 | 818 | 786 | 175.8 |
| B | 1 | 223 | 137296 | 776.6 | 818 | 786 | 175.8 |
| B | 5 | 185 | 110717 | 625.39 | 818 | 786 | 175.8 |
| C | 12 | 254 | 517022 | 2377.69 | 790 | 785 | 217.1 |
| C | 15 | 230 | 344897 | 1584.92 | 790 | 785 | 217.1 |
| C | 12 | 252 | 308550 | 1417.51 | 790 | 785 | 217.1 |
| D | 8 | 129 | 13537044 | 83592.94 | 565 | 538 | 161.9 |
| D | 2 | 249 | 576096 | 3554.28 | 565 | 538 | 161.9 |
| D | 12 | 3 | 531734 | 3280.33 | 565 | 538 | 161.9 |
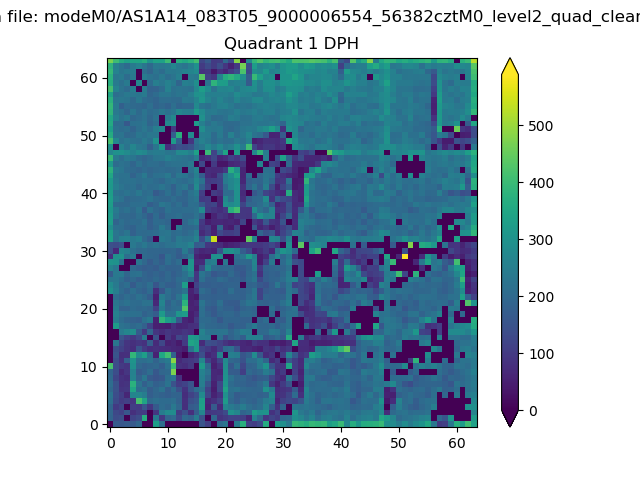
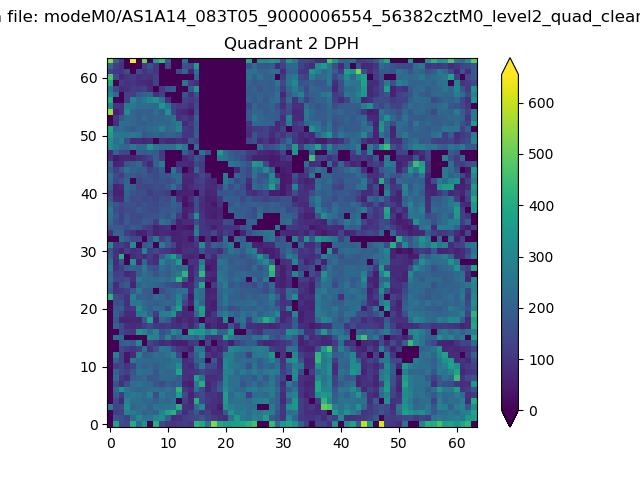
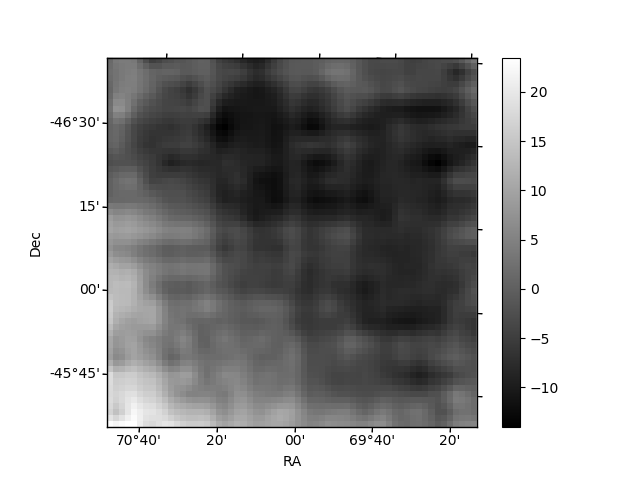
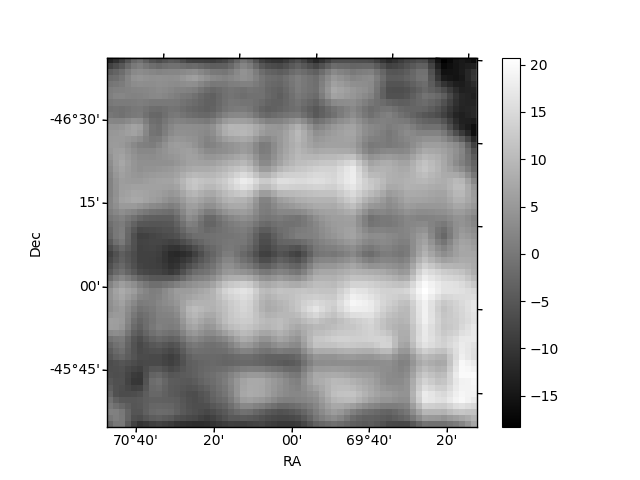
Histogram calculated using DETX and DETY for each event in the final _common_clean file
| Quadrant A |  |
 |
Quadrant B |
|---|---|---|---|
| Quadrant D |  |
 |
Quadrant C |
| Plot type | Count rate plots | Images |
|---|---|---|
| Comparison with Poisson distribution Blue bars denote a histogram of data divided into 1 sec bins. Red curve is a Poisson curve with rate = median count rate of data. |
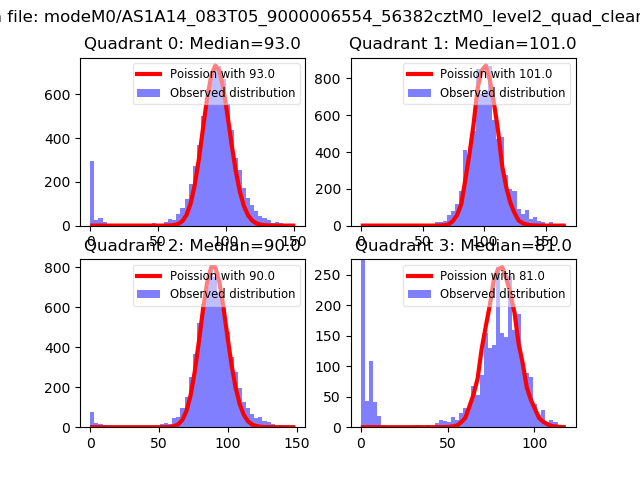 |
 |
| Quadrant-wise count rates Data is divided into 100 sec bins |
 |
|
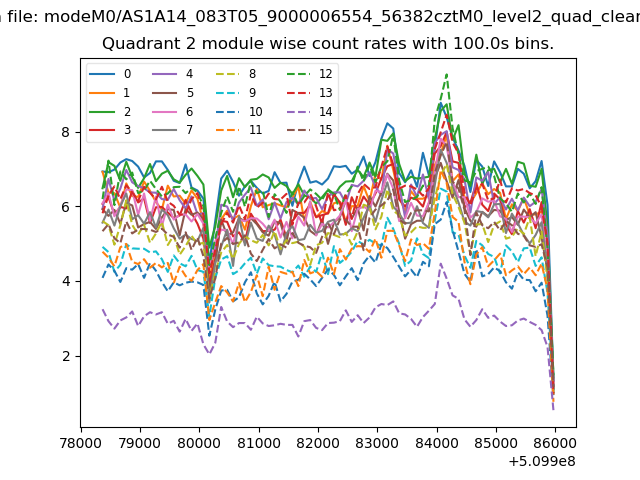
| Module-wise count rates for Quadrant A Data is divided into 100 sec bins |
 |
 |
| Module-wise count rates for Quadrant B Data is divided into 100 sec bins |
 |
 |
| Module-wise count rates for Quadrant C Data is divided into 100 sec bins |
 |
 |
| Module-wise count rates for Quadrant D Data is divided into 100 sec bins |
 |
 |
| Parameter | Plot |
|---|---|
| CZT HV Monitor | 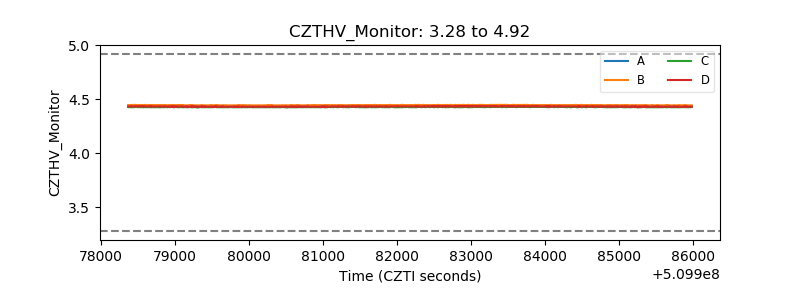 |
| D_VDD |  |
| Temperature 1 | 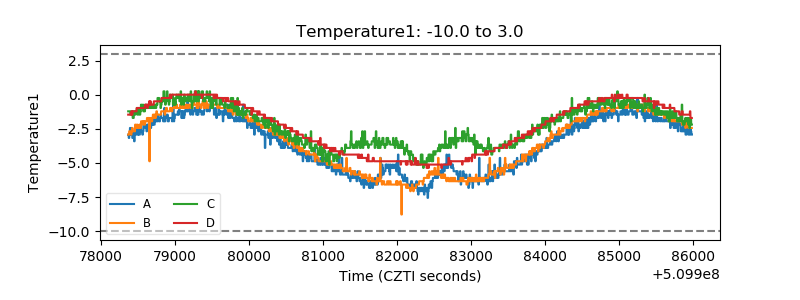 |
| Veto HV Monitor | 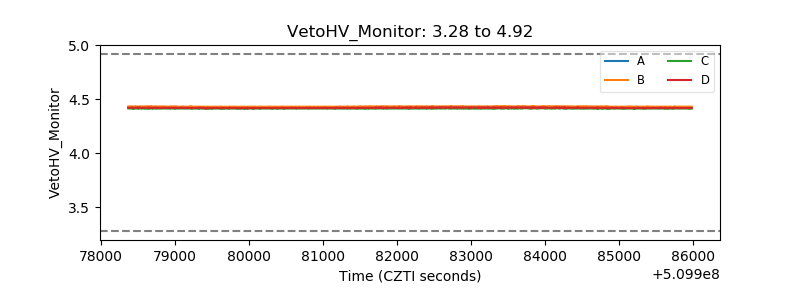 |
| Veto LLD |  |
| Alpha Counter | 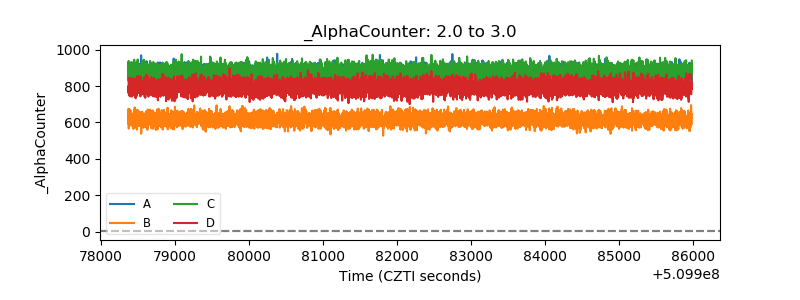 |
| _CPM_Rate | 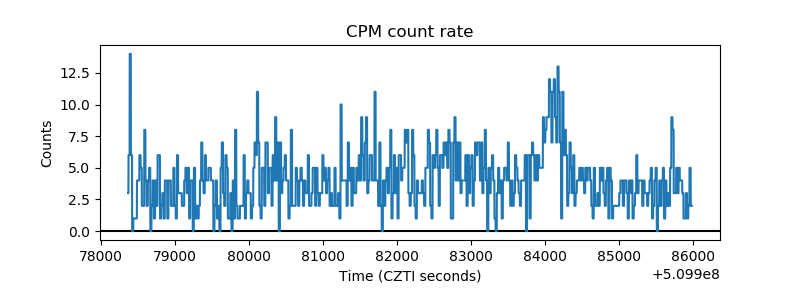 |
| CZT Counter | 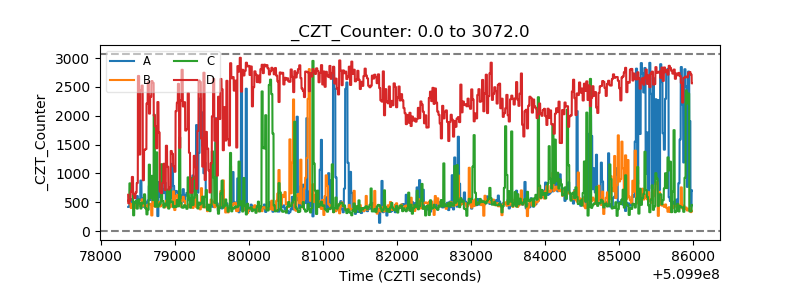 |
| +2.5 Volts monitor | 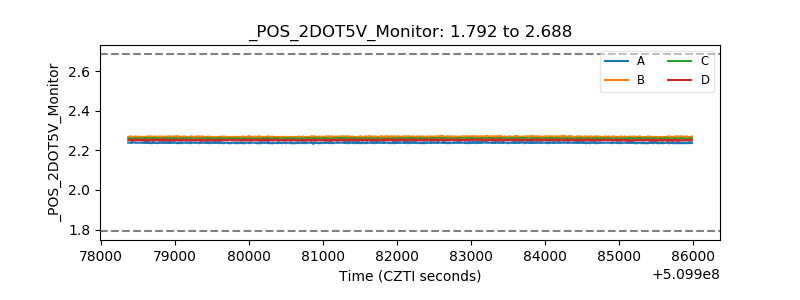 |
| +5 Volts monitor | 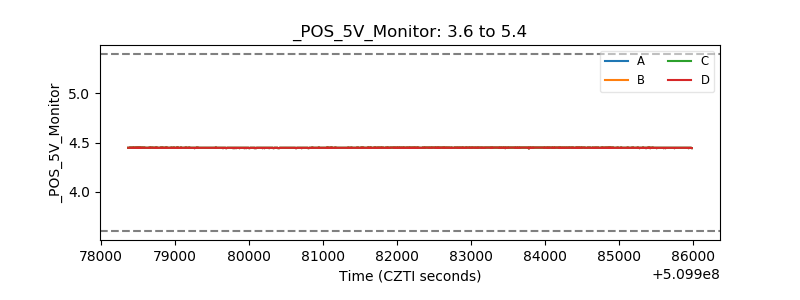 |
| _ROLL_ROT |  |
| _Roll_DEC | 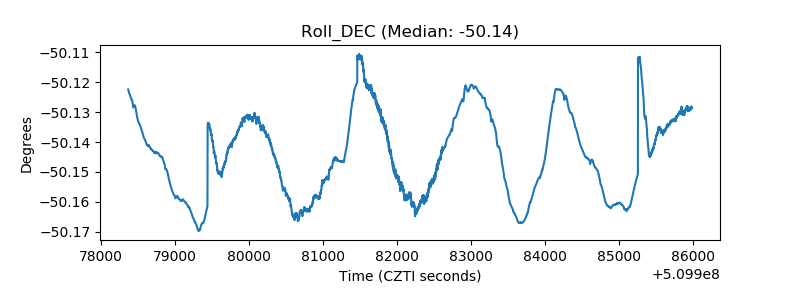 |
| _Roll_RA |  |
| Veto Counter | 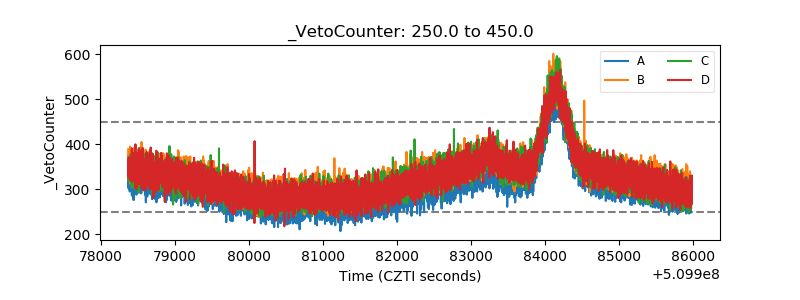 |