| Param | Original file | Final file |
|---|---|---|
| Filename | modeM0/AS1A14_083T05_9000006554_56385cztM0_level2.fits | modeM0/AS1A14_083T05_9000006554_56385cztM0_level2_quad_clean.evt |
| Size (bytes) | 2,439,815,040 | 191,370,240 |
| Size | 2.3 GB | 182.5 MB |
| Events in quadrant A | 27,908,540 | 983,309 |
| Events in quadrant B | 10,737,713 | 1,686,882 |
| Events in quadrant C | 13,006,498 | 1,456,931 |
| Events in quadrant D | 37,270,159 | 422,194 |
| Mode M9 | |||
|---|---|---|---|
| Quadrant | BADHDUFLAG | Total packets | Discarded packets |
| A | 0 | 16 | 0 |
| B | 0 | 16 | 0 |
| C | 0 | 16 | 0 |
| D | 0 | 16 | 0 |
| Mode SS | |||
|---|---|---|---|
| Quadrant | BADHDUFLAG | Total packets | Discarded packets |
| A | 0 | 368 | 0 |
| B | 0 | 368 | 0 |
| C | 0 | 368 | 0 |
| D | 0 | 368 | 0 |
| Mode M0 | |||
|---|---|---|---|
| Quadrant | BADHDUFLAG | Total packets | Discarded packets |
| A | 0 | 95360 | 3 |
| B | 0 | 45045 | 3 |
| C | 0 | 51709 | 3 |
| D | 0 | 123205 | 3 |
| Quadrant | Total seconds | Saturated seconds | Saturation percentage |
|---|---|---|---|
| A | 18035 | 7427 | 41.181037% |
| B | 18036 | 1083 | 6.004657% |
| C | 18036 | 1418 | 7.862054% |
| D | 18036 | 13429 | 74.456642% |
Noise dominated data is calculated using 1-second bins in cleaned event files. If a bin has >2000 counts, and if more than 50% of those come from <1% of pixels, then it is considered to be noise-dominated and hence unusable.
| Quadrant | # 1 sec bins | Bins with >0 counts | Bins with >2000 counts | High rate bins dominated by noise | Noise dominated (total time) | Noise dominated (detector-on time) | Marked lightcurve |
|---|---|---|---|---|---|---|---|
| A | 19695 | 18038 | 7090 | 7090 | 36.00% | 39.31% |  |
| B | 19696 | 18039 | 706 | 706 | 3.58% | 3.91% | 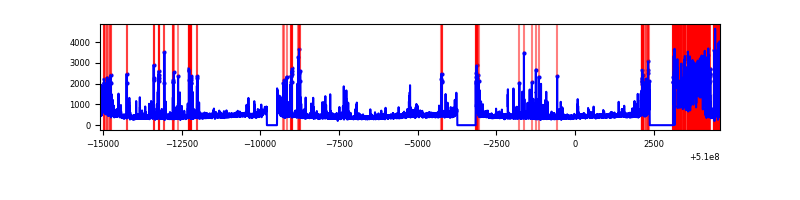 |
| C | 19696 | 18039 | 1183 | 1183 | 6.01% | 6.56% |  |
| D | 19696 | 18039 | 11238 | 11238 | 57.06% | 62.30% |  |
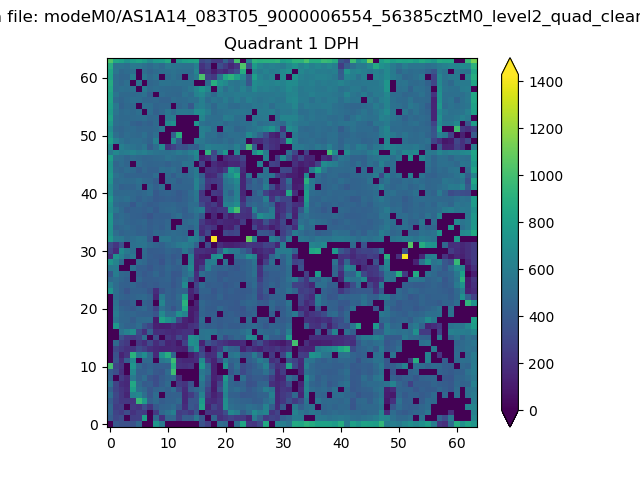
Top three noisy pixels from each quadrant. If the there are fewer than three noisy pixels in the level2.evt file, extra rows are filled as -1
| Pixel properties | Quadrant properties | ||||||
|---|---|---|---|---|---|---|---|
| Quadrant | DetID | PixID | Counts | Sigma | Mean | Median | Sigma |
| A | 12 | 3 | 11968344 | 32357.64 | 1485 | 1450 | 369.8 |
| A | 3 | 79 | 4912135 | 13278.15 | 1485 | 1450 | 369.8 |
| A | 12 | 194 | 1541164 | 4163.28 | 1485 | 1450 | 369.8 |
| B | 4 | 206 | 1869075 | 4800.56 | 1843 | 1779 | 389.0 |
| B | 5 | 185 | 352838 | 902.52 | 1843 | 1779 | 389.0 |
| B | 5 | 172 | 307864 | 786.9 | 1843 | 1779 | 389.0 |
| C | 13 | 3 | 2221183 | 4519.18 | 1785 | 1773 | 491.1 |
| C | 15 | 230 | 1800788 | 3663.17 | 1785 | 1773 | 491.1 |
| C | 6 | 223 | 538863 | 1093.63 | 1785 | 1773 | 491.1 |
| D | 8 | 129 | 30348142 | 104824.3 | 1015 | 970 | 289.5 |
| D | 12 | 3 | 1742270 | 6014.75 | 1015 | 970 | 289.5 |
| D | 2 | 120 | 377922 | 1302.06 | 1015 | 970 | 289.5 |
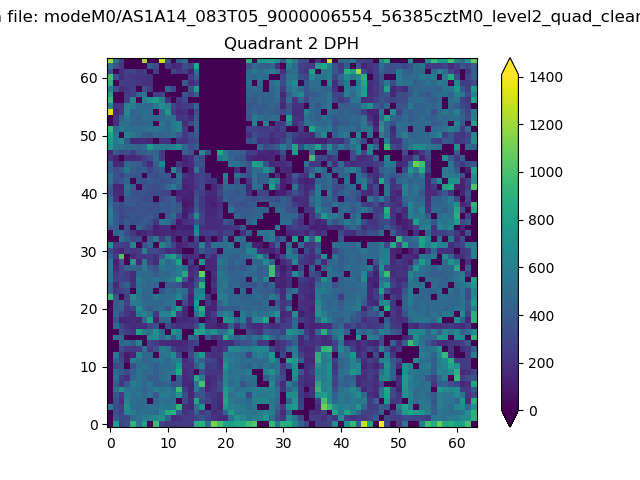
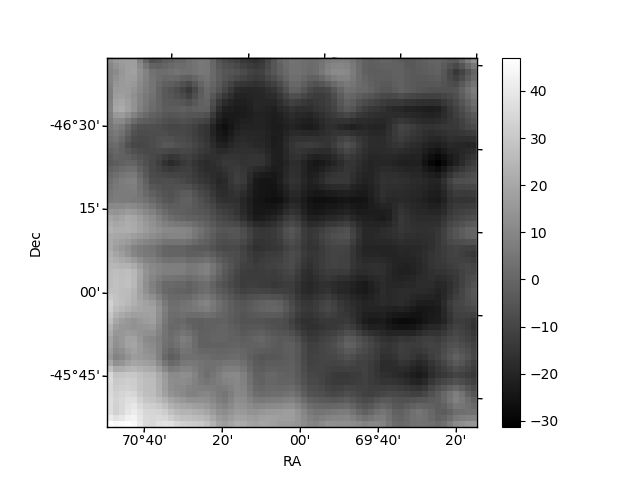
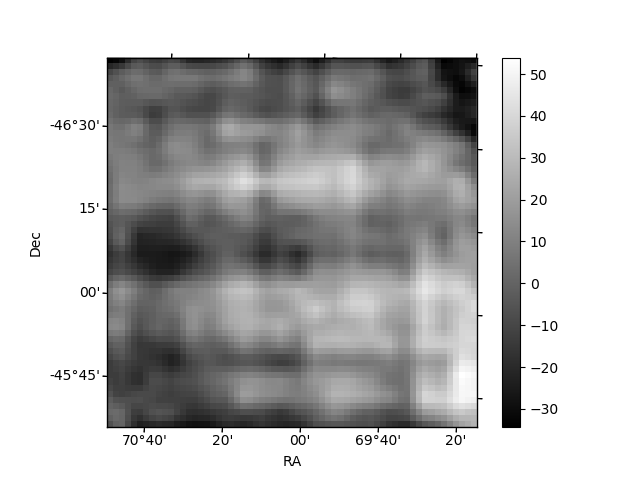
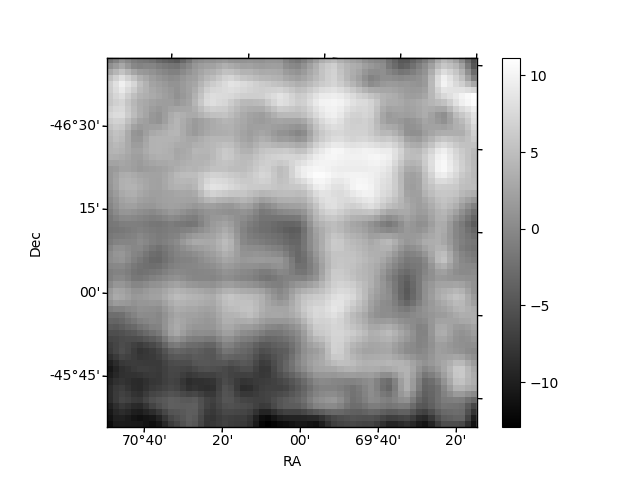
Histogram calculated using DETX and DETY for each event in the final _common_clean file
| Quadrant A | 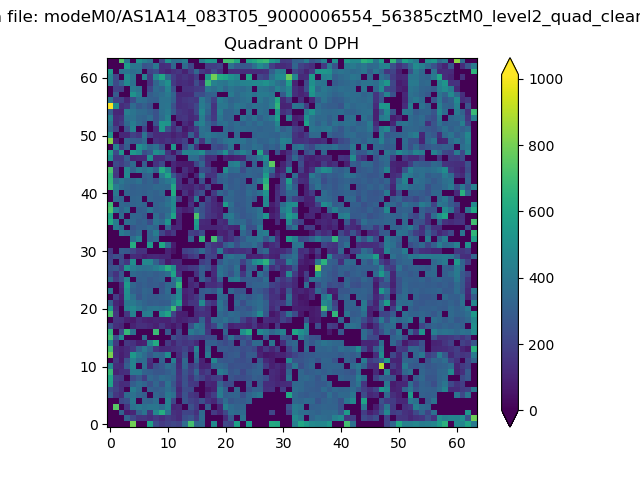 |
 |
Quadrant B |
|---|---|---|---|
| Quadrant D | 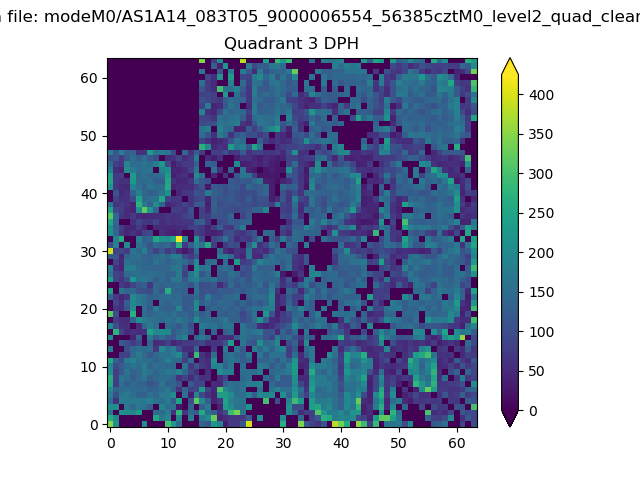 |
 |
Quadrant C |
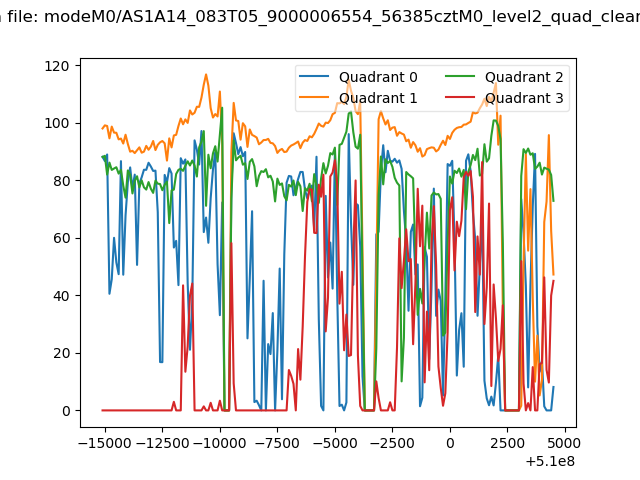
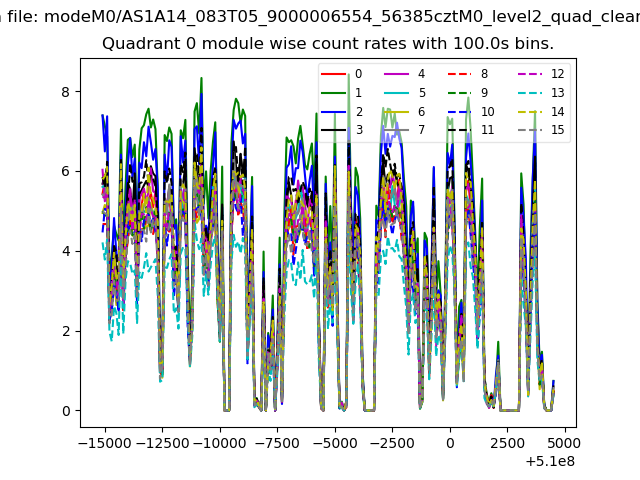
| Plot type | Count rate plots | Images |
|---|---|---|
| Comparison with Poisson distribution Blue bars denote a histogram of data divided into 1 sec bins. Red curve is a Poisson curve with rate = median count rate of data. |
 |
 |
| Quadrant-wise count rates Data is divided into 100 sec bins |
 |
|
| Module-wise count rates for Quadrant A Data is divided into 100 sec bins |
 |
 |
| Module-wise count rates for Quadrant B Data is divided into 100 sec bins |
 |
 |
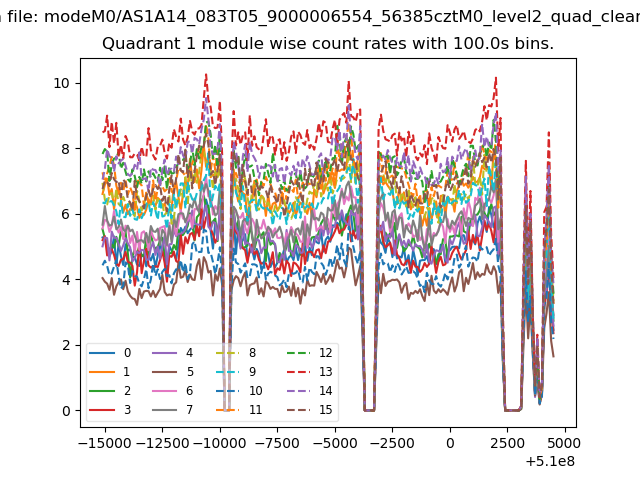
| Module-wise count rates for Quadrant C Data is divided into 100 sec bins |
 |
 |
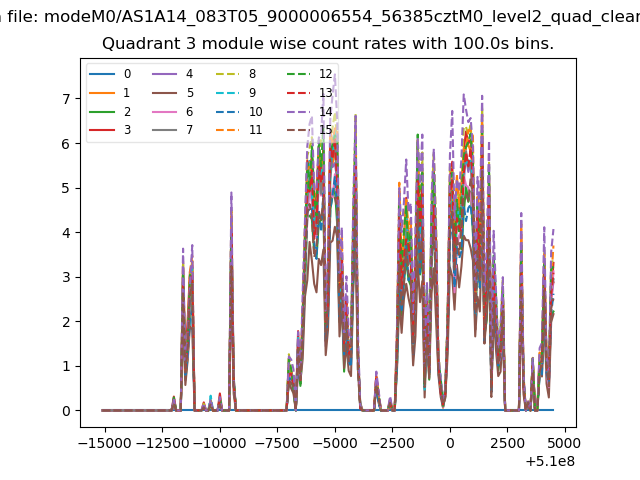
| Module-wise count rates for Quadrant D Data is divided into 100 sec bins |
 |
 |
| Parameter | Plot |
|---|---|
| CZT HV Monitor | 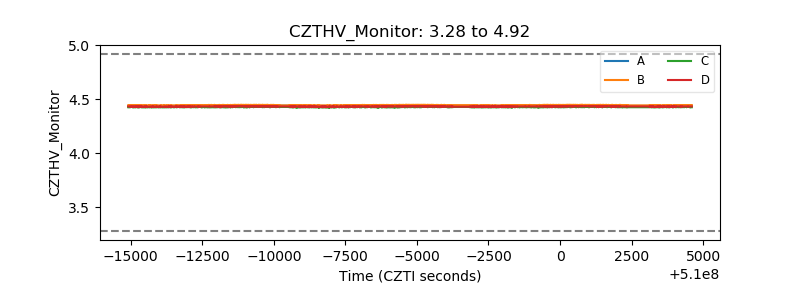 |
| D_VDD |  |
| Temperature 1 | 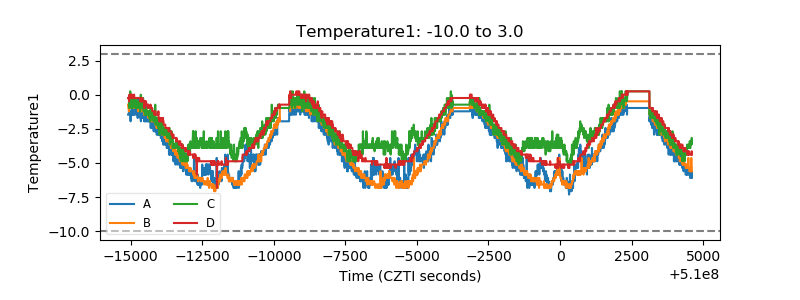 |
| Veto HV Monitor |  |
| Veto LLD |  |
| Alpha Counter |  |
| _CPM_Rate |  |
| CZT Counter | 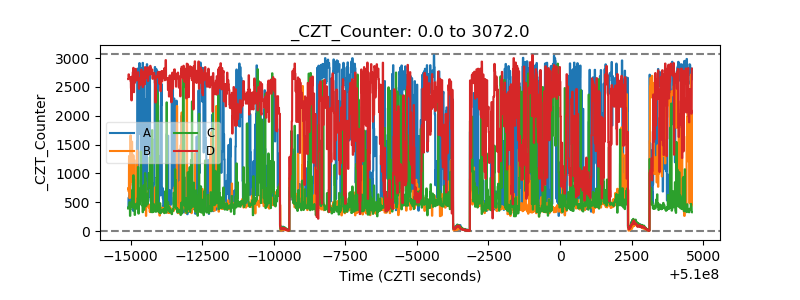 |
| +2.5 Volts monitor | 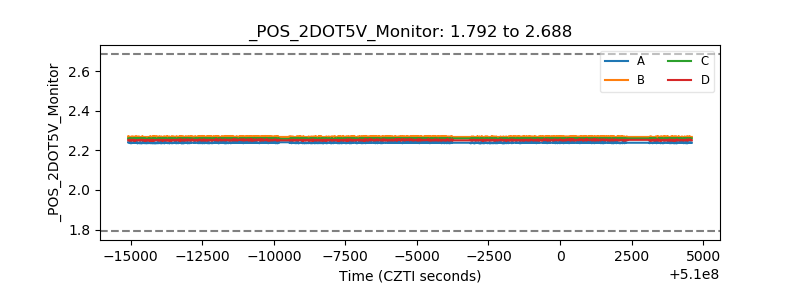 |
| +5 Volts monitor |  |
| _ROLL_ROT | 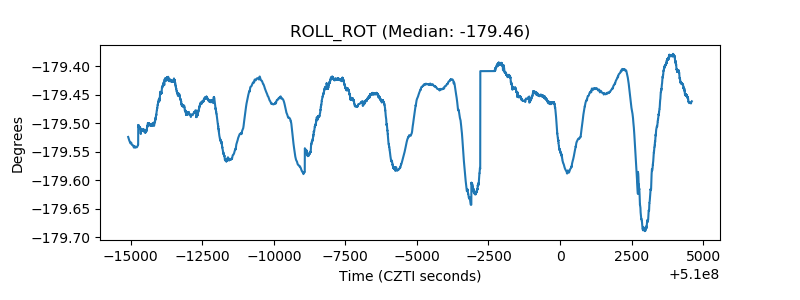 |
| _Roll_DEC | 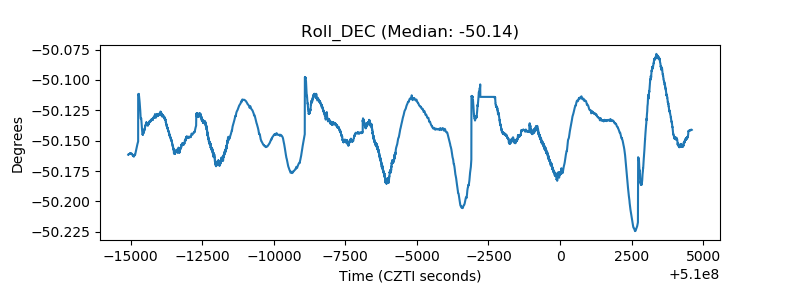 |
| _Roll_RA | 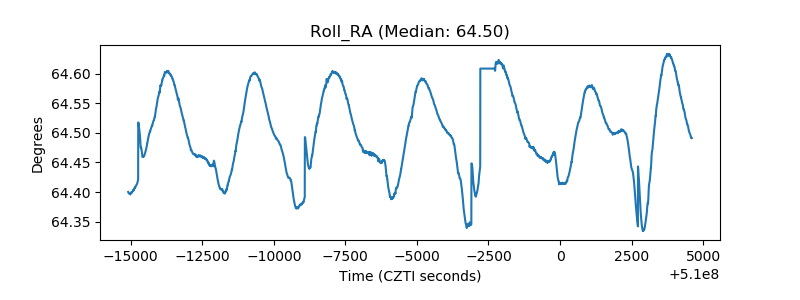 |
| Veto Counter | 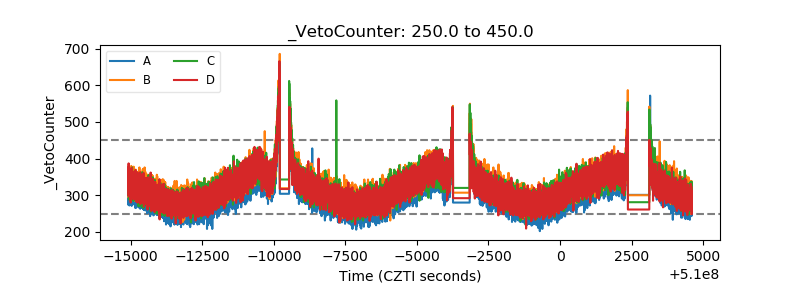 |