| Param | Original file | Final file |
|---|---|---|
| Filename | modeM0/AS1A14_083T05_9000006554_56386cztM0_level2.fits | modeM0/AS1A14_083T05_9000006554_56386cztM0_level2_quad_clean.evt |
| Size (bytes) | 1,070,184,960 | 62,542,080 |
| Size | 1020.6 MB | 59.6 MB |
| Events in quadrant A | 12,735,396 | 277,280 |
| Events in quadrant B | 7,793,215 | 475,899 |
| Events in quadrant C | 3,243,651 | 575,068 |
| Events in quadrant D | 15,339,029 | 110,209 |
| Mode M9 | |||
|---|---|---|---|
| Quadrant | BADHDUFLAG | Total packets | Discarded packets |
| A | 0 | 9 | 0 |
| B | 0 | 9 | 0 |
| C | 0 | 9 | 0 |
| D | 0 | 9 | 0 |
| Mode SS | |||
|---|---|---|---|
| Quadrant | BADHDUFLAG | Total packets | Discarded packets |
| A | 0 | 132 | 0 |
| B | 0 | 132 | 0 |
| C | 0 | 132 | 0 |
| D | 0 | 132 | 0 |
| Mode M0 | |||
|---|---|---|---|
| Quadrant | BADHDUFLAG | Total packets | Discarded packets |
| A | 0 | 42161 | 1 |
| B | 0 | 27731 | 1 |
| C | 0 | 14634 | 1 |
| D | 0 | 50089 | 1 |
| Quadrant | Total seconds | Saturated seconds | Saturation percentage |
|---|---|---|---|
| A | 6518 | 3857 | 59.174593% |
| B | 6519 | 2009 | 30.817610% |
| C | 6519 | 105 | 1.610676% |
| D | 6519 | 5425 | 83.218285% |
Noise dominated data is calculated using 1-second bins in cleaned event files. If a bin has >2000 counts, and if more than 50% of those come from <1% of pixels, then it is considered to be noise-dominated and hence unusable.
| Quadrant | # 1 sec bins | Bins with >0 counts | Bins with >2000 counts | High rate bins dominated by noise | Noise dominated (total time) | Noise dominated (detector-on time) | Marked lightcurve |
|---|---|---|---|---|---|---|---|
| A | 7418 | 6519 | 3769 | 3769 | 50.81% | 57.82% | 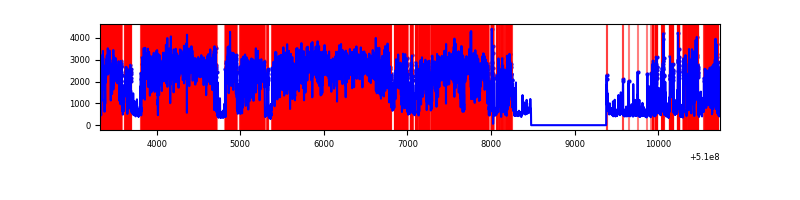 |
| B | 7419 | 6520 | 1332 | 1332 | 17.95% | 20.43% | 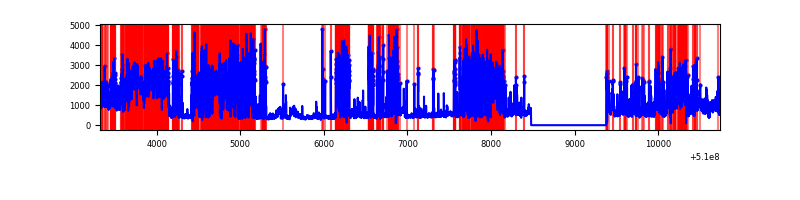 |
| C | 7419 | 6520 | 83 | 83 | 1.12% | 1.27% | 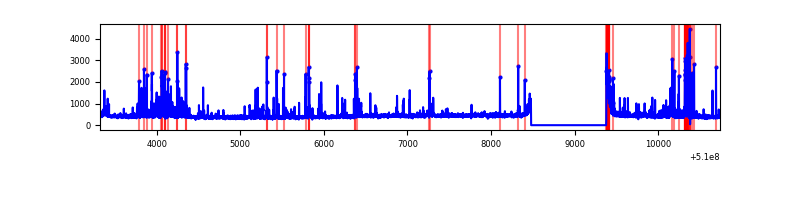 |
| D | 7419 | 6519 | 4794 | 4794 | 64.62% | 73.54% | 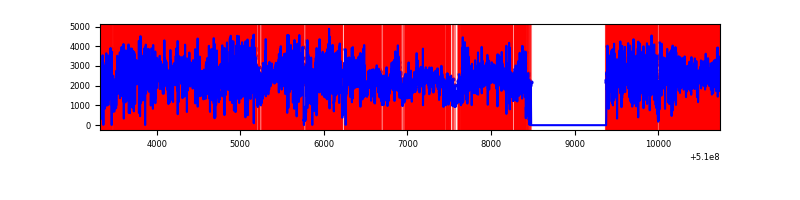 |
Top three noisy pixels from each quadrant. If the there are fewer than three noisy pixels in the level2.evt file, extra rows are filled as -1
| Pixel properties | Quadrant properties | ||||||
|---|---|---|---|---|---|---|---|
| Quadrant | DetID | PixID | Counts | Sigma | Mean | Median | Sigma |
| A | 12 | 3 | 5627863 | 48734.23 | 460 | 450 | 115.5 |
| A | 3 | 79 | 3161412 | 27374.4 | 460 | 450 | 115.5 |
| A | 4 | 95 | 726613 | 6288.68 | 460 | 450 | 115.5 |
| B | 4 | 206 | 4869127 | 39714.64 | 565 | 544 | 122.6 |
| B | 5 | 172 | 318853 | 2596.55 | 565 | 544 | 122.6 |
| B | 8 | 128 | 93896 | 761.5 | 565 | 544 | 122.6 |
| C | 15 | 230 | 219358 | 1212.1 | 654 | 647 | 180.4 |
| C | 12 | 249 | 157583 | 869.74 | 654 | 647 | 180.4 |
| C | 6 | 223 | 144081 | 794.91 | 654 | 647 | 180.4 |
| D | 8 | 129 | 13451463 | 143611.84 | 325 | 310 | 93.7 |
| D | 2 | 249 | 251234 | 2679.0 | 325 | 310 | 93.7 |
| D | 8 | 160 | 86446 | 919.63 | 325 | 310 | 93.7 |
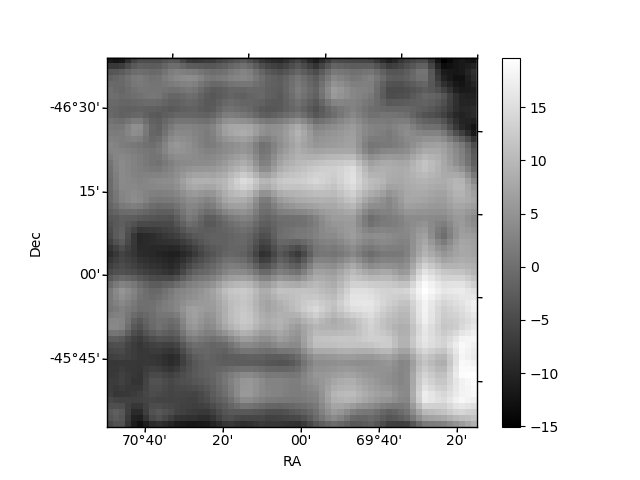
Histogram calculated using DETX and DETY for each event in the final _common_clean file
| Quadrant A |  |
 |
Quadrant B |
|---|---|---|---|
| Quadrant D |  |
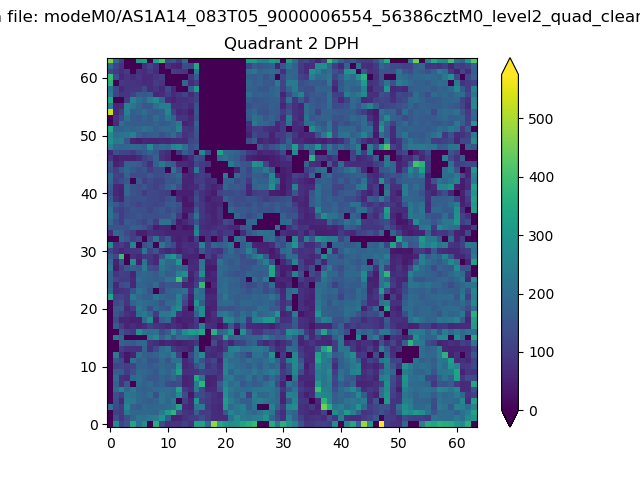 |
Quadrant C |
| Plot type | Count rate plots | Images |
|---|---|---|
| Comparison with Poisson distribution Blue bars denote a histogram of data divided into 1 sec bins. Red curve is a Poisson curve with rate = median count rate of data. |
 |
 |
| Quadrant-wise count rates Data is divided into 100 sec bins |
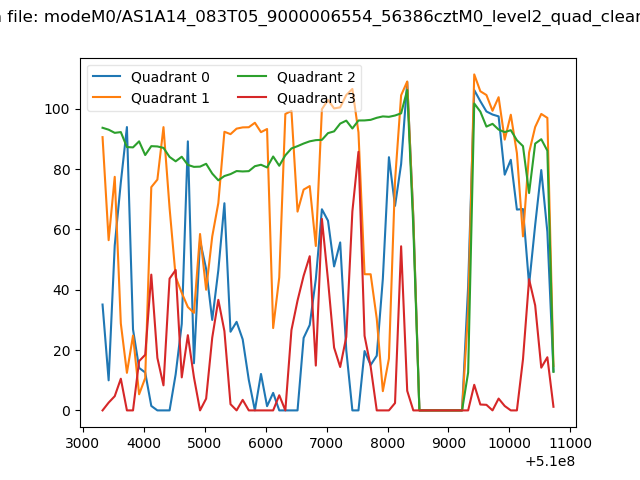 |
|
| Module-wise count rates for Quadrant A Data is divided into 100 sec bins |
 |
 |
| Module-wise count rates for Quadrant B Data is divided into 100 sec bins |
 |
 |
| Module-wise count rates for Quadrant C Data is divided into 100 sec bins |
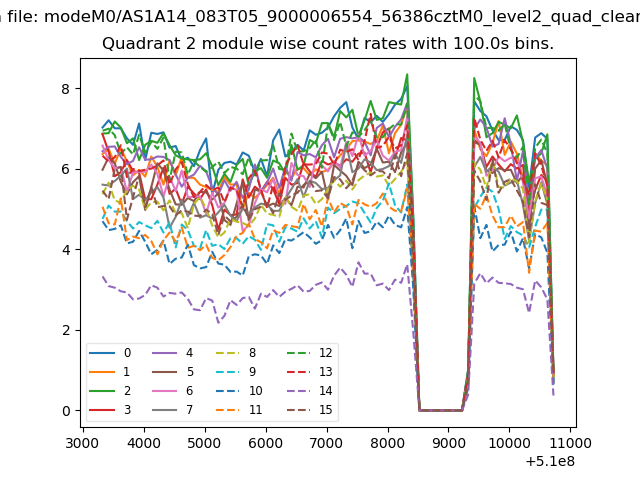 |
 |
| Module-wise count rates for Quadrant D Data is divided into 100 sec bins |
 |
 |
| Parameter | Plot |
|---|---|
| CZT HV Monitor |  |
| D_VDD | 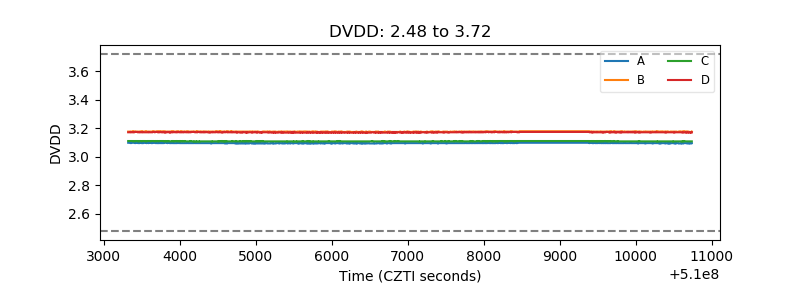 |
| Temperature 1 |  |
| Veto HV Monitor |  |
| Veto LLD | 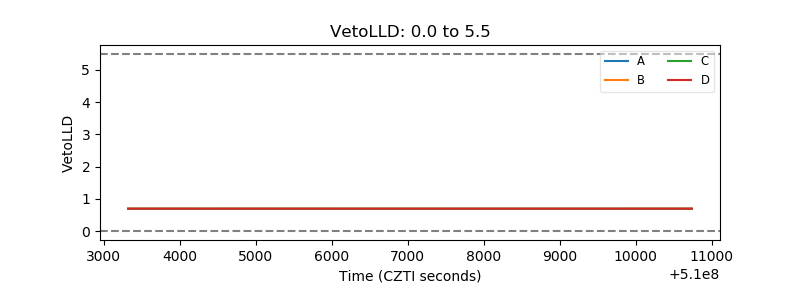 |
| Alpha Counter | 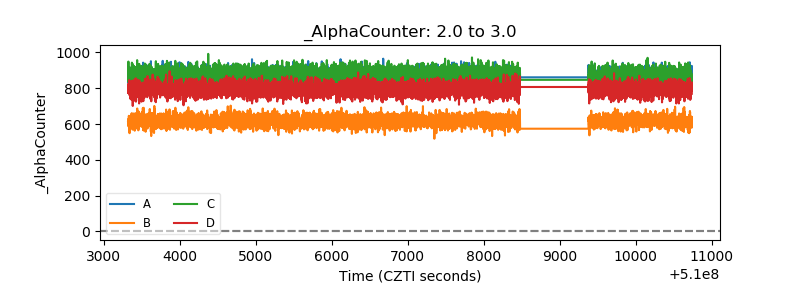 |
| _CPM_Rate | 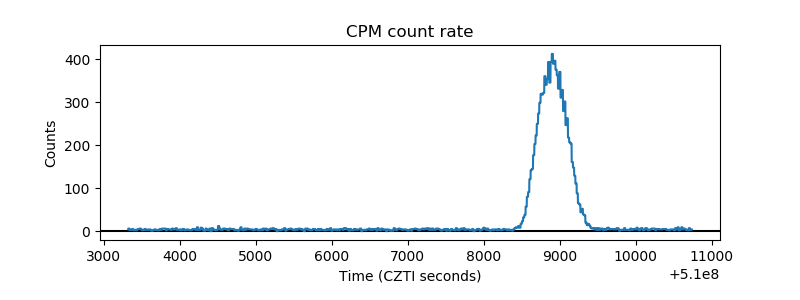 |
| CZT Counter |  |
| +2.5 Volts monitor |  |
| +5 Volts monitor |  |
| _ROLL_ROT | 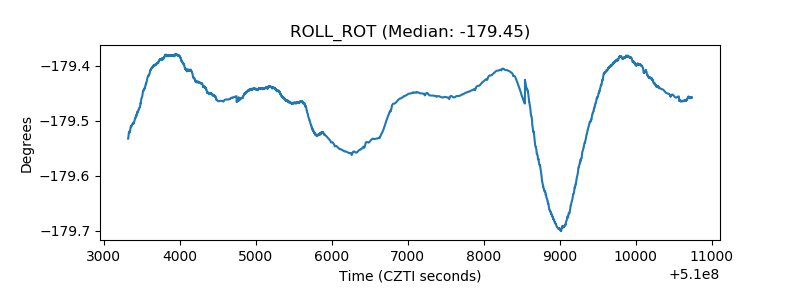 |
| _Roll_DEC |  |
| _Roll_RA | 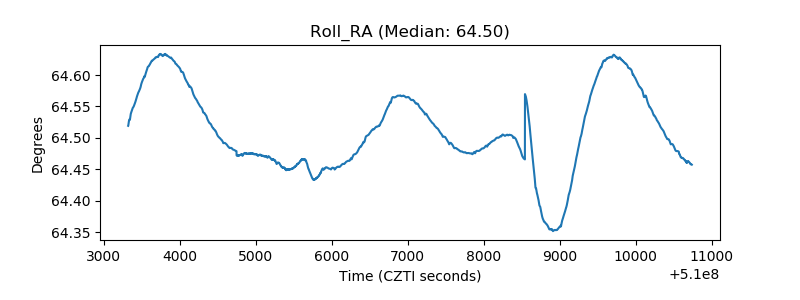 |
| Veto Counter |  |