| Param | Original file | Final file |
|---|---|---|
| Filename | modeM0/AS1A14_083T05_9000006554_56388cztM0_level2.fits | modeM0/AS1A14_083T05_9000006554_56388cztM0_level2_quad_clean.evt |
| Size (bytes) | 907,715,520 | 76,337,280 |
| Size | 865.7 MB | 72.8 MB |
| Events in quadrant A | 8,434,186 | 496,016 |
| Events in quadrant B | 6,427,379 | 586,549 |
| Events in quadrant C | 3,347,885 | 590,437 |
| Events in quadrant D | 14,883,304 | 178,974 |
| Mode M9 | |||
|---|---|---|---|
| Quadrant | BADHDUFLAG | Total packets | Discarded packets |
| A | 0 | 10 | 0 |
| B | 0 | 10 | 0 |
| C | 0 | 10 | 0 |
| D | 0 | 10 | 0 |
| Mode SS | |||
|---|---|---|---|
| Quadrant | BADHDUFLAG | Total packets | Discarded packets |
| A | 0 | 136 | 0 |
| B | 0 | 136 | 0 |
| C | 0 | 136 | 0 |
| D | 0 | 136 | 0 |
| Mode M0 | |||
|---|---|---|---|
| Quadrant | BADHDUFLAG | Total packets | Discarded packets |
| A | 0 | 29622 | 5 |
| B | 0 | 23696 | 2 |
| C | 0 | 14931 | 2 |
| D | 0 | 48778 | 2 |
| Quadrant | Total seconds | Saturated seconds | Saturation percentage |
|---|---|---|---|
| A | 6573 | 1591 | 24.205081% |
| B | 6574 | 1016 | 15.454822% |
| C | 6574 | 91 | 1.384241% |
| D | 6574 | 4611 | 70.139945% |
Noise dominated data is calculated using 1-second bins in cleaned event files. If a bin has >2000 counts, and if more than 50% of those come from <1% of pixels, then it is considered to be noise-dominated and hence unusable.
| Quadrant | # 1 sec bins | Bins with >0 counts | Bins with >2000 counts | High rate bins dominated by noise | Noise dominated (total time) | Noise dominated (detector-on time) | Marked lightcurve |
|---|---|---|---|---|---|---|---|
| A | 7608 | 6574 | 1650 | 1650 | 21.69% | 25.10% |  |
| B | 7609 | 6575 | 630 | 630 | 8.28% | 9.58% |  |
| C | 7609 | 6575 | 73 | 73 | 0.96% | 1.11% |  |
| D | 7609 | 6575 | 4266 | 4266 | 56.07% | 64.88% |  |
Top three noisy pixels from each quadrant. If the there are fewer than three noisy pixels in the level2.evt file, extra rows are filled as -1
| Pixel properties | Quadrant properties | ||||||
|---|---|---|---|---|---|---|---|
| Quadrant | DetID | PixID | Counts | Sigma | Mean | Median | Sigma |
| A | 4 | 95 | 3226243 | 20146.17 | 641 | 628 | 160.1 |
| A | 3 | 79 | 1419881 | 8864.2 | 641 | 628 | 160.1 |
| A | 12 | 3 | 405791 | 2530.52 | 641 | 628 | 160.1 |
| B | 4 | 206 | 2313545 | 16453.22 | 651 | 626 | 140.6 |
| B | 5 | 172 | 1270049 | 9030.19 | 651 | 626 | 140.6 |
| B | 8 | 128 | 58826 | 414.01 | 651 | 626 | 140.6 |
| C | 15 | 230 | 281388 | 1519.49 | 671 | 664 | 184.7 |
| C | 12 | 254 | 254216 | 1372.42 | 671 | 664 | 184.7 |
| C | 12 | 249 | 87228 | 468.55 | 671 | 664 | 184.7 |
| D | 8 | 129 | 12357008 | 106892.16 | 402 | 384 | 115.6 |
| D | 5 | 32 | 460819 | 3983.04 | 402 | 384 | 115.6 |
| D | 8 | 240 | 181900 | 1570.22 | 402 | 384 | 115.6 |
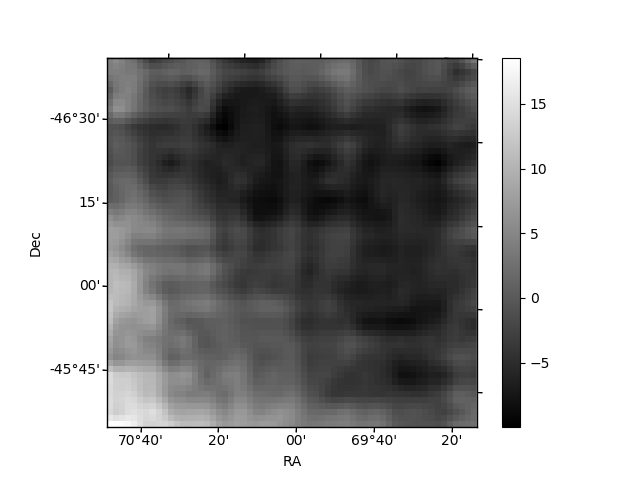
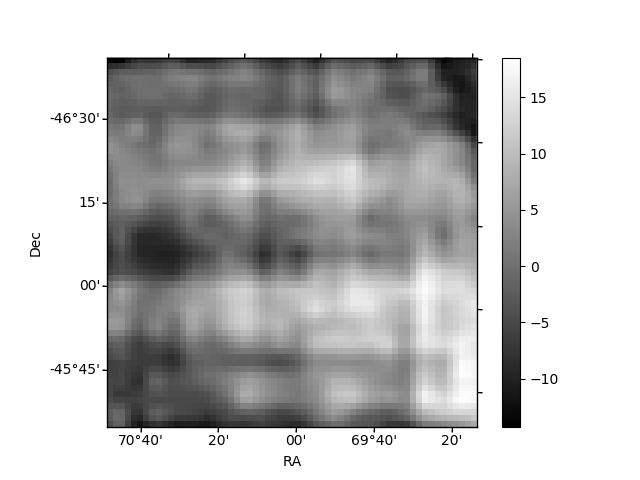
Histogram calculated using DETX and DETY for each event in the final _common_clean file
| Quadrant A |  |
 |
Quadrant B |
|---|---|---|---|
| Quadrant D |  |
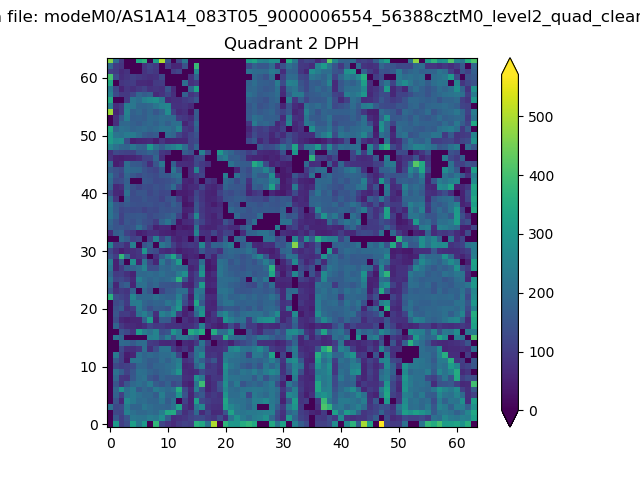 |
Quadrant C |
| Plot type | Count rate plots | Images |
|---|---|---|
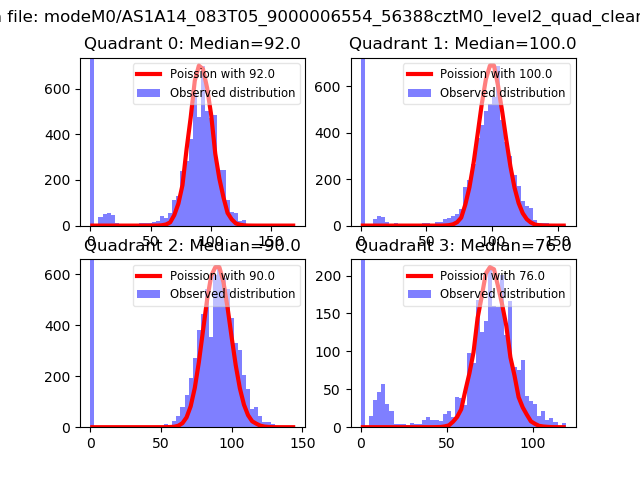
| Comparison with Poisson distribution Blue bars denote a histogram of data divided into 1 sec bins. Red curve is a Poisson curve with rate = median count rate of data. |
 |
 |
| Quadrant-wise count rates Data is divided into 100 sec bins |
 |
|
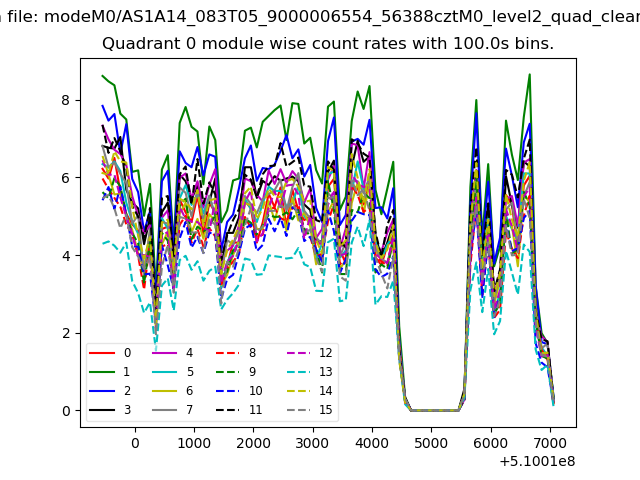
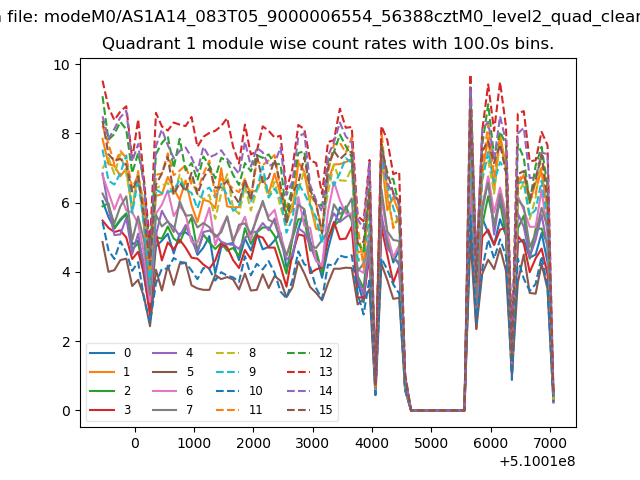
| Module-wise count rates for Quadrant A Data is divided into 100 sec bins |
 |
 |
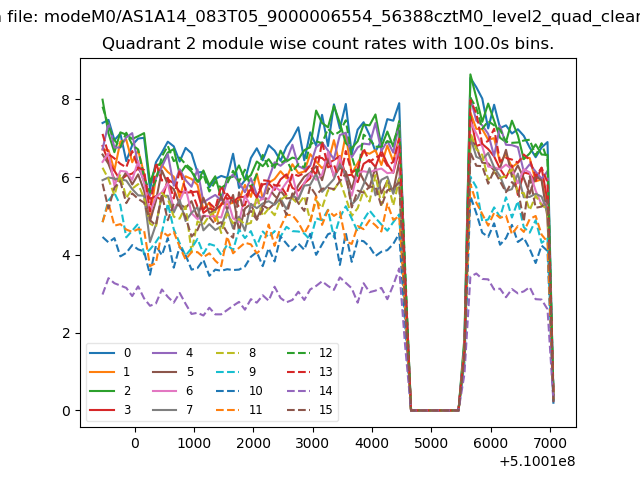
| Module-wise count rates for Quadrant B Data is divided into 100 sec bins |
 |
 |
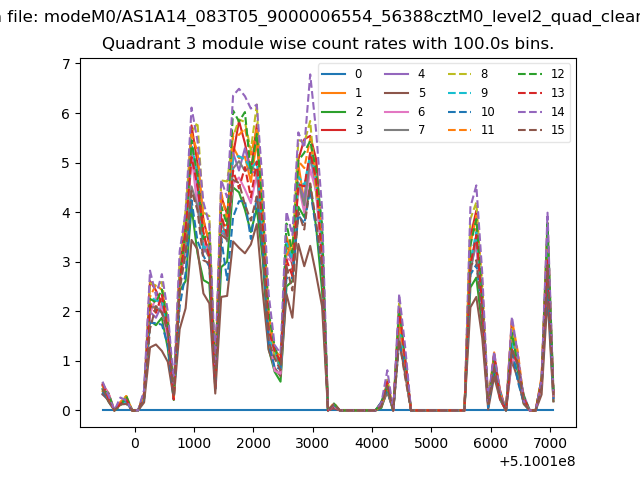
| Module-wise count rates for Quadrant C Data is divided into 100 sec bins |
 |
 |
| Module-wise count rates for Quadrant D Data is divided into 100 sec bins |
 |
 |
| Parameter | Plot |
|---|---|
| CZT HV Monitor | 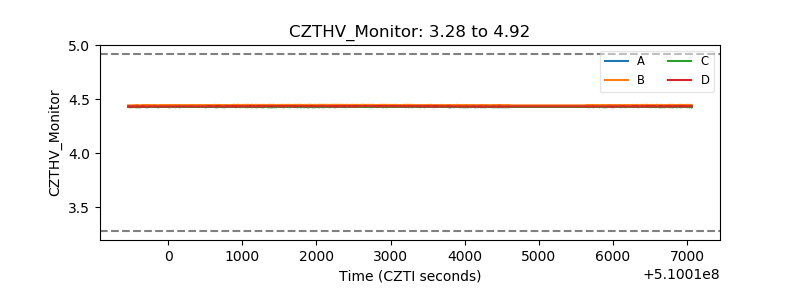 |
| D_VDD |  |
| Temperature 1 | 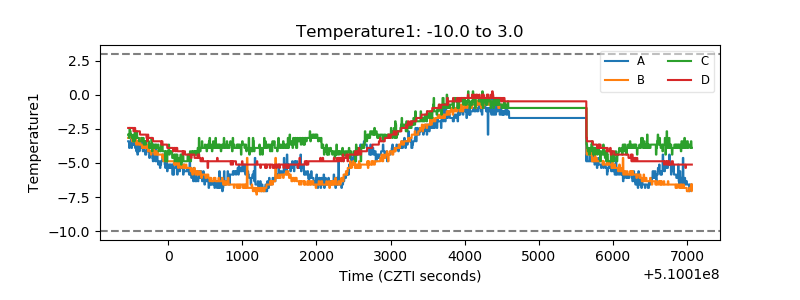 |
| Veto HV Monitor |  |
| Veto LLD | 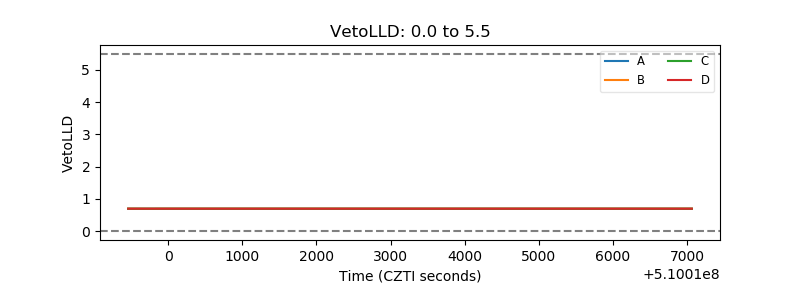 |
| Alpha Counter | 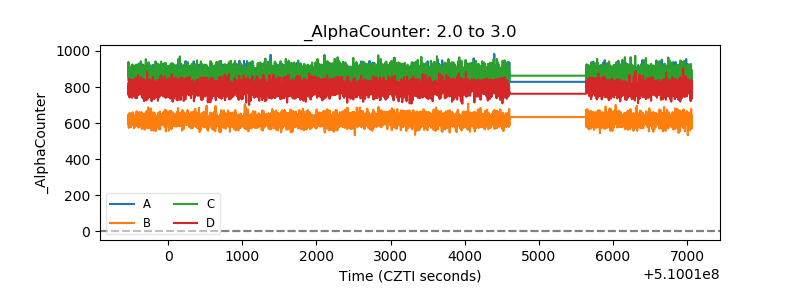 |
| _CPM_Rate | 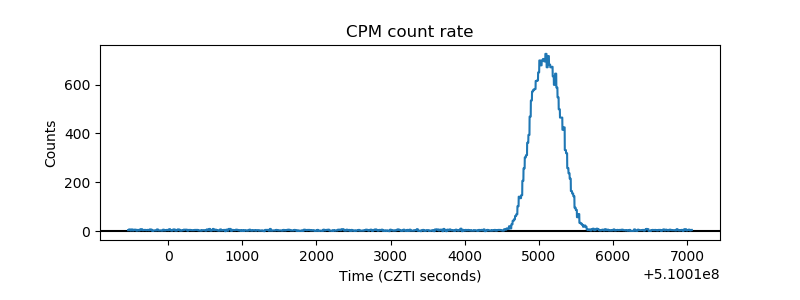 |
| CZT Counter | 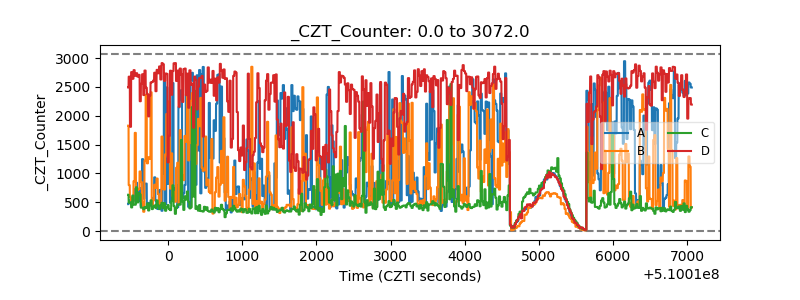 |
| +2.5 Volts monitor |  |
| +5 Volts monitor | 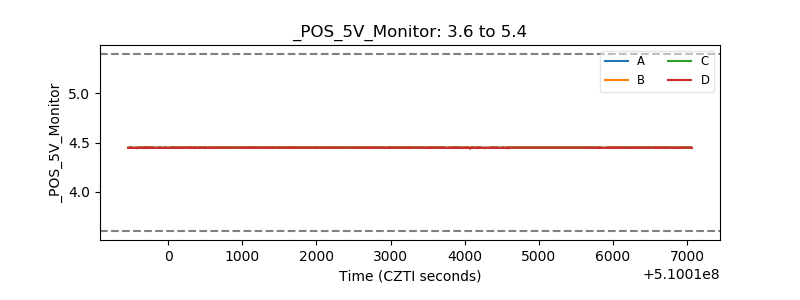 |
| _ROLL_ROT |  |
| _Roll_DEC |  |
| _Roll_RA |  |
| Veto Counter |  |