| Param | Original file | Final file |
|---|---|---|
| Filename | modeM0/AS1A14_083T05_9000006554_56389cztM0_level2.fits | modeM0/AS1A14_083T05_9000006554_56389cztM0_level2_quad_clean.evt |
| Size (bytes) | 947,304,000 | 79,030,080 |
| Size | 903.4 MB | 75.4 MB |
| Events in quadrant A | 10,653,211 | 484,471 |
| Events in quadrant B | 6,106,337 | 616,946 |
| Events in quadrant C | 3,354,829 | 627,510 |
| Events in quadrant D | 14,428,019 | 191,036 |
| Mode M9 | |||
|---|---|---|---|
| Quadrant | BADHDUFLAG | Total packets | Discarded packets |
| A | 0 | 16 | 0 |
| B | 0 | 17 | 0 |
| C | 0 | 17 | 0 |
| D | 0 | 17 | 0 |
| Mode SS | |||
|---|---|---|---|
| Quadrant | BADHDUFLAG | Total packets | Discarded packets |
| A | 0 | 138 | 0 |
| B | 0 | 138 | 0 |
| C | 0 | 138 | 0 |
| D | 0 | 138 | 0 |
| Mode M0 | |||
|---|---|---|---|
| Quadrant | BADHDUFLAG | Total packets | Discarded packets |
| A | 0 | 36358 | 2 |
| B | 0 | 22846 | 2 |
| C | 0 | 15006 | 2 |
| D | 0 | 47559 | 2 |
| Quadrant | Total seconds | Saturated seconds | Saturation percentage |
|---|---|---|---|
| A | 6779 | 2206 | 32.541673% |
| B | 6779 | 1068 | 15.754536% |
| C | 6779 | 93 | 1.371884% |
| D | 6779 | 4670 | 68.889217% |
Noise dominated data is calculated using 1-second bins in cleaned event files. If a bin has >2000 counts, and if more than 50% of those come from <1% of pixels, then it is considered to be noise-dominated and hence unusable.
| Quadrant | # 1 sec bins | Bins with >0 counts | Bins with >2000 counts | High rate bins dominated by noise | Noise dominated (total time) | Noise dominated (detector-on time) | Marked lightcurve |
|---|---|---|---|---|---|---|---|
| A | 7879 | 6780 | 2335 | 2335 | 29.64% | 34.44% |  |
| B | 7879 | 6780 | 696 | 696 | 8.83% | 10.27% |  |
| C | 7879 | 6780 | 52 | 52 | 0.66% | 0.77% |  |
| D | 7879 | 6779 | 4024 | 4024 | 51.07% | 59.36% |  |
Top three noisy pixels from each quadrant. If the there are fewer than three noisy pixels in the level2.evt file, extra rows are filled as -1
| Pixel properties | Quadrant properties | ||||||
|---|---|---|---|---|---|---|---|
| Quadrant | DetID | PixID | Counts | Sigma | Mean | Median | Sigma |
| A | 4 | 95 | 5999768 | 36166.66 | 663 | 648 | 165.9 |
| A | 4 | 249 | 591665 | 3563.04 | 663 | 648 | 165.9 |
| A | 12 | 3 | 563325 | 3392.19 | 663 | 648 | 165.9 |
| B | 4 | 206 | 1539454 | 10721.09 | 673 | 648 | 143.5 |
| B | 5 | 172 | 1289115 | 8976.94 | 673 | 648 | 143.5 |
| B | 5 | 185 | 333274 | 2317.46 | 673 | 648 | 143.5 |
| C | 12 | 254 | 182311 | 934.62 | 714 | 708 | 194.3 |
| C | 15 | 230 | 128852 | 659.49 | 714 | 708 | 194.3 |
| C | 2 | 255 | 104209 | 532.67 | 714 | 708 | 194.3 |
| D | 8 | 129 | 12058147 | 108199.34 | 384 | 366 | 111.4 |
| D | 12 | 3 | 185629 | 1662.44 | 384 | 366 | 111.4 |
| D | 8 | 240 | 160318 | 1435.31 | 384 | 366 | 111.4 |
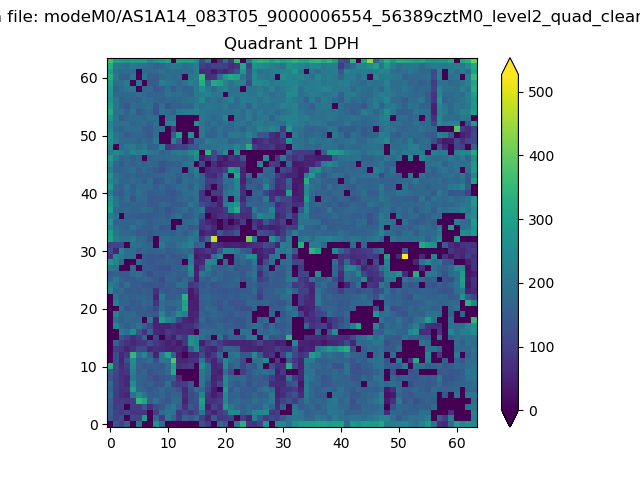
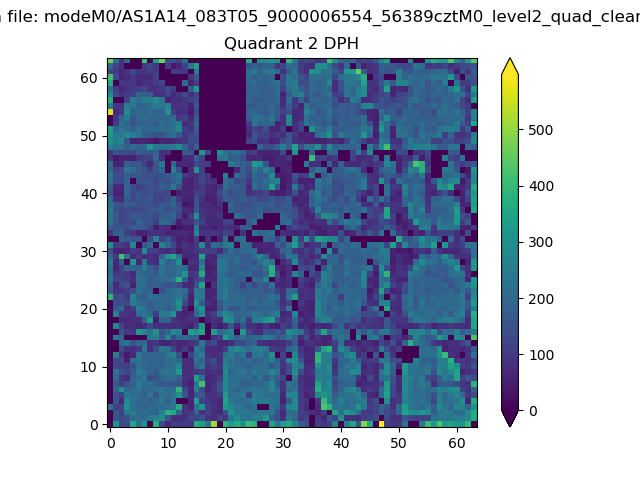
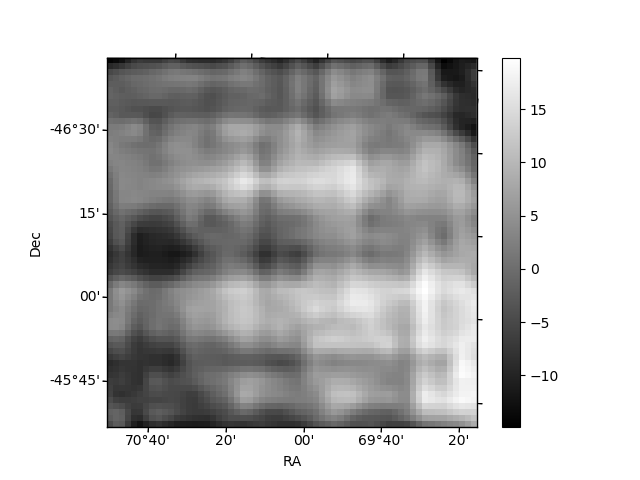
Histogram calculated using DETX and DETY for each event in the final _common_clean file
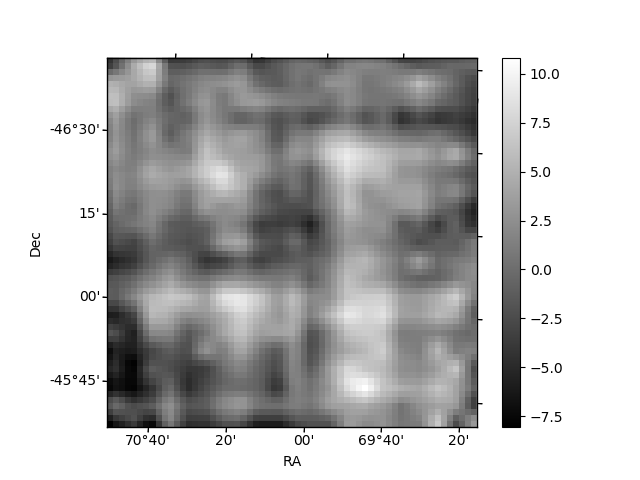
| Quadrant A |  |
 |
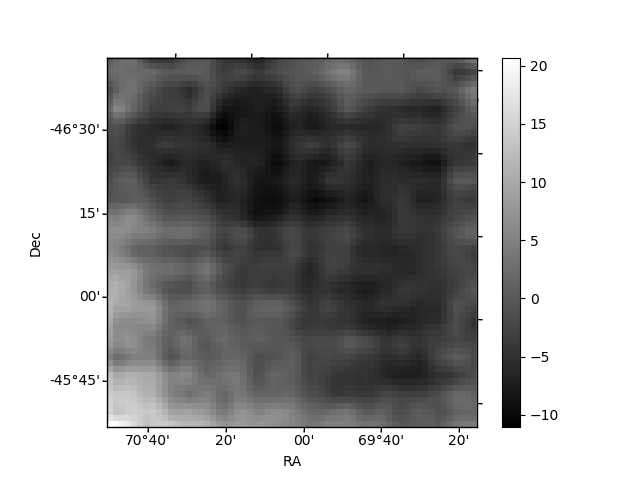
Quadrant B |
|---|---|---|---|
| Quadrant D |  |
 |
Quadrant C |
| Plot type | Count rate plots | Images |
|---|---|---|
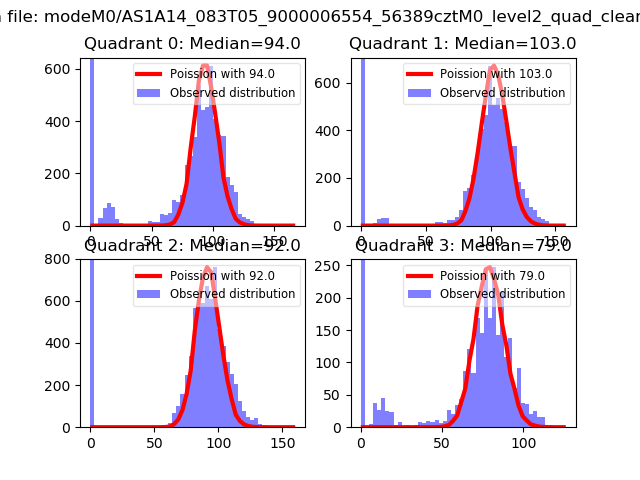
| Comparison with Poisson distribution Blue bars denote a histogram of data divided into 1 sec bins. Red curve is a Poisson curve with rate = median count rate of data. |
 |
 |
| Quadrant-wise count rates Data is divided into 100 sec bins |
 |
|
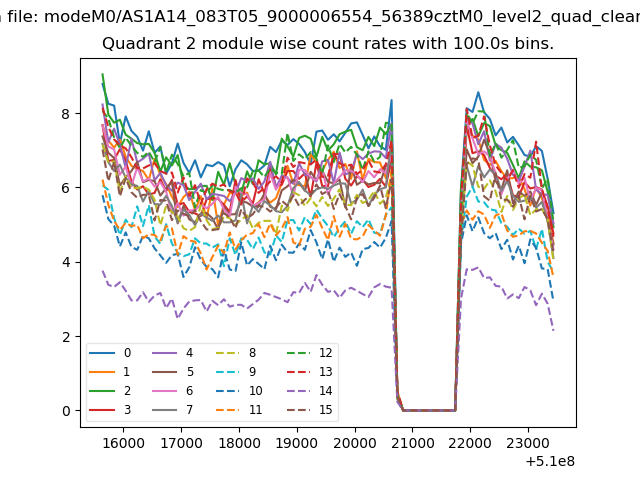
| Module-wise count rates for Quadrant A Data is divided into 100 sec bins |
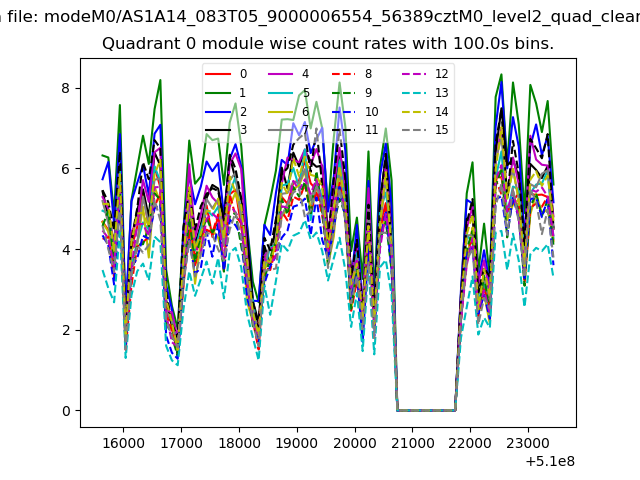 |
 |
| Module-wise count rates for Quadrant B Data is divided into 100 sec bins |
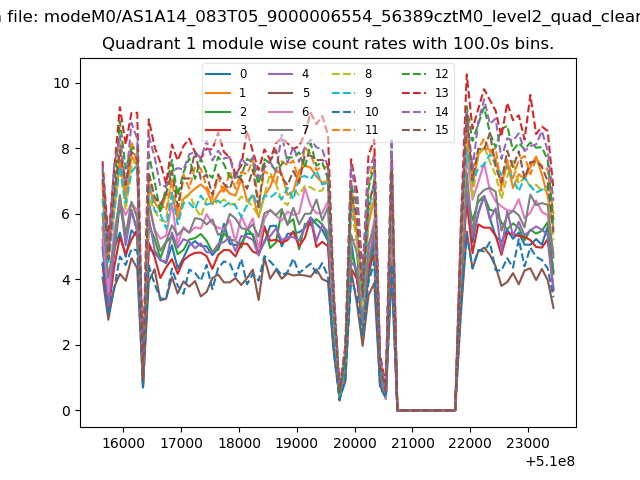 |
 |
| Module-wise count rates for Quadrant C Data is divided into 100 sec bins |
 |
 |
| Module-wise count rates for Quadrant D Data is divided into 100 sec bins |
 |
 |
| Parameter | Plot |
|---|---|
| CZT HV Monitor | 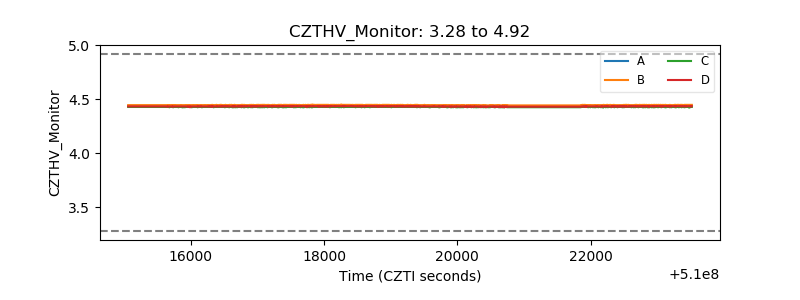 |
| D_VDD |  |
| Temperature 1 | 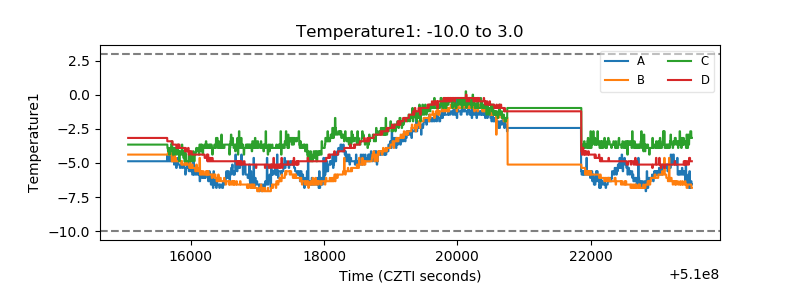 |
| Veto HV Monitor |  |
| Veto LLD | 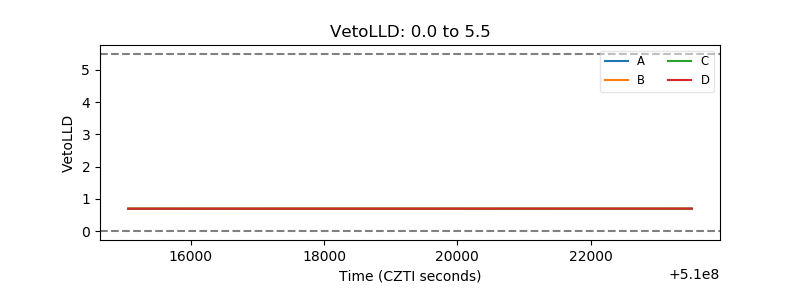 |
| Alpha Counter |  |
| _CPM_Rate | 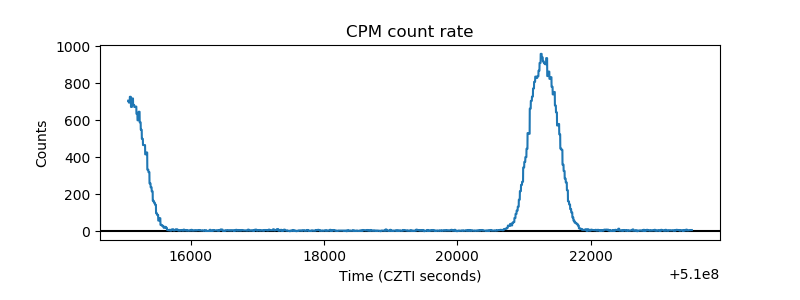 |
| CZT Counter | 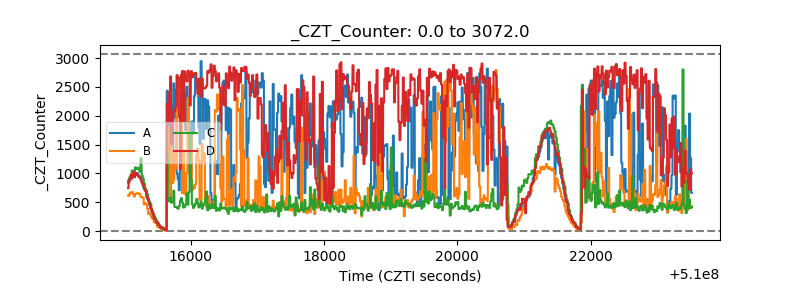 |
| +2.5 Volts monitor | 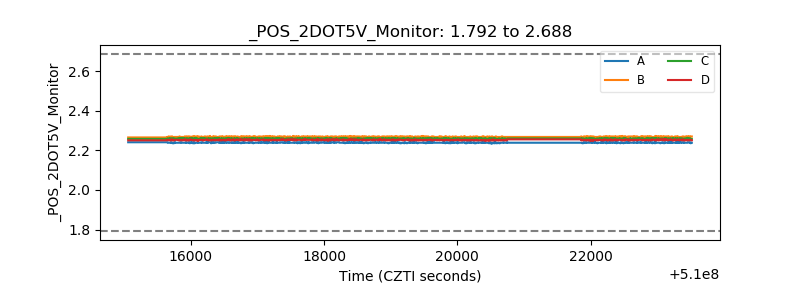 |
| +5 Volts monitor | 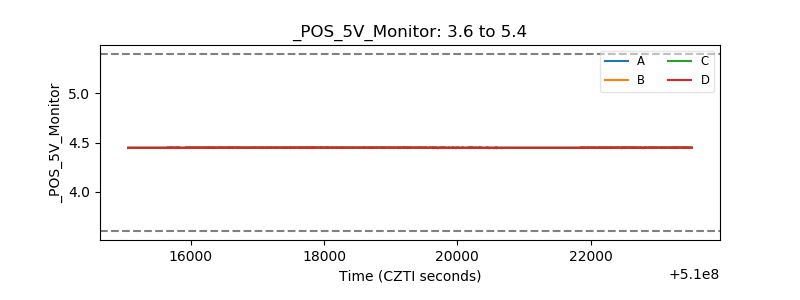 |
| _ROLL_ROT |  |
| _Roll_DEC |  |
| _Roll_RA |  |
| Veto Counter |  |