| Param | Original file | Final file |
|---|---|---|
| Filename | modeM0/AS1A14_083T05_9000006554_56390cztM0_level2.fits | modeM0/AS1A14_083T05_9000006554_56390cztM0_level2_quad_clean.evt |
| Size (bytes) | 845,297,280 | 74,943,360 |
| Size | 806.1 MB | 71.5 MB |
| Events in quadrant A | 9,101,116 | 447,411 |
| Events in quadrant B | 5,189,967 | 637,269 |
| Events in quadrant C | 4,057,947 | 579,189 |
| Events in quadrant D | 12,445,808 | 159,138 |
| Mode M9 | |||
|---|---|---|---|
| Quadrant | BADHDUFLAG | Total packets | Discarded packets |
| A | 0 | 12 | 0 |
| B | 0 | 12 | 0 |
| C | 0 | 12 | 0 |
| D | 0 | 12 | 0 |
| Mode SS | |||
|---|---|---|---|
| Quadrant | BADHDUFLAG | Total packets | Discarded packets |
| A | 0 | 130 | 0 |
| B | 0 | 130 | 0 |
| C | 0 | 130 | 0 |
| D | 0 | 130 | 0 |
| Mode M0 | |||
|---|---|---|---|
| Quadrant | BADHDUFLAG | Total packets | Discarded packets |
| A | 0 | 31391 | 4 |
| B | 0 | 19755 | 1 |
| C | 0 | 16616 | 1 |
| D | 0 | 41422 | 1 |
| Quadrant | Total seconds | Saturated seconds | Saturation percentage |
|---|---|---|---|
| A | 6391 | 2002 | 31.325301% |
| B | 6391 | 677 | 10.593021% |
| C | 6392 | 335 | 5.240926% |
| D | 6392 | 4656 | 72.841051% |
Noise dominated data is calculated using 1-second bins in cleaned event files. If a bin has >2000 counts, and if more than 50% of those come from <1% of pixels, then it is considered to be noise-dominated and hence unusable.
| Quadrant | # 1 sec bins | Bins with >0 counts | Bins with >2000 counts | High rate bins dominated by noise | Noise dominated (total time) | Noise dominated (detector-on time) | Marked lightcurve |
|---|---|---|---|---|---|---|---|
| A | 7586 | 6392 | 1894 | 1894 | 24.97% | 29.63% |  |
| B | 7586 | 6392 | 383 | 383 | 5.05% | 5.99% |  |
| C | 7587 | 6393 | 245 | 245 | 3.23% | 3.83% |  |
| D | 7587 | 6392 | 3321 | 3321 | 43.77% | 51.96% |  |
Top three noisy pixels from each quadrant. If the there are fewer than three noisy pixels in the level2.evt file, extra rows are filled as -1
| Pixel properties | Quadrant properties | ||||||
|---|---|---|---|---|---|---|---|
| Quadrant | DetID | PixID | Counts | Sigma | Mean | Median | Sigma |
| A | 4 | 95 | 2830559 | 19261.06 | 584 | 569 | 146.9 |
| A | 12 | 3 | 2238561 | 15231.89 | 584 | 569 | 146.9 |
| A | 3 | 79 | 1065335 | 7246.85 | 584 | 569 | 146.9 |
| B | 4 | 206 | 1841659 | 13136.41 | 666 | 641 | 140.1 |
| B | 5 | 172 | 360484 | 2567.63 | 666 | 641 | 140.1 |
| B | 8 | 128 | 67741 | 478.79 | 666 | 641 | 140.1 |
| C | 15 | 230 | 498450 | 2733.82 | 667 | 660 | 182.1 |
| C | 12 | 249 | 303398 | 1662.61 | 667 | 660 | 182.1 |
| C | 13 | 3 | 195327 | 1069.09 | 667 | 660 | 182.1 |
| D | 8 | 129 | 10851871 | 126632.56 | 301 | 288 | 85.7 |
| D | 2 | 249 | 132510 | 1542.96 | 301 | 288 | 85.7 |
| D | 12 | 3 | 94306 | 1097.14 | 301 | 288 | 85.7 |
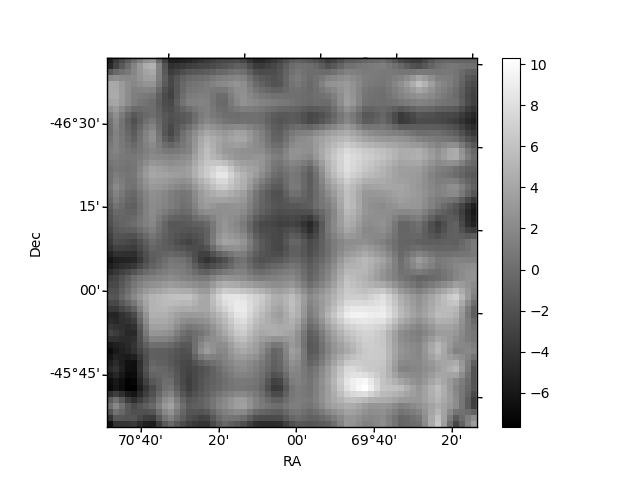
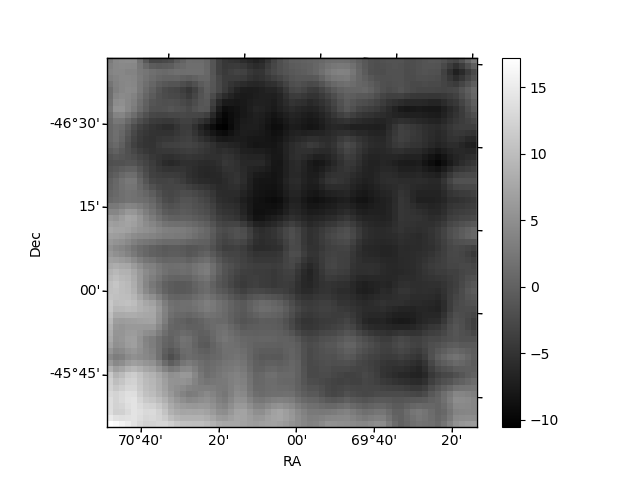
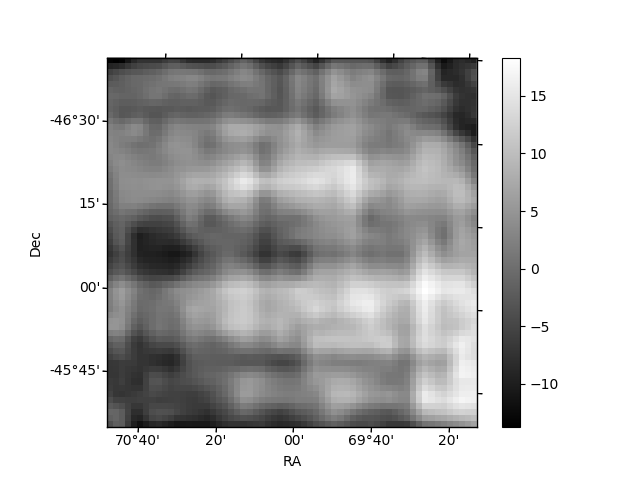
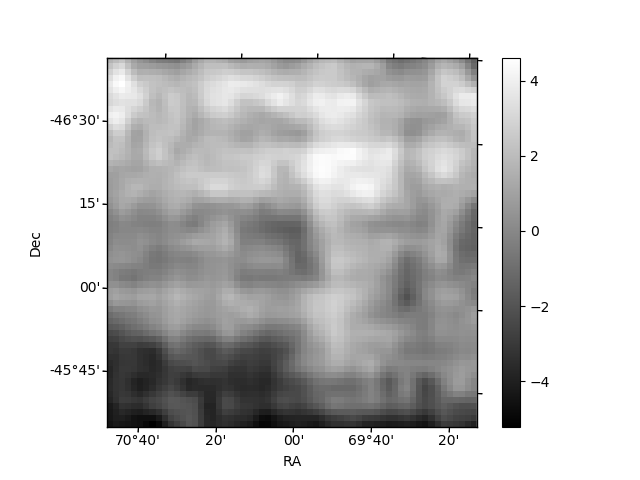
Histogram calculated using DETX and DETY for each event in the final _common_clean file
| Quadrant A | 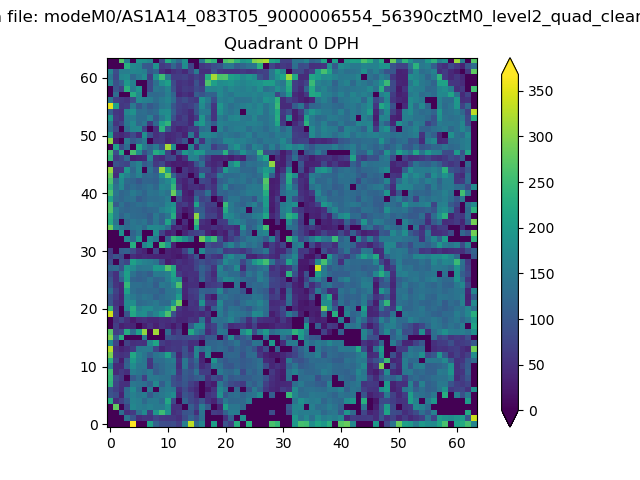 |
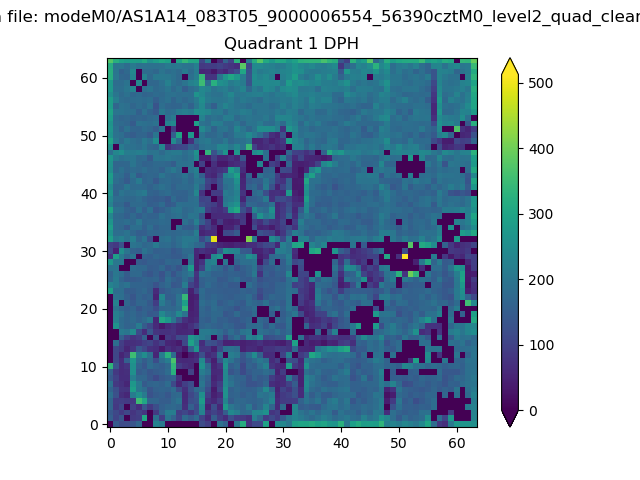 |
Quadrant B |
|---|---|---|---|
| Quadrant D |  |
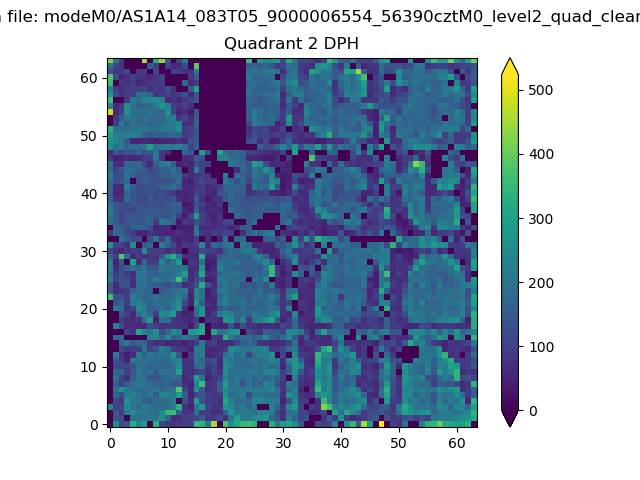 |
Quadrant C |
| Plot type | Count rate plots | Images |
|---|---|---|
| Comparison with Poisson distribution Blue bars denote a histogram of data divided into 1 sec bins. Red curve is a Poisson curve with rate = median count rate of data. |
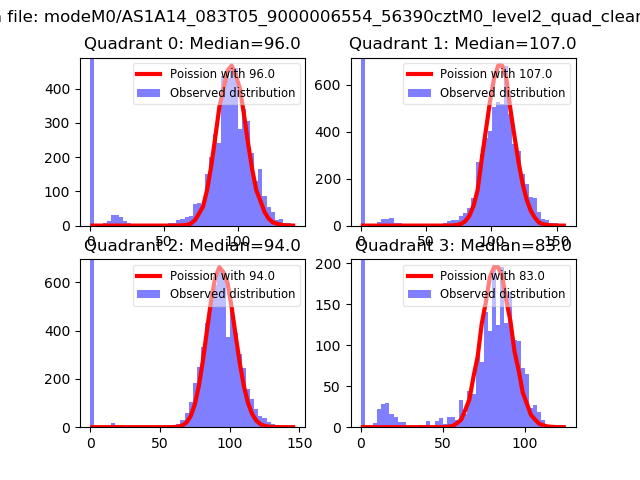 |
 |
| Quadrant-wise count rates Data is divided into 100 sec bins |
 |
|
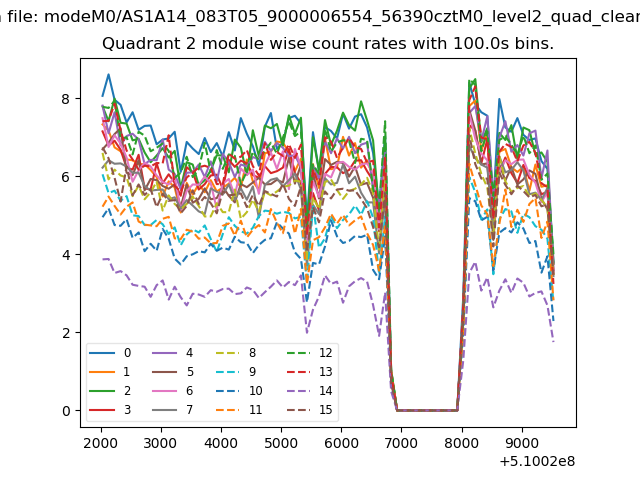
| Module-wise count rates for Quadrant A Data is divided into 100 sec bins |
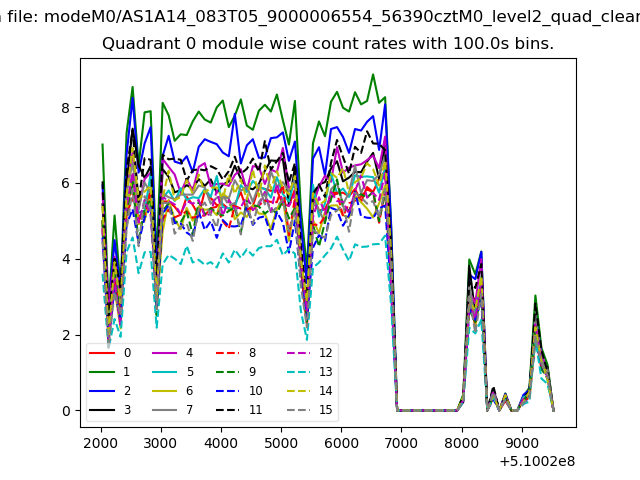 |
 |
| Module-wise count rates for Quadrant B Data is divided into 100 sec bins |
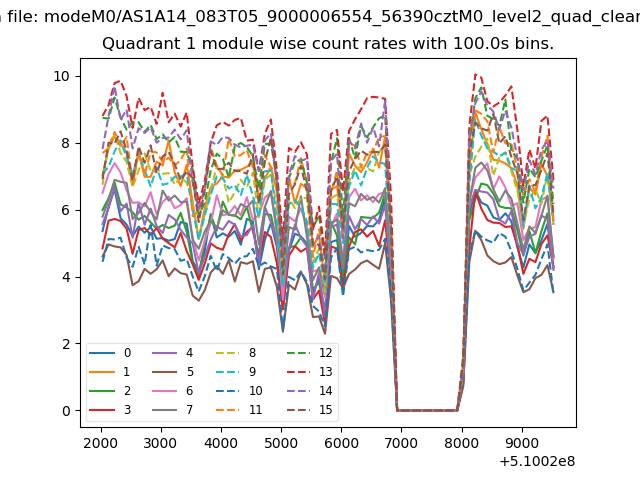 |
 |
| Module-wise count rates for Quadrant C Data is divided into 100 sec bins |
 |
 |
| Module-wise count rates for Quadrant D Data is divided into 100 sec bins |
 |
 |
| Parameter | Plot |
|---|---|
| CZT HV Monitor | 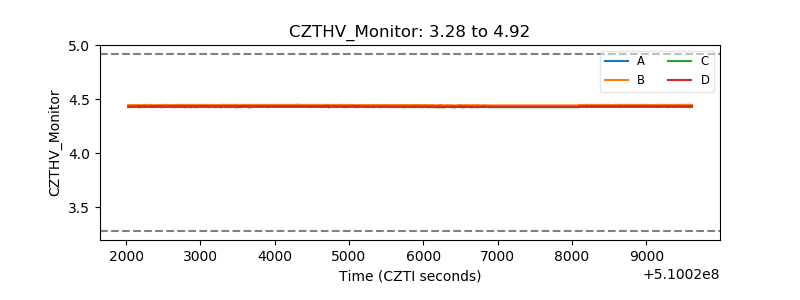 |
| D_VDD |  |
| Temperature 1 | 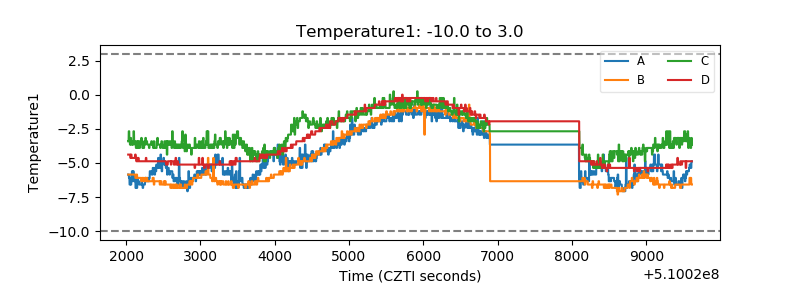 |
| Veto HV Monitor |  |
| Veto LLD | 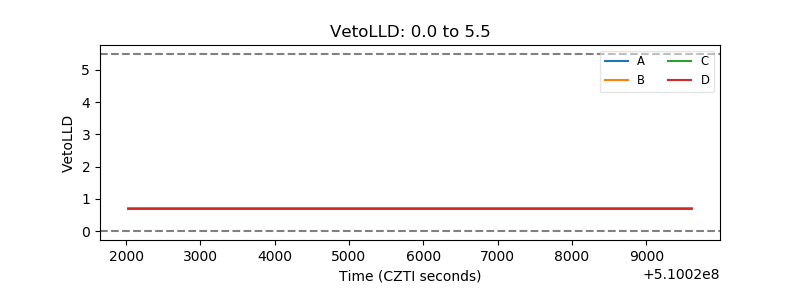 |
| Alpha Counter | 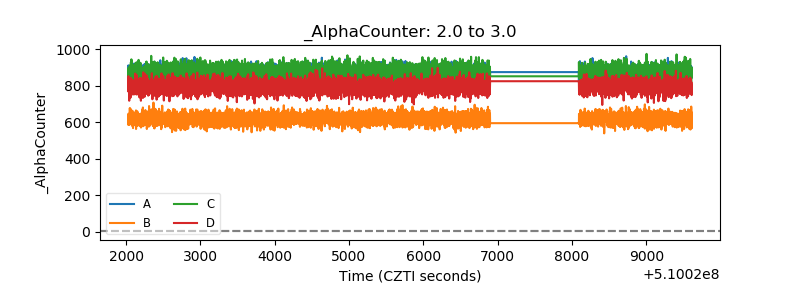 |
| _CPM_Rate | 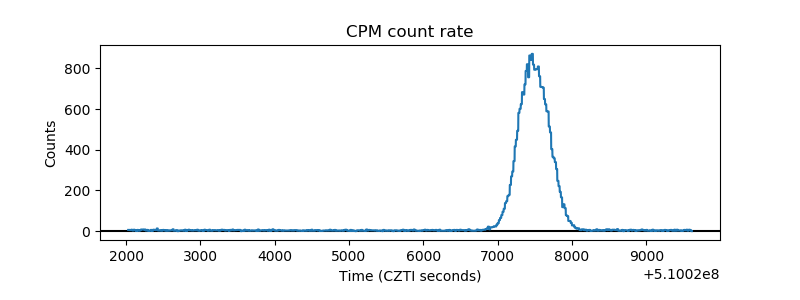 |
| CZT Counter | 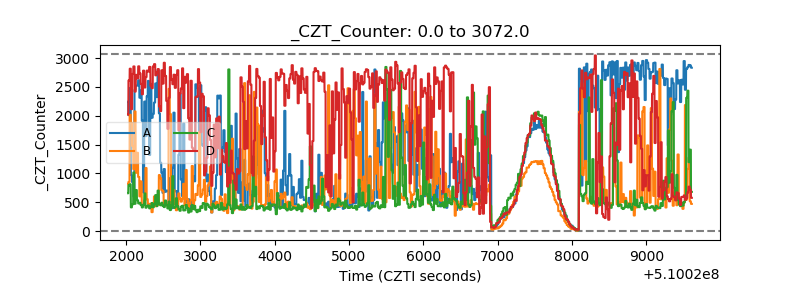 |
| +2.5 Volts monitor |  |
| +5 Volts monitor | 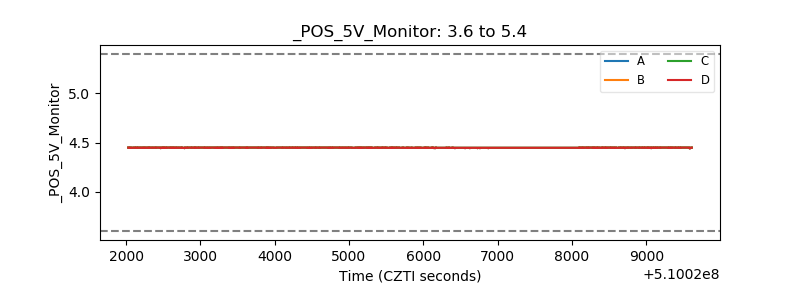 |
| _ROLL_ROT |  |
| _Roll_DEC |  |
| _Roll_RA | 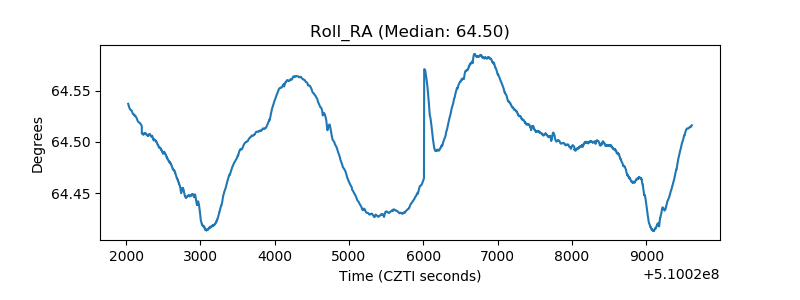 |
| Veto Counter |  |