| Param | Original file | Final file |
|---|---|---|
| Filename | modeM0/AS1A14_083T05_9000006554_56391cztM0_level2.fits | modeM0/AS1A14_083T05_9000006554_56391cztM0_level2_quad_clean.evt |
| Size (bytes) | 988,413,120 | 67,037,760 |
| Size | 942.6 MB | 63.9 MB |
| Events in quadrant A | 13,760,533 | 255,823 |
| Events in quadrant B | 5,517,053 | 645,539 |
| Events in quadrant C | 4,370,097 | 587,793 |
| Events in quadrant D | 12,431,230 | 82,234 |
| Mode M9 | |||
|---|---|---|---|
| Quadrant | BADHDUFLAG | Total packets | Discarded packets |
| A | 0 | 15 | 0 |
| B | 0 | 16 | 0 |
| C | 0 | 16 | 0 |
| D | 0 | 16 | 0 |
| Mode SS | |||
|---|---|---|---|
| Quadrant | BADHDUFLAG | Total packets | Discarded packets |
| A | 0 | 134 | 0 |
| B | 0 | 134 | 0 |
| C | 0 | 134 | 0 |
| D | 0 | 134 | 0 |
| Mode M0 | |||
|---|---|---|---|
| Quadrant | BADHDUFLAG | Total packets | Discarded packets |
| A | 0 | 45240 | 2 |
| B | 0 | 20842 | 2 |
| C | 0 | 17685 | 2 |
| D | 0 | 41502 | 2 |
| Quadrant | Total seconds | Saturated seconds | Saturation percentage |
|---|---|---|---|
| A | 6568 | 4300 | 65.468940% |
| B | 6568 | 803 | 12.225944% |
| C | 6568 | 508 | 7.734470% |
| D | 6568 | 5676 | 86.419001% |
Noise dominated data is calculated using 1-second bins in cleaned event files. If a bin has >2000 counts, and if more than 50% of those come from <1% of pixels, then it is considered to be noise-dominated and hence unusable.
| Quadrant | # 1 sec bins | Bins with >0 counts | Bins with >2000 counts | High rate bins dominated by noise | Noise dominated (total time) | Noise dominated (detector-on time) | Marked lightcurve |
|---|---|---|---|---|---|---|---|
| A | 7683 | 6569 | 3966 | 3966 | 51.62% | 60.37% |  |
| B | 7683 | 6569 | 371 | 371 | 4.83% | 5.65% |  |
| C | 7683 | 6569 | 304 | 304 | 3.96% | 4.63% |  |
| D | 7682 | 6567 | 3479 | 3479 | 45.29% | 52.98% |  |
Top three noisy pixels from each quadrant. If the there are fewer than three noisy pixels in the level2.evt file, extra rows are filled as -1
| Pixel properties | Quadrant properties | ||||||
|---|---|---|---|---|---|---|---|
| Quadrant | DetID | PixID | Counts | Sigma | Mean | Median | Sigma |
| A | 12 | 3 | 5079998 | 42123.9 | 482 | 469 | 120.6 |
| A | 3 | 79 | 2470366 | 20482.55 | 482 | 469 | 120.6 |
| A | 4 | 95 | 2252538 | 18676.13 | 482 | 469 | 120.6 |
| B | 4 | 206 | 2159813 | 14697.49 | 697 | 672 | 146.9 |
| B | 5 | 172 | 246522 | 1673.53 | 697 | 672 | 146.9 |
| B | 5 | 185 | 97129 | 656.59 | 697 | 672 | 146.9 |
| C | 15 | 230 | 1178565 | 6266.36 | 694 | 689 | 188.0 |
| C | 13 | 3 | 138375 | 732.49 | 694 | 689 | 188.0 |
| C | 12 | 112 | 120568 | 637.76 | 694 | 689 | 188.0 |
| D | 8 | 129 | 11521066 | 229600.56 | 172 | 164 | 50.2 |
| D | 8 | 113 | 117705 | 2342.48 | 172 | 164 | 50.2 |
| D | 7 | 96 | 25012 | 495.2 | 172 | 164 | 50.2 |
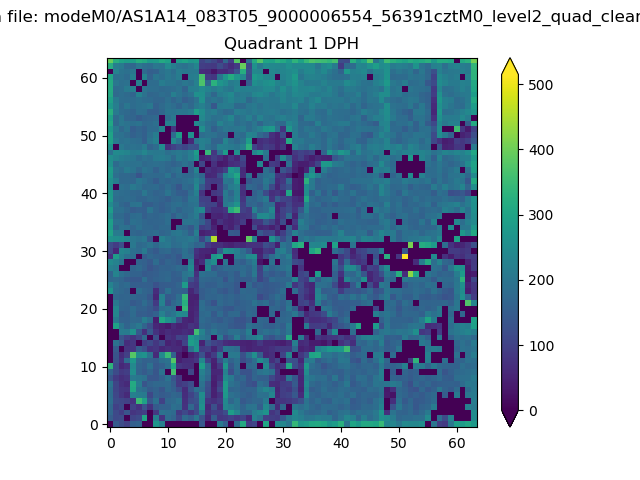
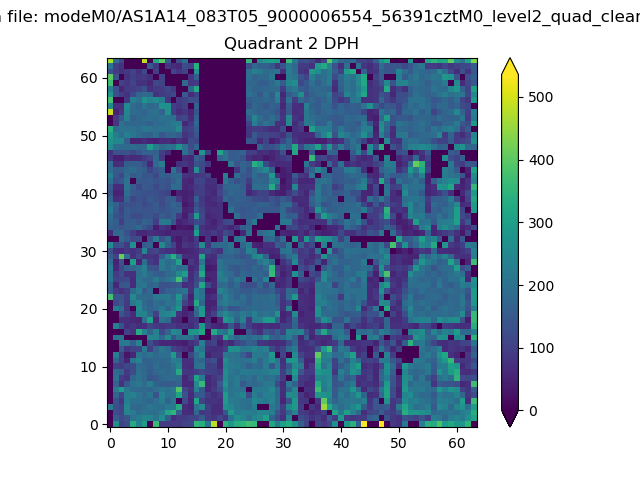
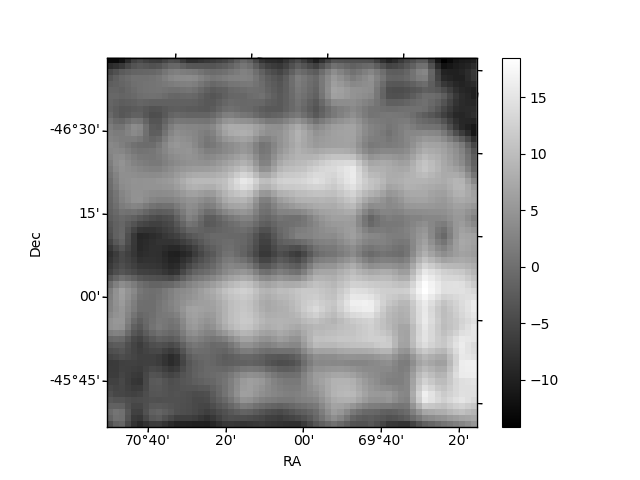
Histogram calculated using DETX and DETY for each event in the final _common_clean file
| Quadrant A |  |
 |
Quadrant B |
|---|---|---|---|
| Quadrant D |  |
 |
Quadrant C |
| Plot type | Count rate plots | Images |
|---|---|---|
| Comparison with Poisson distribution Blue bars denote a histogram of data divided into 1 sec bins. Red curve is a Poisson curve with rate = median count rate of data. |
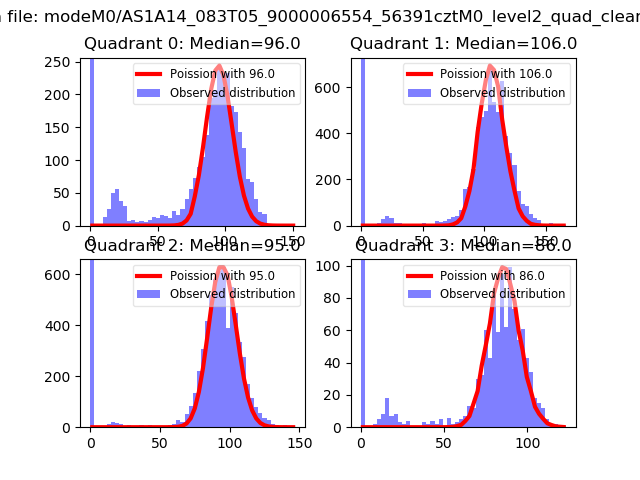 |
 |
| Quadrant-wise count rates Data is divided into 100 sec bins |
 |
|
| Module-wise count rates for Quadrant A Data is divided into 100 sec bins |
 |
 |
| Module-wise count rates for Quadrant B Data is divided into 100 sec bins |
 |
 |
| Module-wise count rates for Quadrant C Data is divided into 100 sec bins |
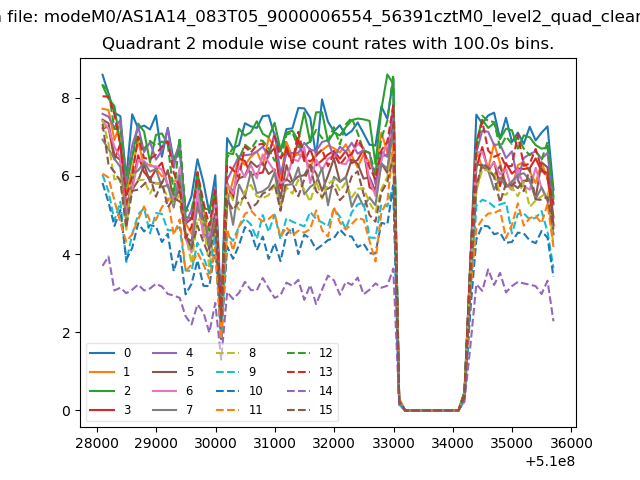 |
 |
| Module-wise count rates for Quadrant D Data is divided into 100 sec bins |
 |
 |
| Parameter | Plot |
|---|---|
| CZT HV Monitor | 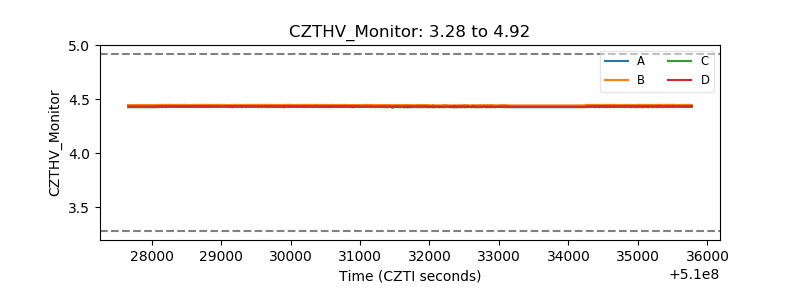 |
| D_VDD |  |
| Temperature 1 | 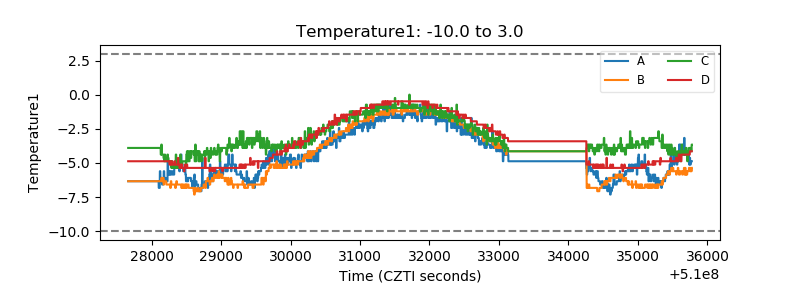 |
| Veto HV Monitor | 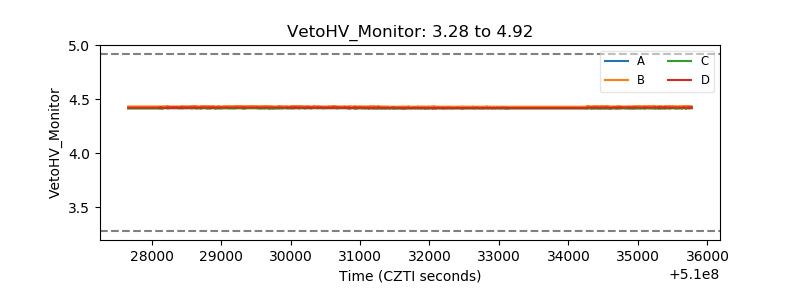 |
| Veto LLD |  |
| Alpha Counter |  |
| _CPM_Rate | 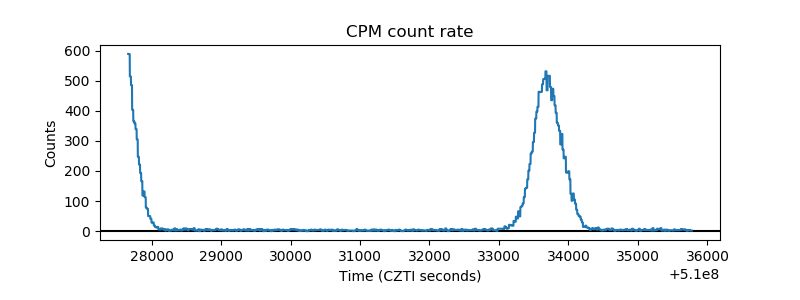 |
| CZT Counter | 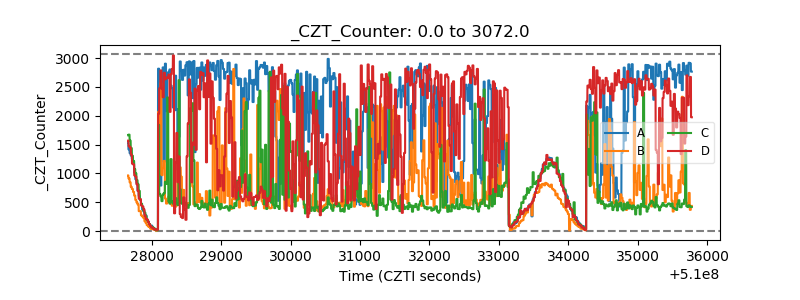 |
| +2.5 Volts monitor | 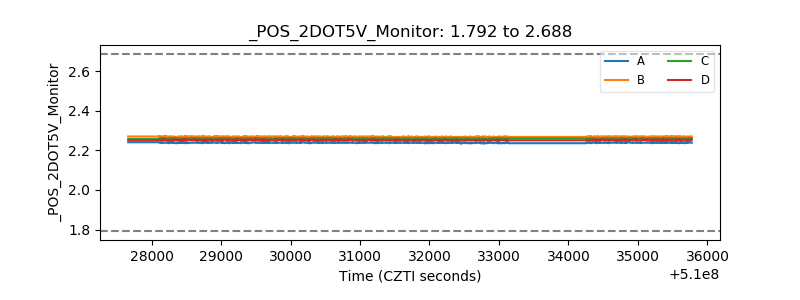 |
| +5 Volts monitor | 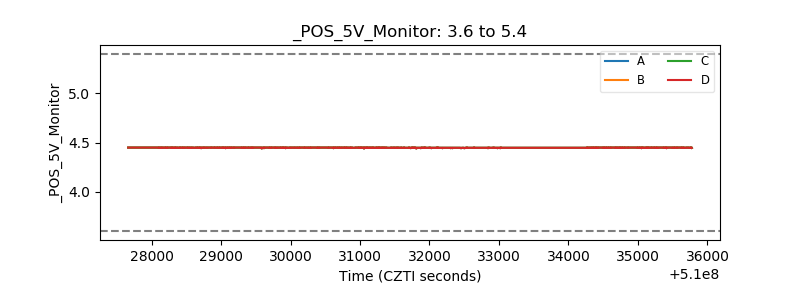 |
| _ROLL_ROT |  |
| _Roll_DEC | 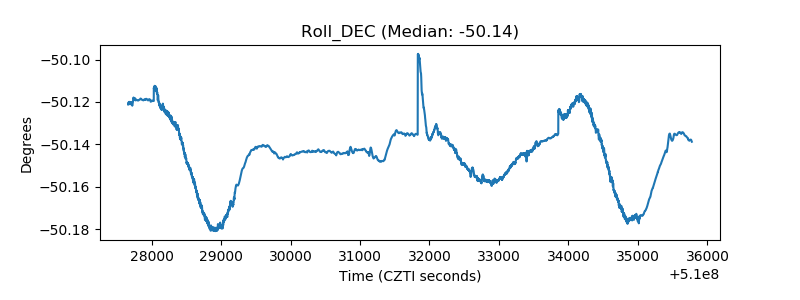 |
| _Roll_RA |  |
| Veto Counter | 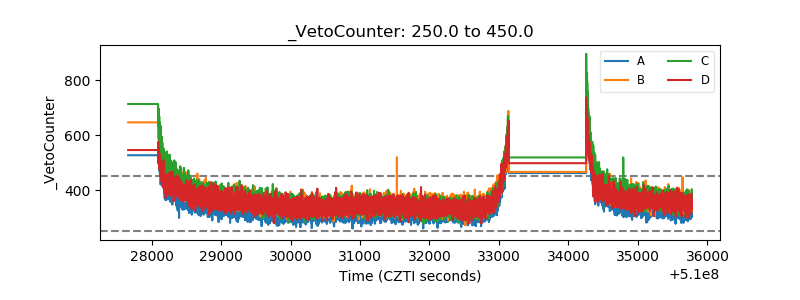 |