| Param | Original file | Final file |
|---|---|---|
| Filename | modeM0/AS1A14_083T05_9000006554_56392cztM0_level2.fits | modeM0/AS1A14_083T05_9000006554_56392cztM0_level2_quad_clean.evt |
| Size (bytes) | 1,054,324,800 | 59,659,200 |
| Size | 1005.5 MB | 56.9 MB |
| Events in quadrant A | 15,661,703 | 116,122 |
| Events in quadrant B | 5,055,119 | 643,829 |
| Events in quadrant C | 3,288,272 | 593,978 |
| Events in quadrant D | 14,522,081 | 1,381 |
| Mode M9 | |||
|---|---|---|---|
| Quadrant | BADHDUFLAG | Total packets | Discarded packets |
| A | 0 | 10 | 0 |
| B | 0 | 10 | 0 |
| C | 0 | 10 | 0 |
| D | 0 | 10 | 0 |
| Mode SS | |||
|---|---|---|---|
| Quadrant | BADHDUFLAG | Total packets | Discarded packets |
| A | 0 | 130 | 0 |
| B | 0 | 130 | 0 |
| C | 0 | 130 | 0 |
| D | 0 | 130 | 0 |
| Mode M0 | |||
|---|---|---|---|
| Quadrant | BADHDUFLAG | Total packets | Discarded packets |
| A | 0 | 50783 | 1 |
| B | 0 | 19418 | 1 |
| C | 0 | 14530 | 2 |
| D | 0 | 47602 | 1 |
| Quadrant | Total seconds | Saturated seconds | Saturation percentage |
|---|---|---|---|
| A | 6467 | 5466 | 84.521416% |
| B | 6467 | 559 | 8.643884% |
| C | 6466 | 154 | 2.381689% |
| D | 6467 | 6456 | 99.829906% |
Noise dominated data is calculated using 1-second bins in cleaned event files. If a bin has >2000 counts, and if more than 50% of those come from <1% of pixels, then it is considered to be noise-dominated and hence unusable.
| Quadrant | # 1 sec bins | Bins with >0 counts | Bins with >2000 counts | High rate bins dominated by noise | Noise dominated (total time) | Noise dominated (detector-on time) | Marked lightcurve |
|---|---|---|---|---|---|---|---|
| A | 7467 | 6468 | 5064 | 5064 | 67.82% | 78.29% |  |
| B | 7467 | 6468 | 238 | 238 | 3.19% | 3.68% |  |
| C | 7466 | 6467 | 37 | 37 | 0.50% | 0.57% |  |
| D | 7466 | 6466 | 4658 | 4658 | 62.39% | 72.04% |  |
Top three noisy pixels from each quadrant. If the there are fewer than three noisy pixels in the level2.evt file, extra rows are filled as -1
| Pixel properties | Quadrant properties | ||||||
|---|---|---|---|---|---|---|---|
| Quadrant | DetID | PixID | Counts | Sigma | Mean | Median | Sigma |
| A | 12 | 3 | 9962034 | 113971.82 | 348 | 338 | 87.4 |
| A | 4 | 95 | 2228538 | 25492.85 | 348 | 338 | 87.4 |
| A | 12 | 194 | 1178113 | 13474.93 | 348 | 338 | 87.4 |
| B | 4 | 206 | 1178624 | 8013.93 | 691 | 667 | 147.0 |
| B | 5 | 172 | 798417 | 5427.28 | 691 | 667 | 147.0 |
| B | 0 | 63 | 73923 | 498.38 | 691 | 667 | 147.0 |
| C | 15 | 230 | 130202 | 685.1 | 698 | 689 | 189.0 |
| C | 12 | 254 | 98981 | 519.95 | 698 | 689 | 189.0 |
| C | 6 | 9 | 98485 | 517.33 | 698 | 689 | 189.0 |
| D | 8 | 129 | 12734520 | 347926.82 | 118 | 112 | 36.6 |
| D | 5 | 32 | 571112 | 15600.74 | 118 | 112 | 36.6 |
| D | 2 | 33 | 378781 | 10345.91 | 118 | 112 | 36.6 |
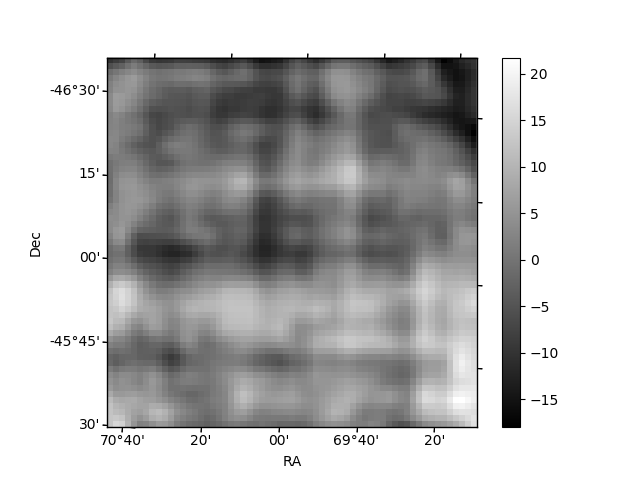
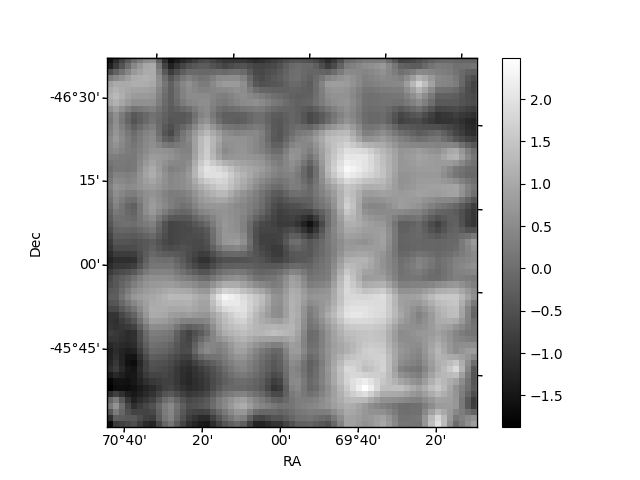
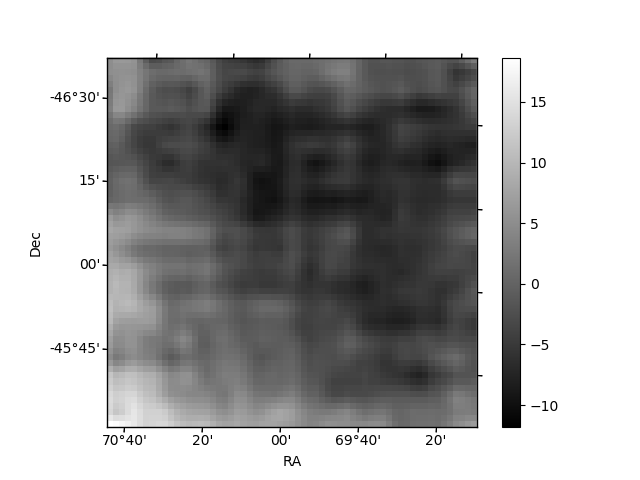
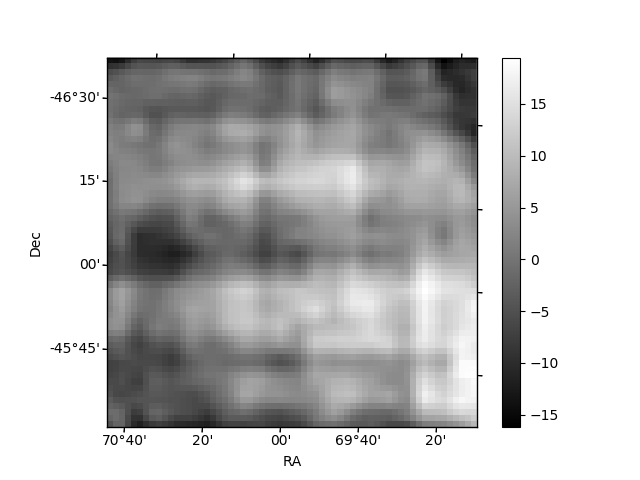
Histogram calculated using DETX and DETY for each event in the final _common_clean file
| Quadrant A | 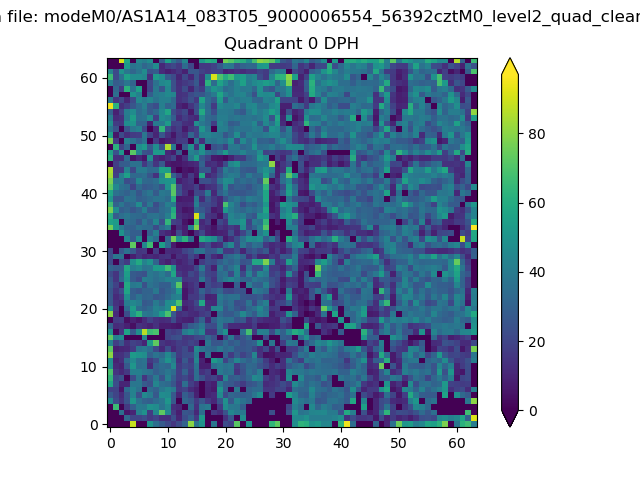 |
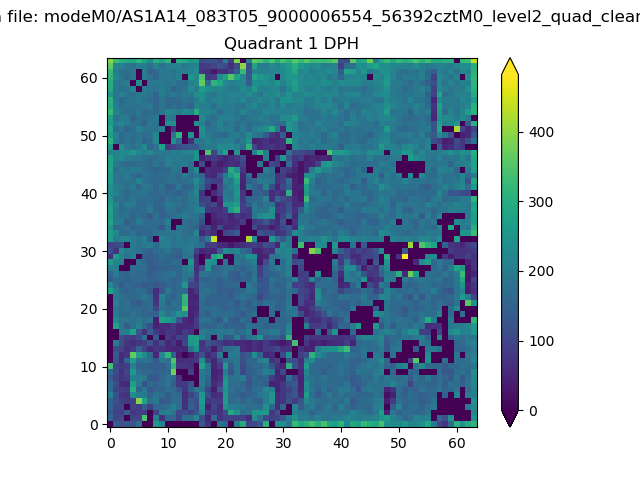 |
Quadrant B |
|---|---|---|---|
| Quadrant D |  |
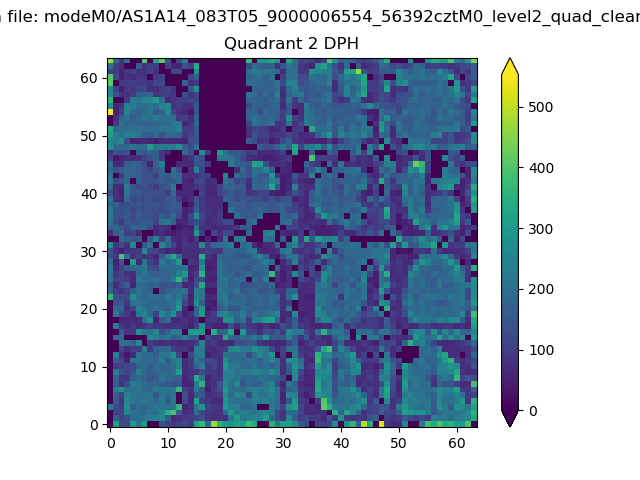 |
Quadrant C |
| Plot type | Count rate plots | Images |
|---|---|---|
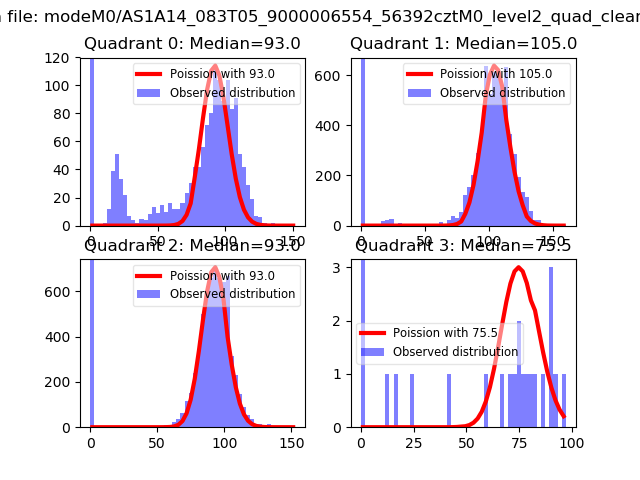
| Comparison with Poisson distribution Blue bars denote a histogram of data divided into 1 sec bins. Red curve is a Poisson curve with rate = median count rate of data. |
 |
 |
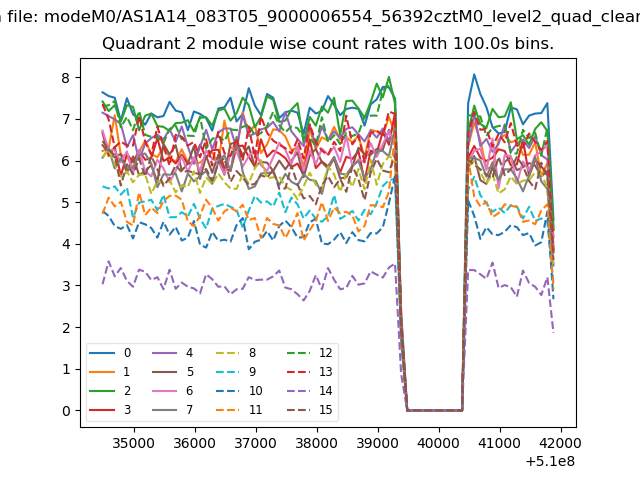
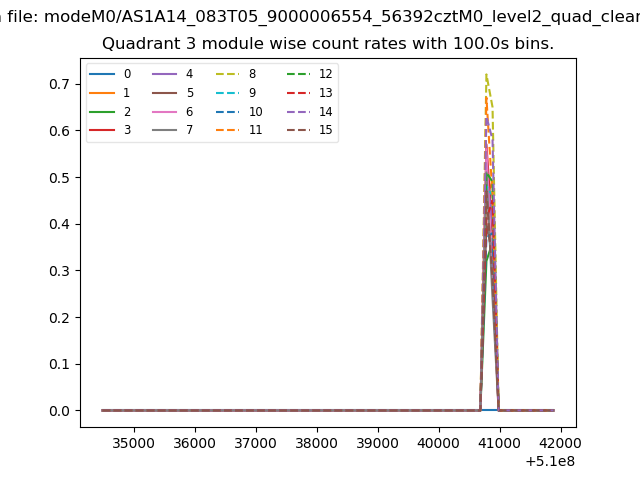
| Quadrant-wise count rates Data is divided into 100 sec bins |
 |
|
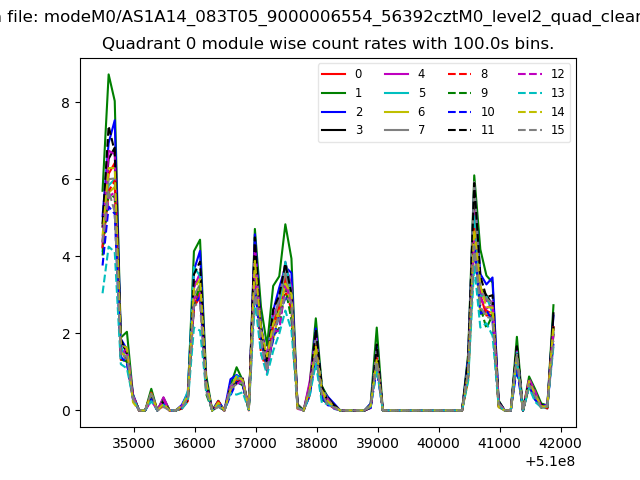
| Module-wise count rates for Quadrant A Data is divided into 100 sec bins |
 |
 |
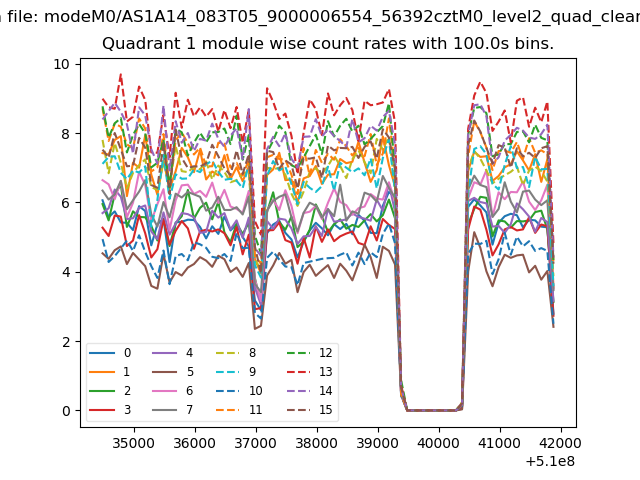
| Module-wise count rates for Quadrant B Data is divided into 100 sec bins |
 |
 |
| Module-wise count rates for Quadrant C Data is divided into 100 sec bins |
 |
 |
| Module-wise count rates for Quadrant D Data is divided into 100 sec bins |
 |
 |
| Parameter | Plot |
|---|---|
| CZT HV Monitor | 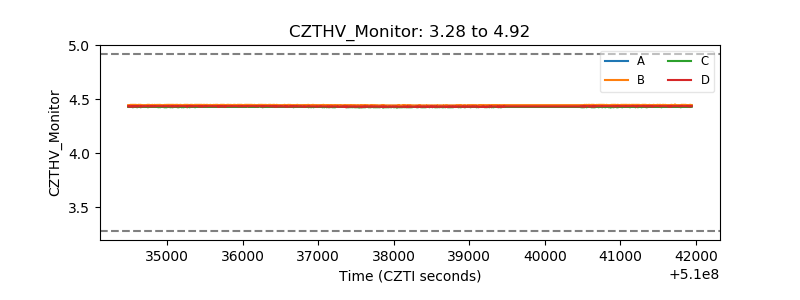 |
| D_VDD |  |
| Temperature 1 | 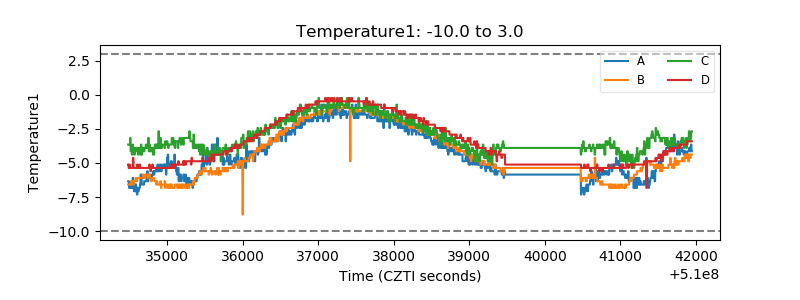 |
| Veto HV Monitor |  |
| Veto LLD |  |
| Alpha Counter | 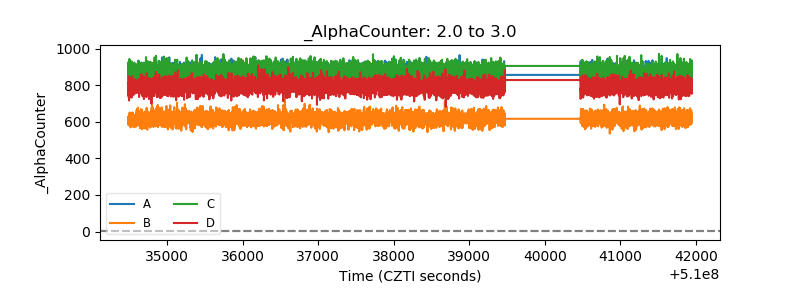 |
| _CPM_Rate | 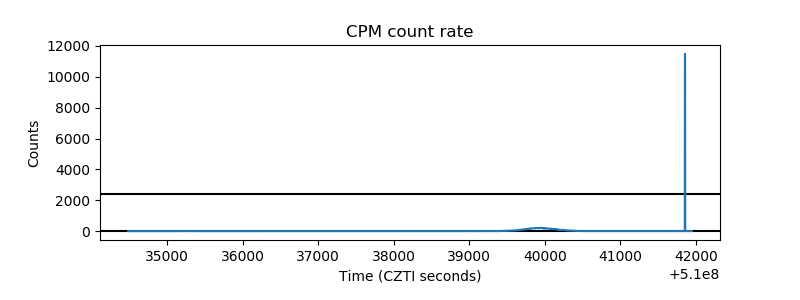 |
| CZT Counter | 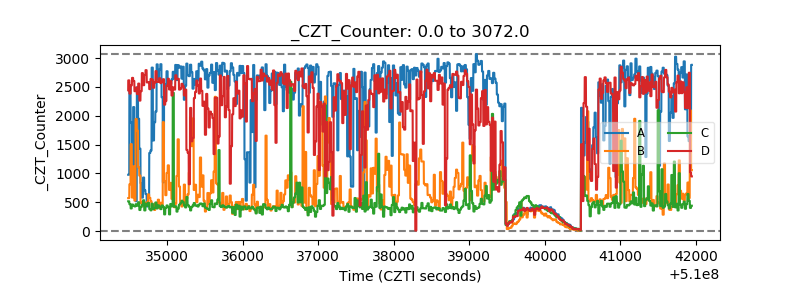 |
| +2.5 Volts monitor |  |
| +5 Volts monitor | 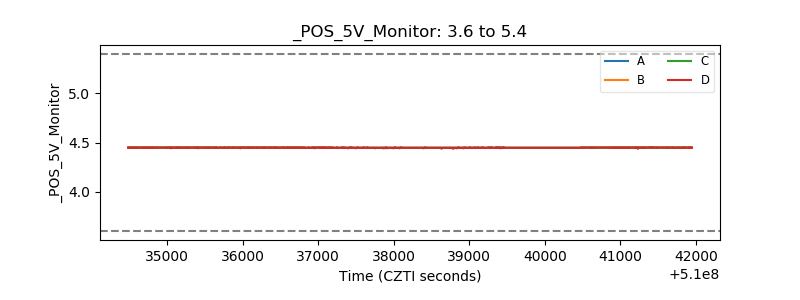 |
| _ROLL_ROT |  |
| _Roll_DEC |  |
| _Roll_RA |  |
| Veto Counter |  |