| Param | Original file | Final file |
|---|---|---|
| Filename | modeM0/AS1A14_083T05_9000006554_56393cztM0_level2.fits | modeM0/AS1A14_083T05_9000006554_56393cztM0_level2_quad_clean.evt |
| Size (bytes) | 1,045,630,080 | 62,504,640 |
| Size | 997.2 MB | 59.6 MB |
| Events in quadrant A | 14,048,958 | 227,006 |
| Events in quadrant B | 6,647,801 | 599,576 |
| Events in quadrant C | 3,944,091 | 597,335 |
| Events in quadrant D | 13,546,849 | 1,378 |
| Mode M9 | |||
|---|---|---|---|
| Quadrant | BADHDUFLAG | Total packets | Discarded packets |
| A | 0 | 7 | 0 |
| B | 0 | 7 | 0 |
| C | 0 | 7 | 0 |
| D | 0 | 7 | 0 |
| Mode SS | |||
|---|---|---|---|
| Quadrant | BADHDUFLAG | Total packets | Discarded packets |
| A | 0 | 138 | 0 |
| B | 0 | 138 | 0 |
| C | 0 | 138 | 0 |
| D | 0 | 138 | 0 |
| Mode M0 | |||
|---|---|---|---|
| Quadrant | BADHDUFLAG | Total packets | Discarded packets |
| A | 0 | 46203 | 1 |
| B | 0 | 24315 | 1 |
| C | 0 | 16534 | 1 |
| D | 0 | 44821 | 3 |
| Quadrant | Total seconds | Saturated seconds | Saturation percentage |
|---|---|---|---|
| A | 6690 | 4515 | 67.488789% |
| B | 6690 | 1102 | 16.472347% |
| C | 6691 | 246 | 3.676580% |
| D | 6690 | 6679 | 99.835575% |
Noise dominated data is calculated using 1-second bins in cleaned event files. If a bin has >2000 counts, and if more than 50% of those come from <1% of pixels, then it is considered to be noise-dominated and hence unusable.
| Quadrant | # 1 sec bins | Bins with >0 counts | Bins with >2000 counts | High rate bins dominated by noise | Noise dominated (total time) | Noise dominated (detector-on time) | Marked lightcurve |
|---|---|---|---|---|---|---|---|
| A | 7475 | 6691 | 4118 | 4118 | 55.09% | 61.55% |  |
| B | 7475 | 6690 | 698 | 698 | 9.34% | 10.43% |  |
| C | 7476 | 6692 | 133 | 133 | 1.78% | 1.99% |  |
| D | 7474 | 6689 | 3994 | 3994 | 53.44% | 59.71% |  |
Top three noisy pixels from each quadrant. If the there are fewer than three noisy pixels in the level2.evt file, extra rows are filled as -1
| Pixel properties | Quadrant properties | ||||||
|---|---|---|---|---|---|---|---|
| Quadrant | DetID | PixID | Counts | Sigma | Mean | Median | Sigma |
| A | 12 | 3 | 7662609 | 68548.21 | 445 | 433 | 111.8 |
| A | 4 | 95 | 2288722 | 20471.75 | 445 | 433 | 111.8 |
| A | 12 | 194 | 932783 | 8341.09 | 445 | 433 | 111.8 |
| B | 4 | 206 | 1609004 | 11006.51 | 684 | 660 | 146.1 |
| B | 5 | 172 | 1599851 | 10943.88 | 684 | 660 | 146.1 |
| B | 5 | 185 | 298669 | 2039.39 | 684 | 660 | 146.1 |
| C | 13 | 3 | 602139 | 3173.93 | 699 | 694 | 189.5 |
| C | 12 | 254 | 216508 | 1138.89 | 699 | 694 | 189.5 |
| C | 15 | 230 | 190371 | 1000.96 | 699 | 694 | 189.5 |
| D | 8 | 129 | 12471345 | 450874.83 | 90 | 85 | 27.7 |
| D | 2 | 33 | 455020 | 16447.32 | 90 | 85 | 27.7 |
| D | 8 | 113 | 121689 | 4396.36 | 90 | 85 | 27.7 |
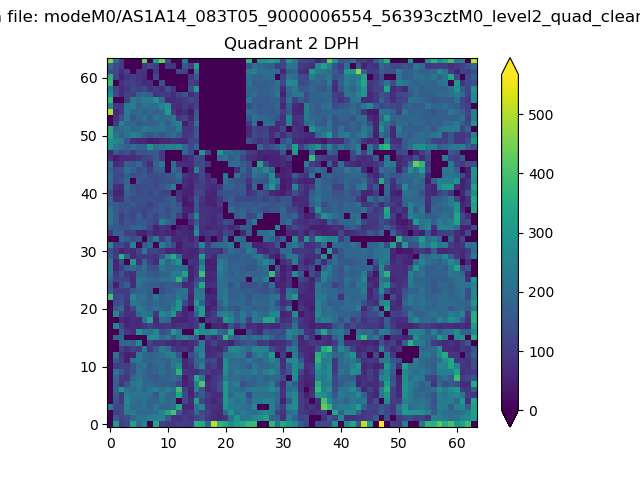
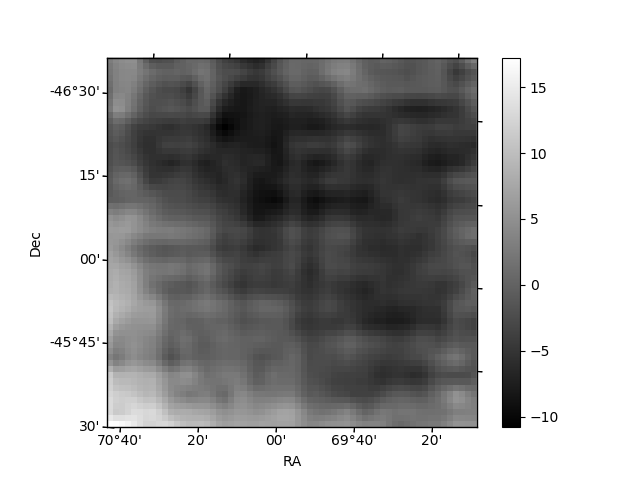
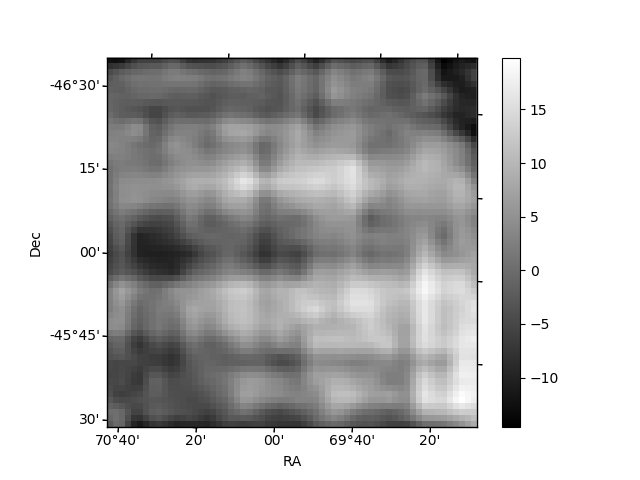
Histogram calculated using DETX and DETY for each event in the final _common_clean file
| Quadrant A | 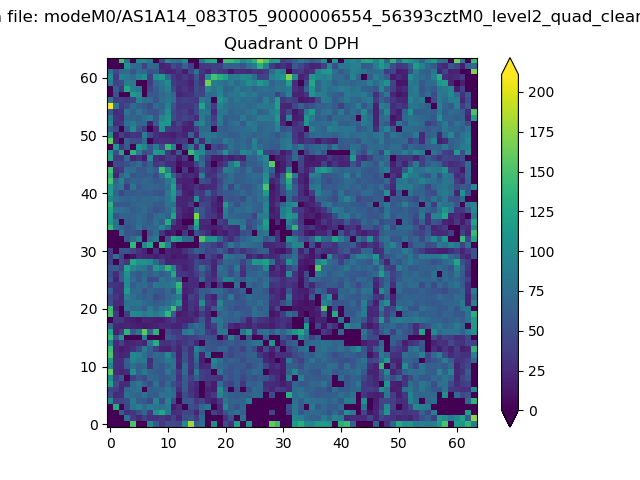 |
 |
Quadrant B |
|---|---|---|---|
| Quadrant D |  |
 |
Quadrant C |
| Plot type | Count rate plots | Images |
|---|---|---|
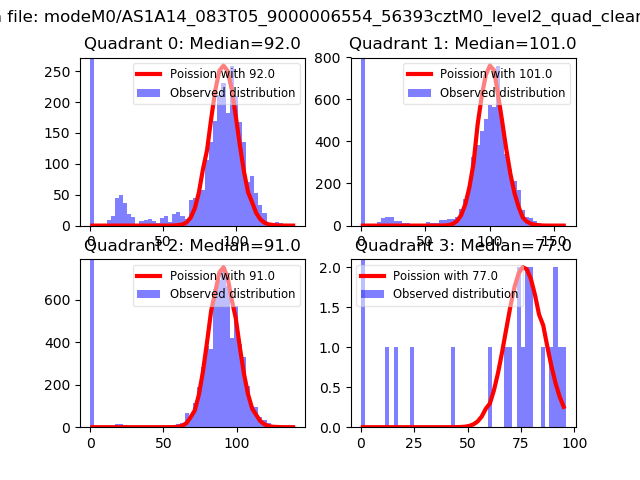
| Comparison with Poisson distribution Blue bars denote a histogram of data divided into 1 sec bins. Red curve is a Poisson curve with rate = median count rate of data. |
 |
 |
| Quadrant-wise count rates Data is divided into 100 sec bins |
 |
|
| Module-wise count rates for Quadrant A Data is divided into 100 sec bins |
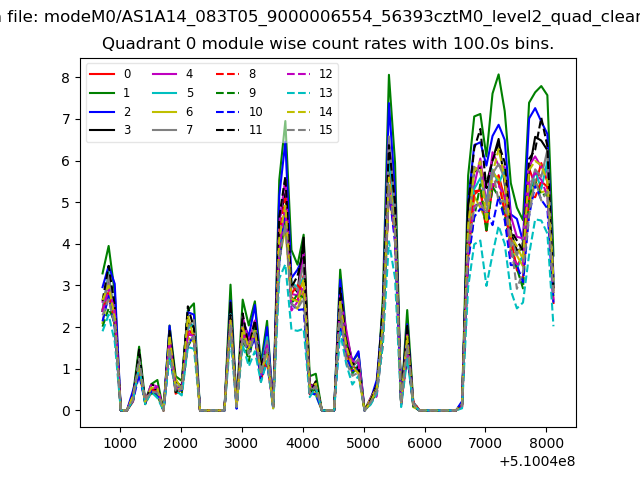 |
 |
| Module-wise count rates for Quadrant B Data is divided into 100 sec bins |
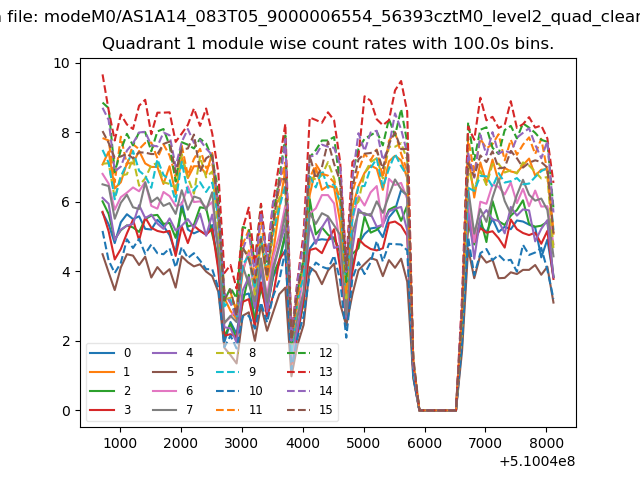 |
 |
| Module-wise count rates for Quadrant C Data is divided into 100 sec bins |
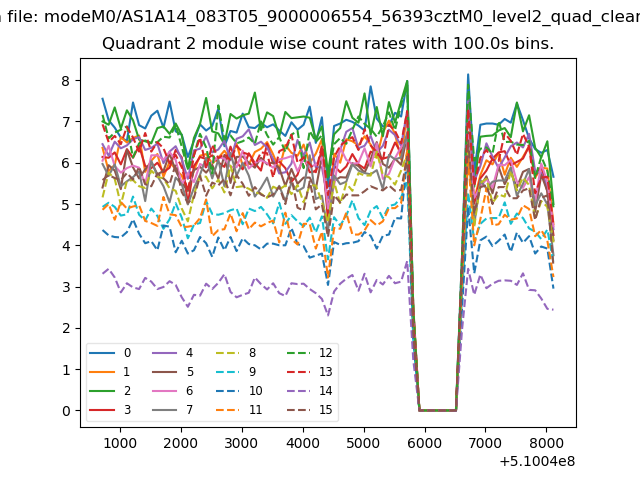 |
 |
| Module-wise count rates for Quadrant D Data is divided into 100 sec bins |
 |
 |
| Parameter | Plot |
|---|---|
| CZT HV Monitor | 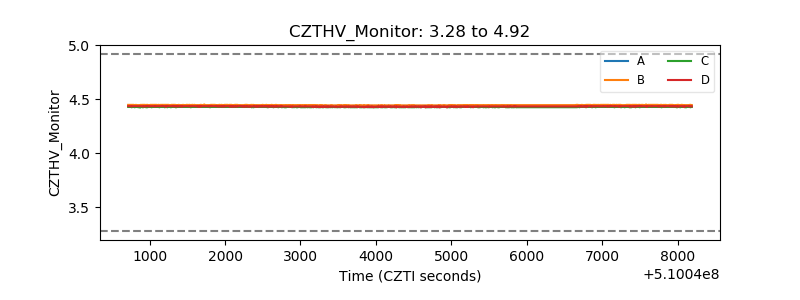 |
| D_VDD | 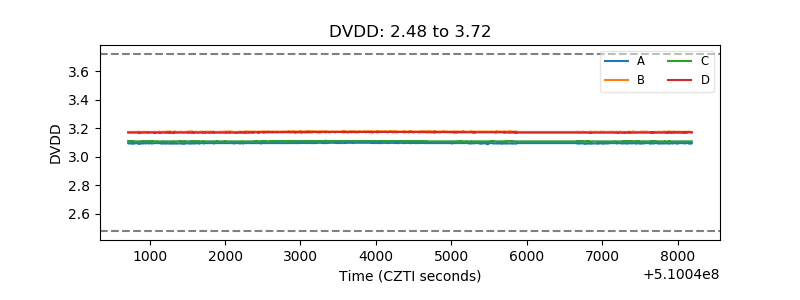 |
| Temperature 1 | 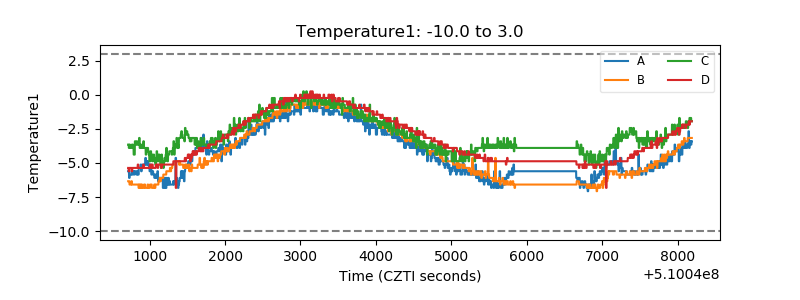 |
| Veto HV Monitor |  |
| Veto LLD |  |
| Alpha Counter | 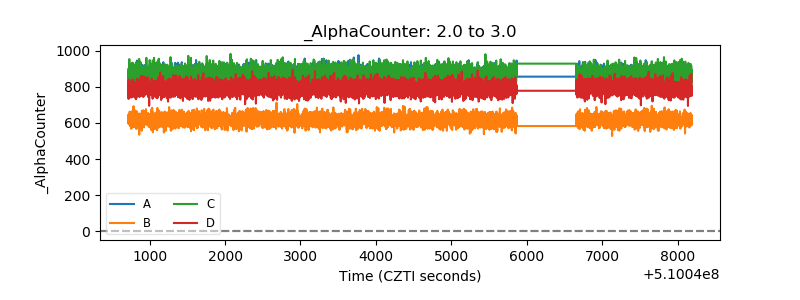 |
| _CPM_Rate | 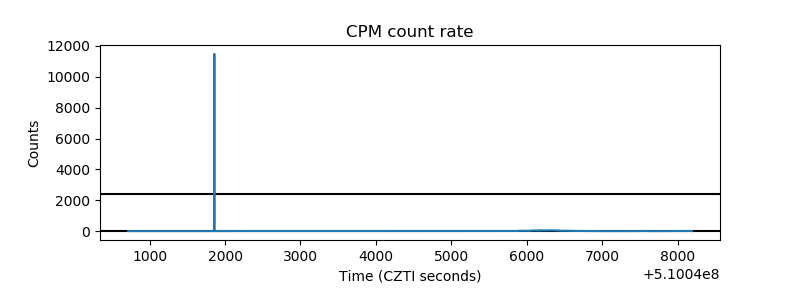 |
| CZT Counter | 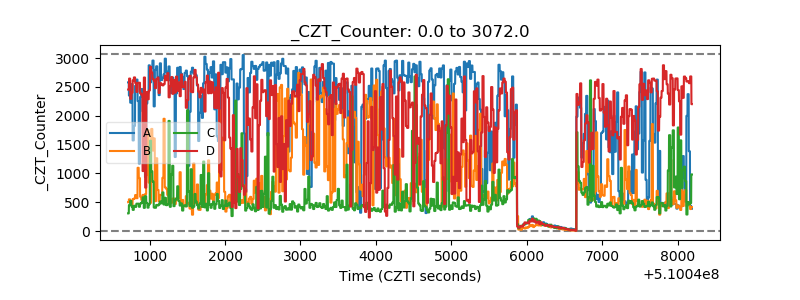 |
| +2.5 Volts monitor | 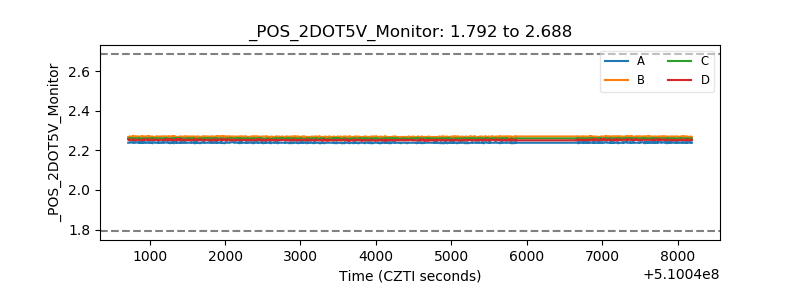 |
| +5 Volts monitor | 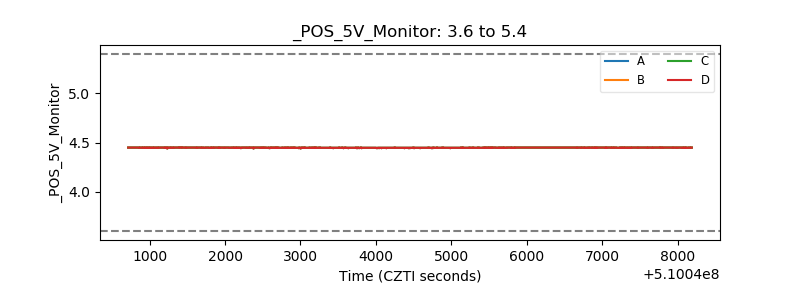 |
| _ROLL_ROT |  |
| _Roll_DEC | 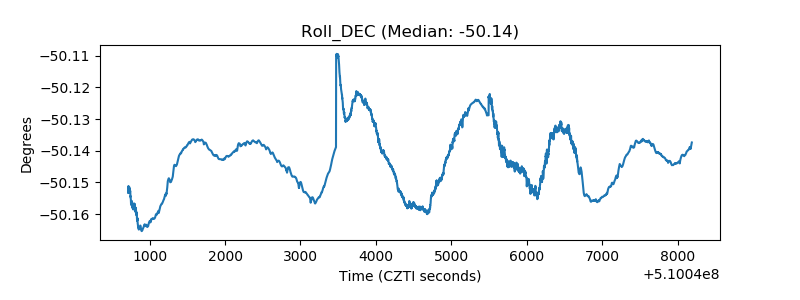 |
| _Roll_RA |  |
| Veto Counter | 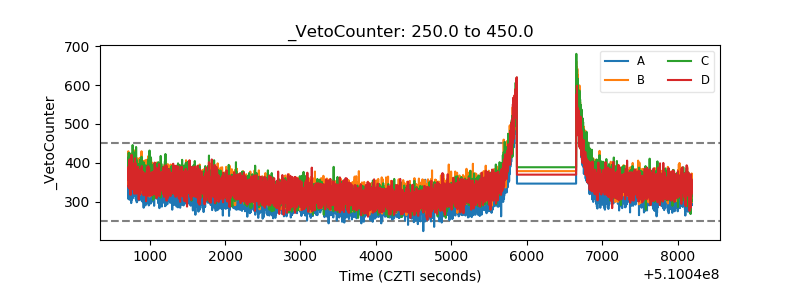 |