| Param | Original file | Final file |
|---|---|---|
| Filename | modeM0/AS1A14_083T05_9000006554_56394cztM0_level2.fits | modeM0/AS1A14_083T05_9000006554_56394cztM0_level2_quad_clean.evt |
| Size (bytes) | 1,043,490,240 | 87,160,320 |
| Size | 995.1 MB | 83.1 MB |
| Events in quadrant A | 10,914,409 | 600,077 |
| Events in quadrant B | 6,031,941 | 763,098 |
| Events in quadrant C | 5,080,775 | 674,945 |
| Events in quadrant D | 16,003,465 | 61,277 |
| Mode SS | |||
|---|---|---|---|
| Quadrant | BADHDUFLAG | Total packets | Discarded packets |
| A | 0 | 154 | 0 |
| B | 0 | 154 | 0 |
| C | 0 | 154 | 0 |
| D | 0 | 154 | 0 |
| Mode M0 | |||
|---|---|---|---|
| Quadrant | BADHDUFLAG | Total packets | Discarded packets |
| A | 0 | 37782 | 0 |
| B | 0 | 23197 | 0 |
| C | 0 | 20645 | 0 |
| D | 0 | 52862 | 0 |
| Quadrant | Total seconds | Saturated seconds | Saturation percentage |
|---|---|---|---|
| A | 7676 | 2877 | 37.480459% |
| B | 7676 | 980 | 12.767066% |
| C | 7677 | 716 | 9.326560% |
| D | 7676 | 7676 | 100.000000% |
Noise dominated data is calculated using 1-second bins in cleaned event files. If a bin has >2000 counts, and if more than 50% of those come from <1% of pixels, then it is considered to be noise-dominated and hence unusable.
| Quadrant | # 1 sec bins | Bins with >0 counts | Bins with >2000 counts | High rate bins dominated by noise | Noise dominated (total time) | Noise dominated (detector-on time) | Marked lightcurve |
|---|---|---|---|---|---|---|---|
| A | 7736 | 7678 | 2115 | 2115 | 27.34% | 27.55% |  |
| B | 7736 | 7677 | 359 | 359 | 4.64% | 4.68% | 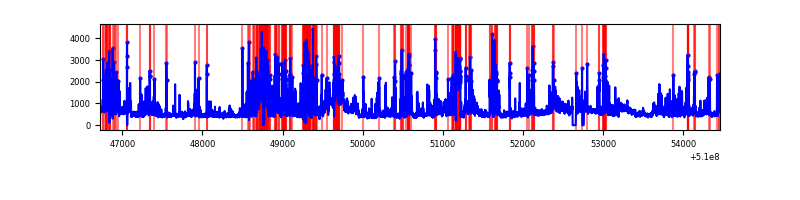 |
| C | 7737 | 7679 | 395 | 395 | 5.11% | 5.14% |  |
| D | 7735 | 7675 | 4921 | 4921 | 63.62% | 64.12% |  |
Top three noisy pixels from each quadrant. If the there are fewer than three noisy pixels in the level2.evt file, extra rows are filled as -1
| Pixel properties | Quadrant properties | ||||||
|---|---|---|---|---|---|---|---|
| Quadrant | DetID | PixID | Counts | Sigma | Mean | Median | Sigma |
| A | 3 | 79 | 3398139 | 19599.4 | 703 | 687 | 173.3 |
| A | 12 | 3 | 2516252 | 14511.92 | 703 | 687 | 173.3 |
| A | 4 | 95 | 1243061 | 7167.07 | 703 | 687 | 173.3 |
| B | 4 | 206 | 1291755 | 7379.89 | 818 | 786 | 174.9 |
| B | 5 | 172 | 583722 | 3332.38 | 818 | 786 | 174.9 |
| B | 8 | 128 | 241628 | 1376.78 | 818 | 786 | 174.9 |
| C | 13 | 3 | 1501388 | 6878.02 | 809 | 799 | 218.2 |
| C | 15 | 230 | 144689 | 659.53 | 809 | 799 | 218.2 |
| C | 12 | 252 | 108461 | 493.47 | 809 | 799 | 218.2 |
| D | 8 | 129 | 15483884 | 547453.8 | 94 | 90 | 28.3 |
| D | 8 | 113 | 33866 | 1194.2 | 94 | 90 | 28.3 |
| D | 2 | 33 | 23098 | 813.48 | 94 | 90 | 28.3 |
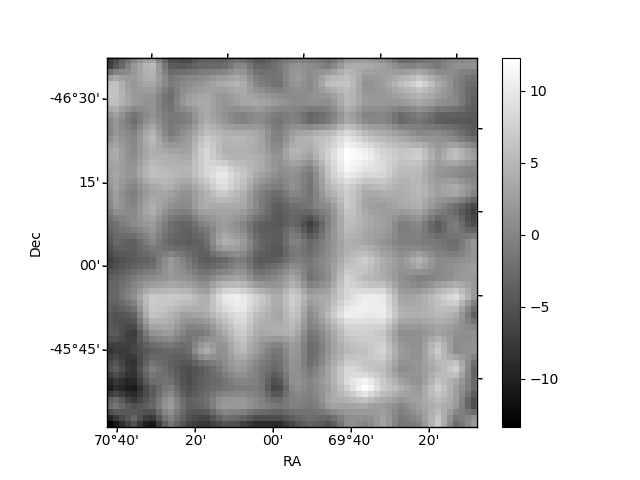
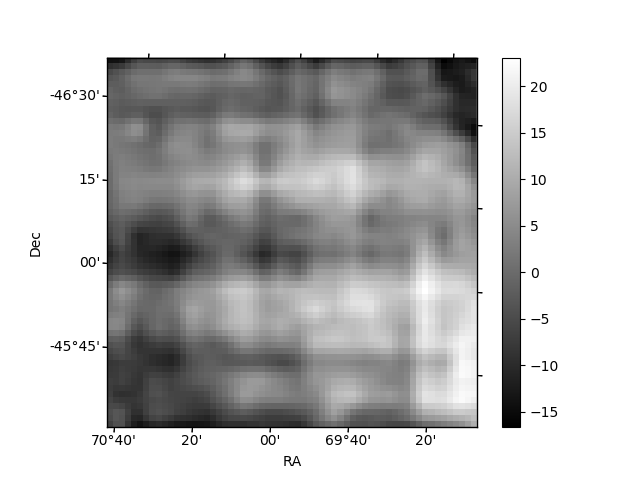
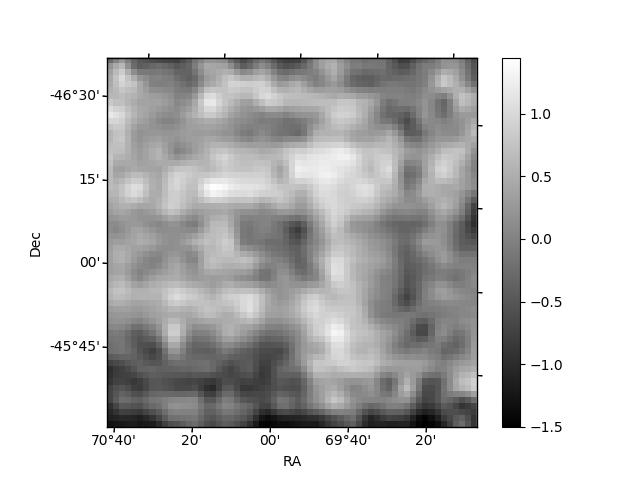
Histogram calculated using DETX and DETY for each event in the final _common_clean file
| Quadrant A | 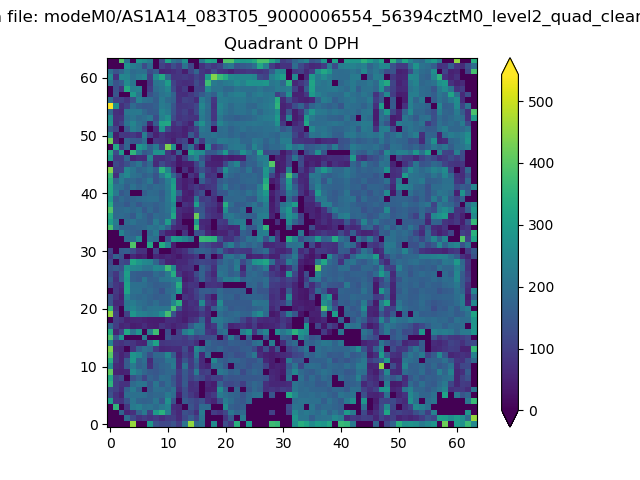 |
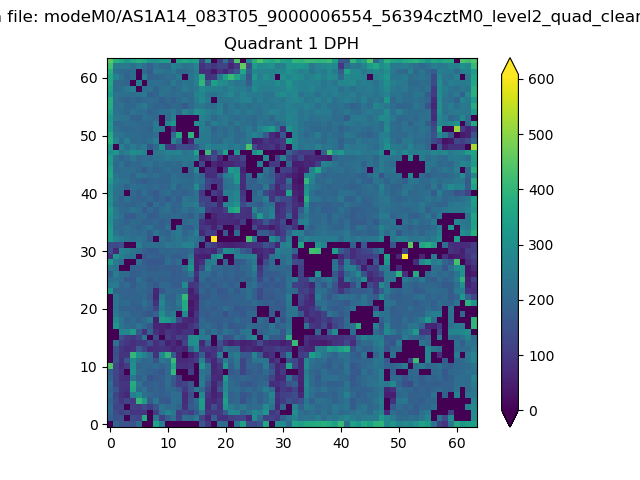 |
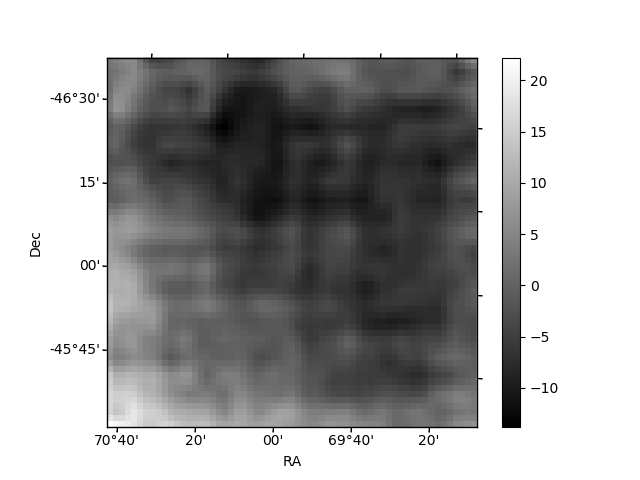
Quadrant B |
|---|---|---|---|
| Quadrant D | 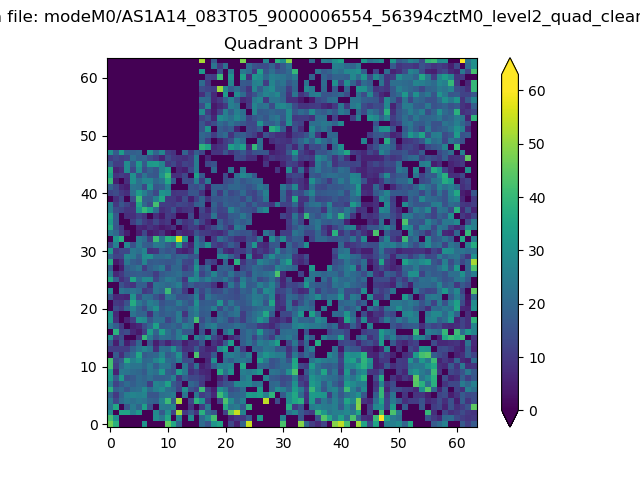 |
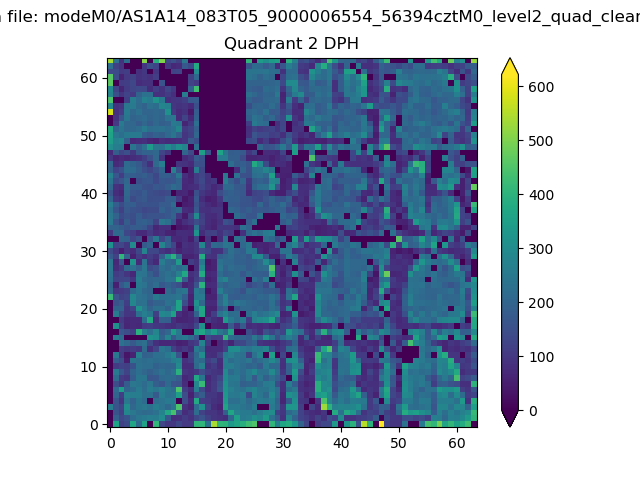 |
Quadrant C |
| Plot type | Count rate plots | Images |
|---|---|---|
| Comparison with Poisson distribution Blue bars denote a histogram of data divided into 1 sec bins. Red curve is a Poisson curve with rate = median count rate of data. |
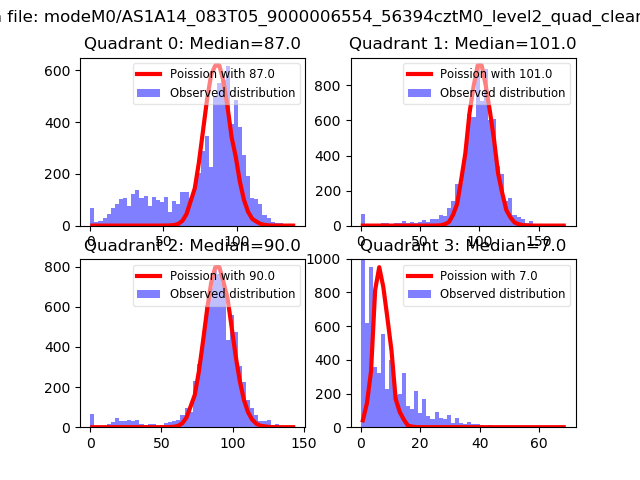 |
 |
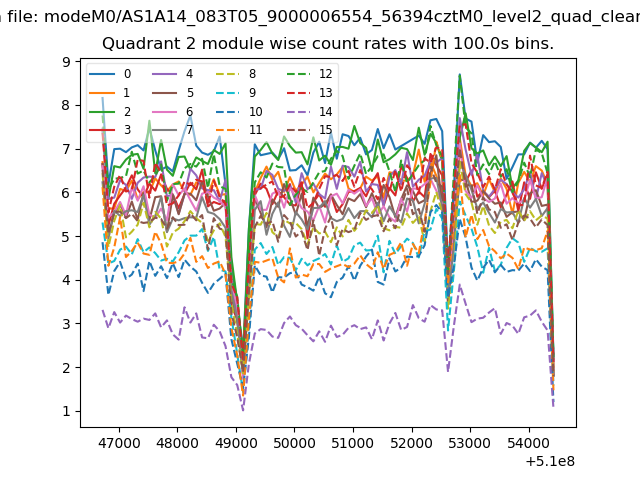
| Quadrant-wise count rates Data is divided into 100 sec bins |
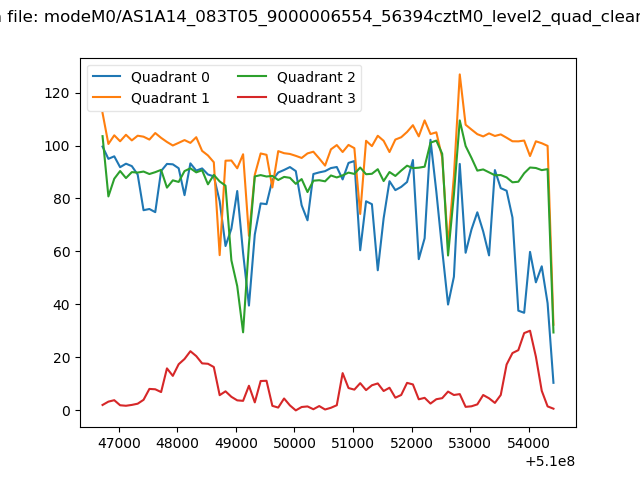 |
|
| Module-wise count rates for Quadrant A Data is divided into 100 sec bins |
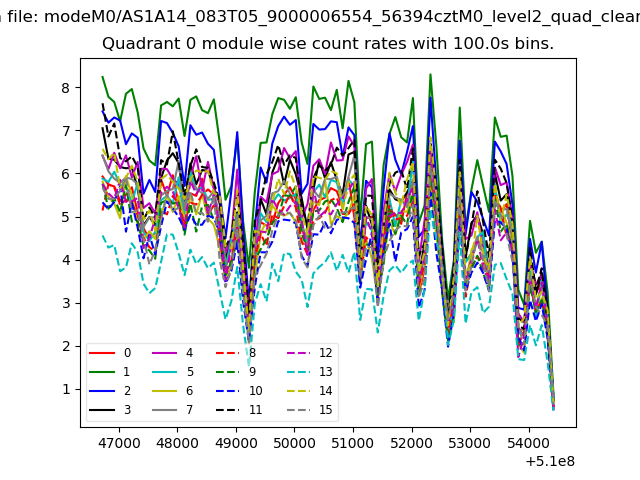 |
 |
| Module-wise count rates for Quadrant B Data is divided into 100 sec bins |
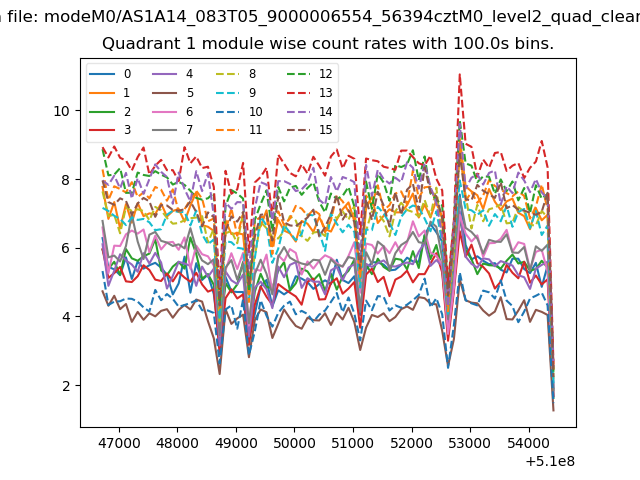 |
 |
| Module-wise count rates for Quadrant C Data is divided into 100 sec bins |
 |
 |
| Module-wise count rates for Quadrant D Data is divided into 100 sec bins |
 |
 |
| Parameter | Plot |
|---|---|
| CZT HV Monitor | 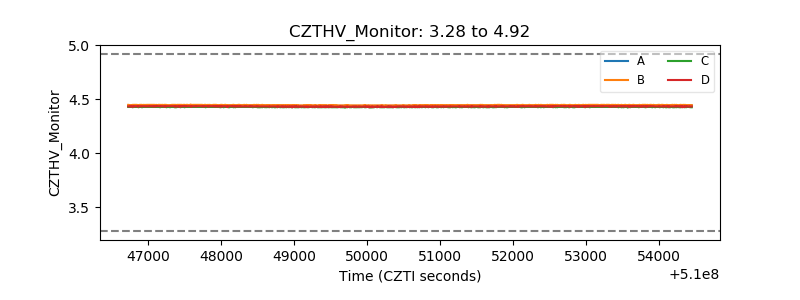 |
| D_VDD |  |
| Temperature 1 | 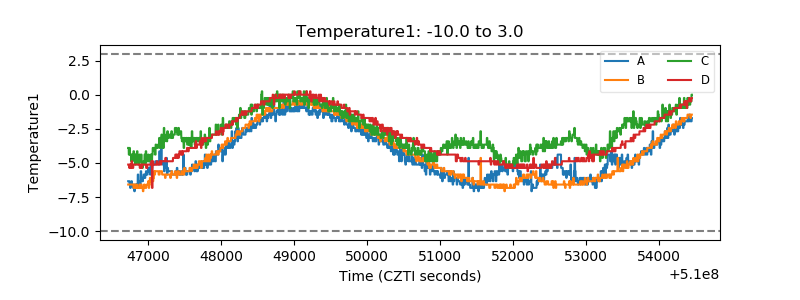 |
| Veto HV Monitor |  |
| Veto LLD |  |
| Alpha Counter | 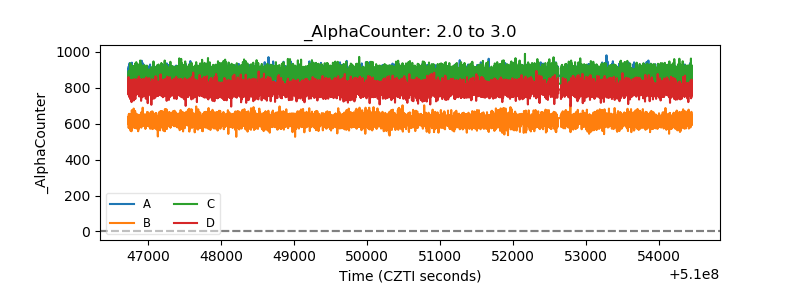 |
| _CPM_Rate | 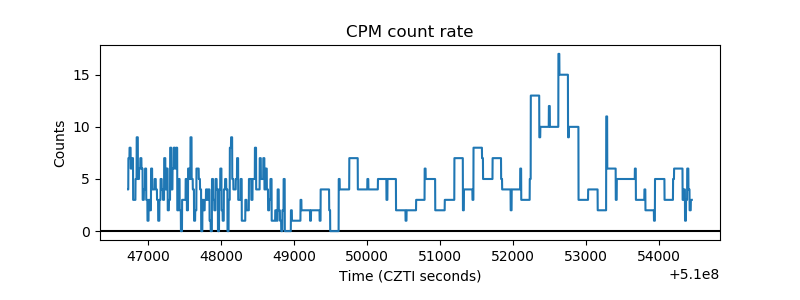 |
| CZT Counter | 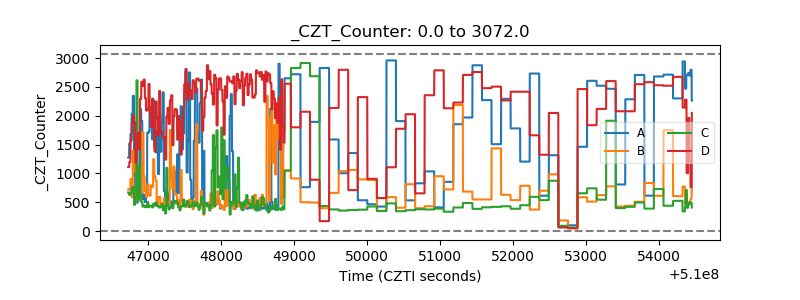 |
| +2.5 Volts monitor | 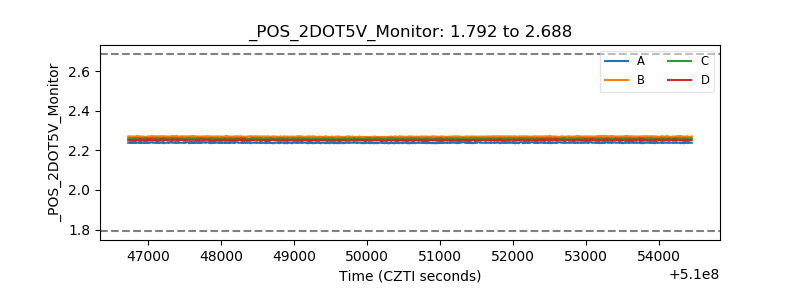 |
| +5 Volts monitor | 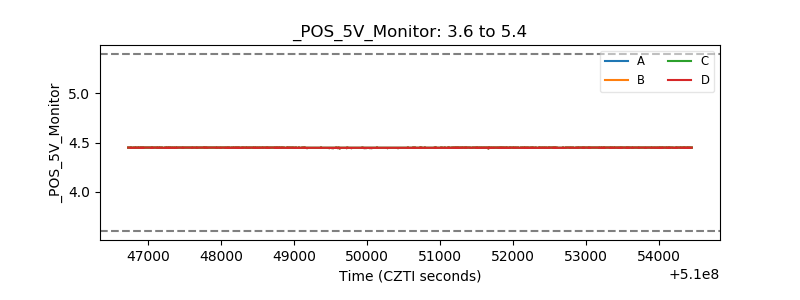 |
| _ROLL_ROT |  |
| _Roll_DEC |  |
| _Roll_RA |  |
| Veto Counter |  |