| Param | Original file | Final file |
|---|---|---|
| Filename | modeM0/AS1A14_083T05_9000006554_56395cztM0_level2.fits | modeM0/AS1A14_083T05_9000006554_56395cztM0_level2_quad_clean.evt |
| Size (bytes) | 1,062,325,440 | 83,960,640 |
| Size | 1013.1 MB | 80.1 MB |
| Events in quadrant A | 12,539,512 | 525,373 |
| Events in quadrant B | 6,607,102 | 744,984 |
| Events in quadrant C | 4,786,402 | 671,642 |
| Events in quadrant D | 14,797,511 | 62,236 |
| Mode SS | |||
|---|---|---|---|
| Quadrant | BADHDUFLAG | Total packets | Discarded packets |
| A | 0 | 154 | 0 |
| B | 0 | 154 | 0 |
| C | 0 | 154 | 0 |
| D | 0 | 154 | 0 |
| Mode M0 | |||
|---|---|---|---|
| Quadrant | BADHDUFLAG | Total packets | Discarded packets |
| A | 0 | 42602 | 0 |
| B | 0 | 24835 | 0 |
| C | 0 | 19708 | 0 |
| D | 0 | 49225 | 0 |
| Quadrant | Total seconds | Saturated seconds | Saturation percentage |
|---|---|---|---|
| A | 7645 | 3504 | 45.833878% |
| B | 7645 | 882 | 11.536952% |
| C | 7645 | 475 | 6.213211% |
| D | 7645 | 7645 | 100.000000% |
Noise dominated data is calculated using 1-second bins in cleaned event files. If a bin has >2000 counts, and if more than 50% of those come from <1% of pixels, then it is considered to be noise-dominated and hence unusable.
| Quadrant | # 1 sec bins | Bins with >0 counts | Bins with >2000 counts | High rate bins dominated by noise | Noise dominated (total time) | Noise dominated (detector-on time) | Marked lightcurve |
|---|---|---|---|---|---|---|---|
| A | 7645 | 7645 | 3026 | 3026 | 39.58% | 39.58% |  |
| B | 7645 | 7644 | 496 | 496 | 6.49% | 6.49% |  |
| C | 7645 | 7644 | 284 | 284 | 3.71% | 3.72% |  |
| D | 7644 | 7644 | 4287 | 4287 | 56.08% | 56.08% |  |
Top three noisy pixels from each quadrant. If the there are fewer than three noisy pixels in the level2.evt file, extra rows are filled as -1
| Pixel properties | Quadrant properties | ||||||
|---|---|---|---|---|---|---|---|
| Quadrant | DetID | PixID | Counts | Sigma | Mean | Median | Sigma |
| A | 12 | 3 | 5415050 | 35649.88 | 610 | 594 | 151.9 |
| A | 3 | 79 | 2376028 | 15640.34 | 610 | 594 | 151.9 |
| A | 0 | 8 | 951889 | 6263.52 | 610 | 594 | 151.9 |
| B | 4 | 206 | 1670373 | 9918.59 | 783 | 755 | 168.3 |
| B | 5 | 172 | 446211 | 2646.29 | 783 | 755 | 168.3 |
| B | 5 | 185 | 432494 | 2564.8 | 783 | 755 | 168.3 |
| C | 13 | 3 | 1375321 | 6409.36 | 781 | 771 | 214.5 |
| C | 12 | 252 | 97298 | 450.09 | 781 | 771 | 214.5 |
| C | 12 | 249 | 62323 | 287.01 | 781 | 771 | 214.5 |
| D | 8 | 129 | 13914295 | 488678.93 | 94 | 90 | 28.5 |
| D | 13 | 153 | 167722 | 5887.38 | 94 | 90 | 28.5 |
| D | 2 | 120 | 117689 | 4130.18 | 94 | 90 | 28.5 |
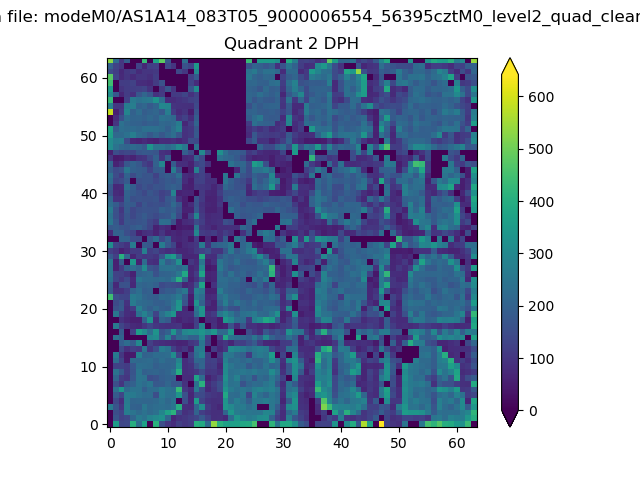
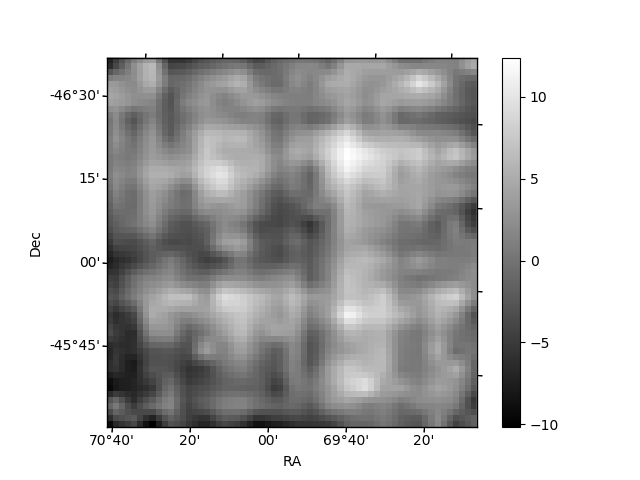
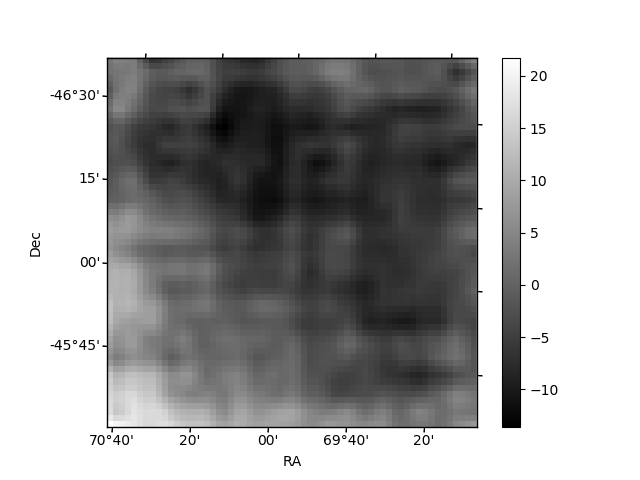
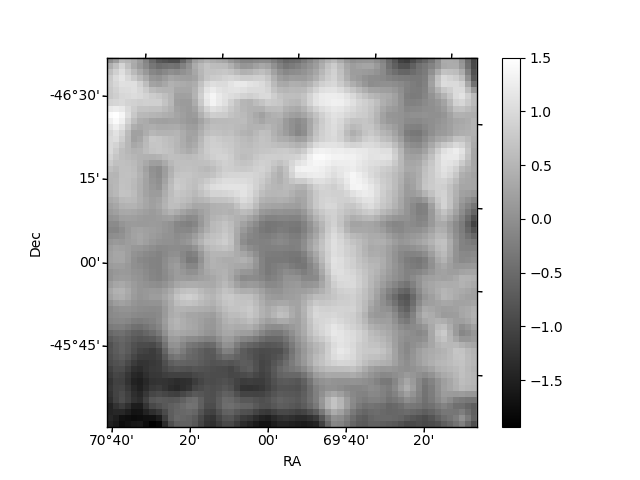
Histogram calculated using DETX and DETY for each event in the final _common_clean file
| Quadrant A | 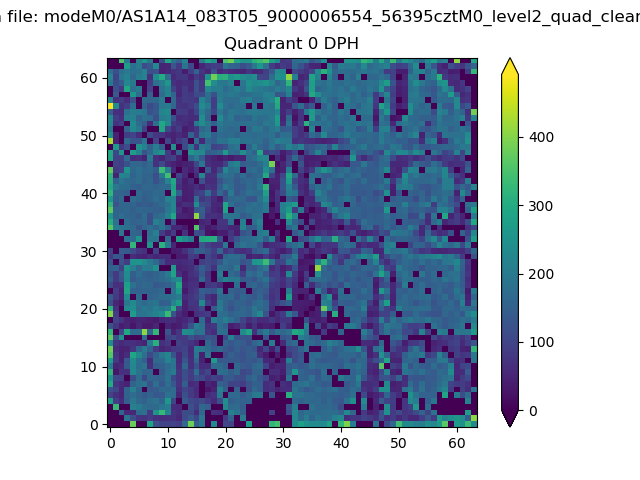 |
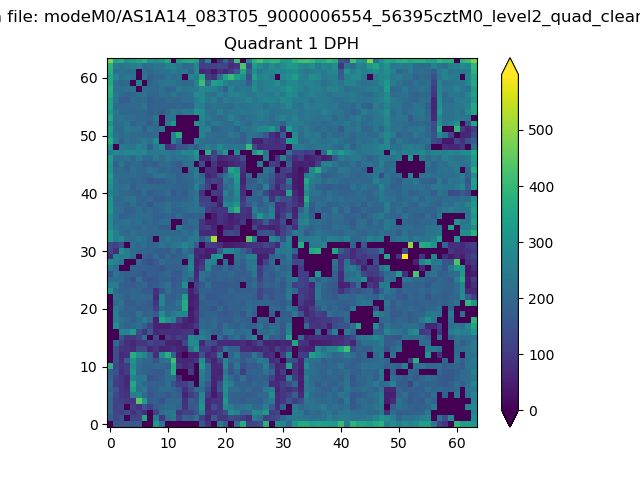 |
Quadrant B |
|---|---|---|---|
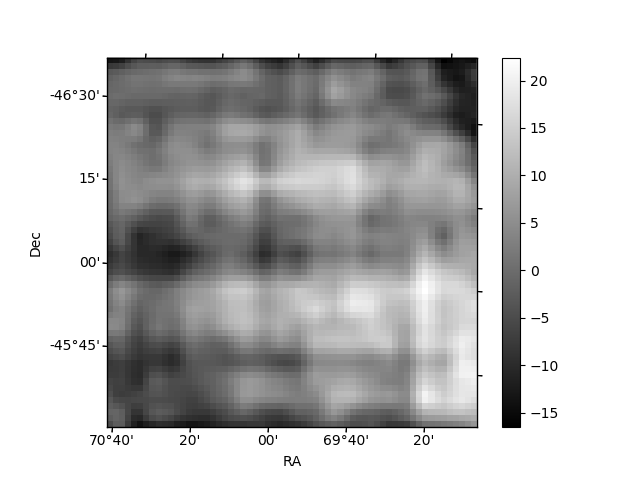
| Quadrant D | 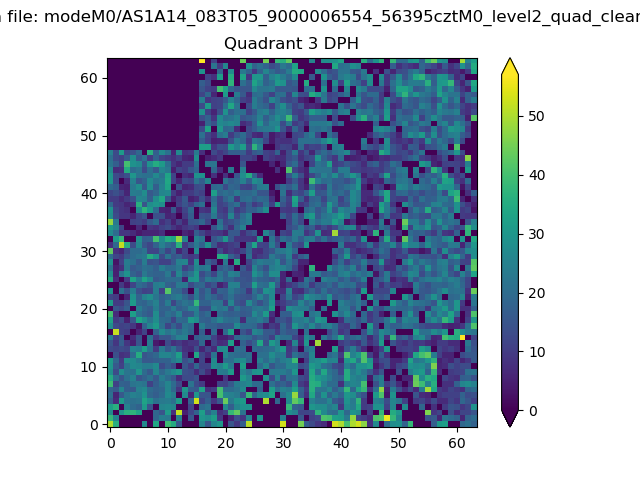 |
 |
Quadrant C |
| Plot type | Count rate plots | Images |
|---|---|---|
| Comparison with Poisson distribution Blue bars denote a histogram of data divided into 1 sec bins. Red curve is a Poisson curve with rate = median count rate of data. |
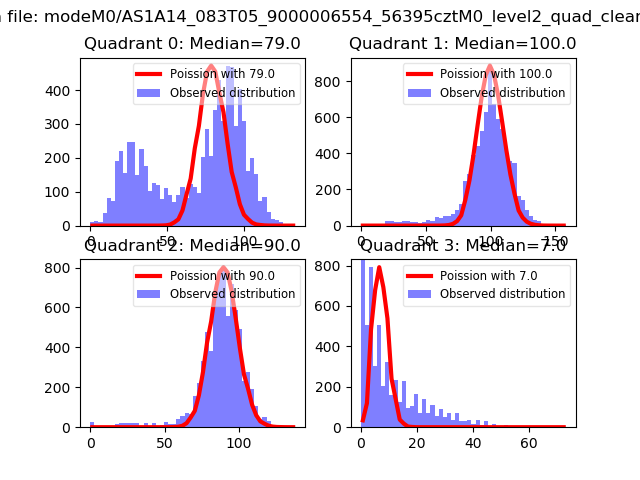 |
 |
| Quadrant-wise count rates Data is divided into 100 sec bins |
 |
|
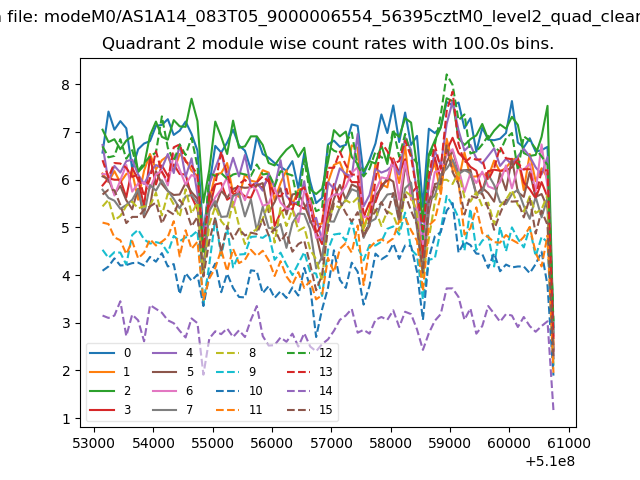
| Module-wise count rates for Quadrant A Data is divided into 100 sec bins |
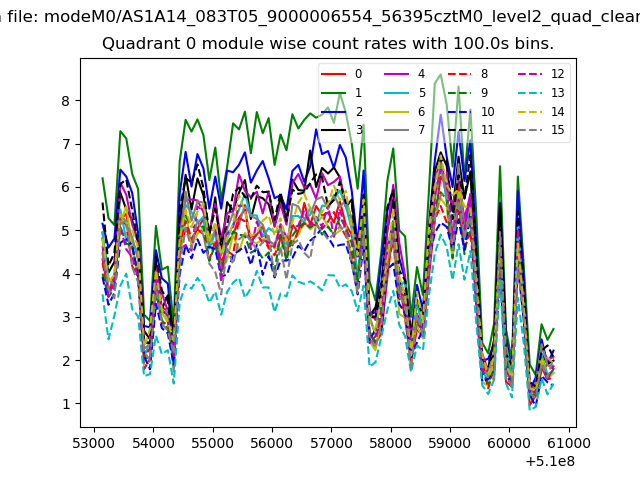 |
 |
| Module-wise count rates for Quadrant B Data is divided into 100 sec bins |
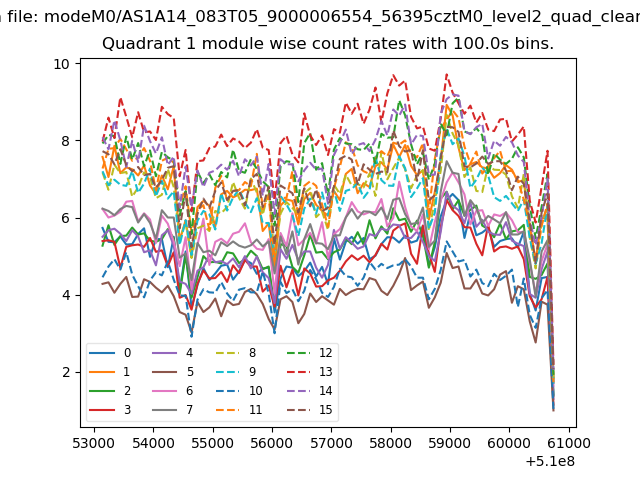 |
 |
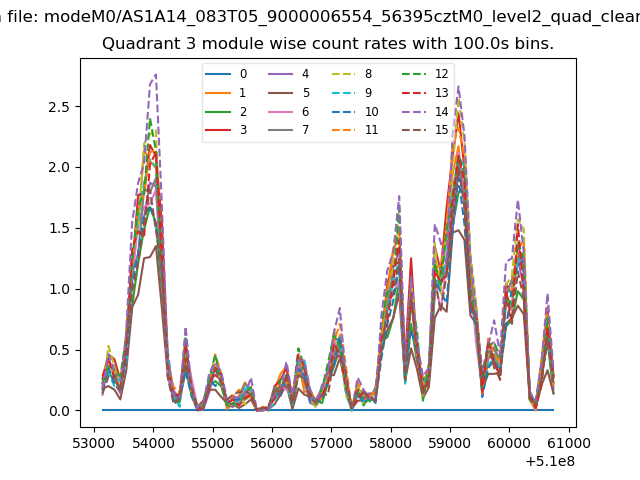
| Module-wise count rates for Quadrant C Data is divided into 100 sec bins |
 |
 |
| Module-wise count rates for Quadrant D Data is divided into 100 sec bins |
 |
 |
| Parameter | Plot |
|---|---|
| CZT HV Monitor | 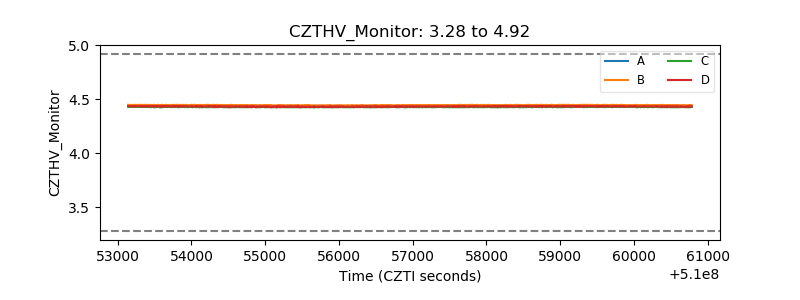 |
| D_VDD |  |
| Temperature 1 | 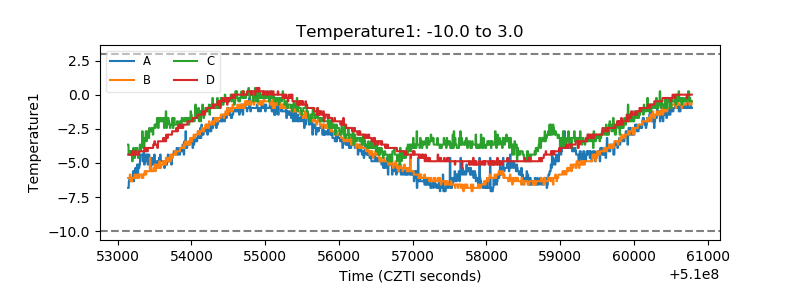 |
| Veto HV Monitor |  |
| Veto LLD |  |
| Alpha Counter | 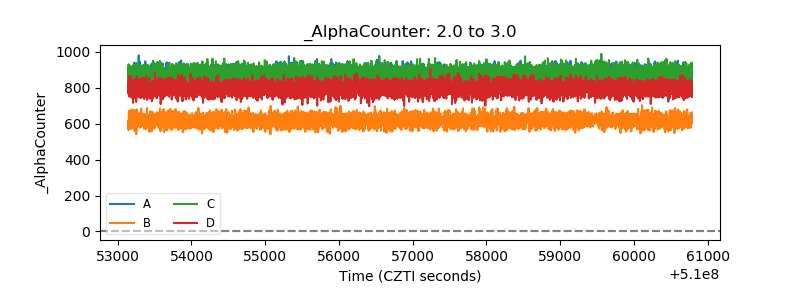 |
| _CPM_Rate | 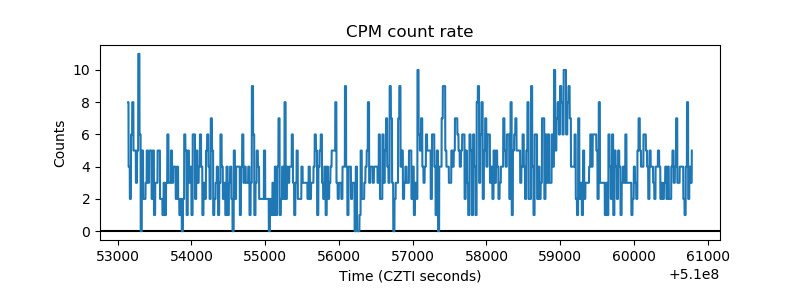 |
| CZT Counter | 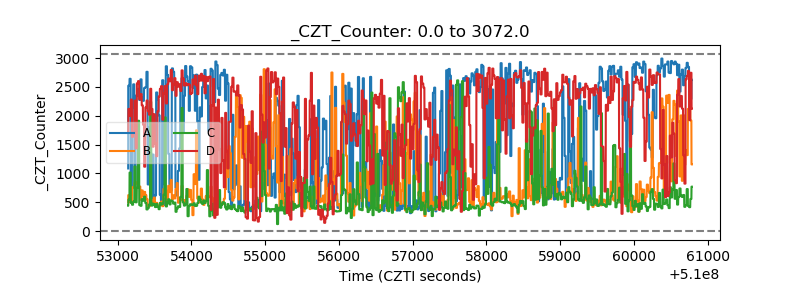 |
| +2.5 Volts monitor | 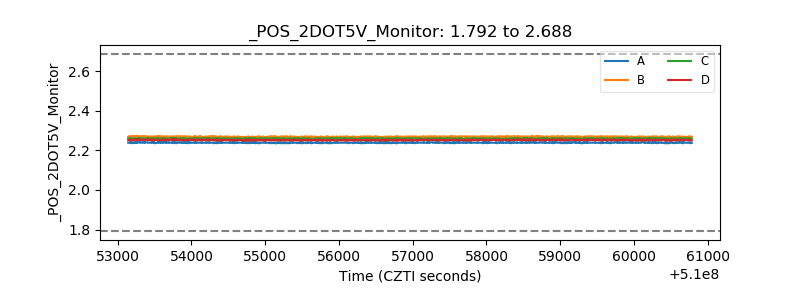 |
| +5 Volts monitor | 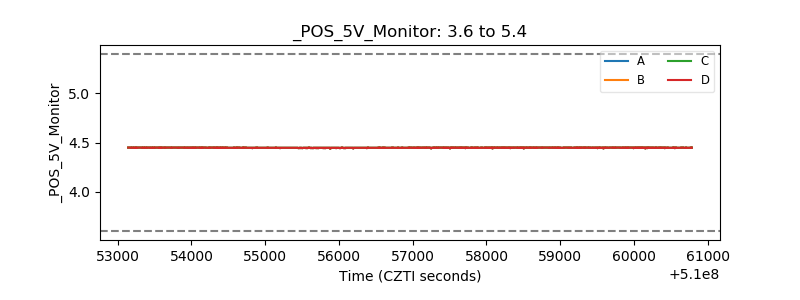 |
| _ROLL_ROT |  |
| _Roll_DEC |  |
| _Roll_RA |  |
| Veto Counter |  |