| Param | Original file | Final file |
|---|---|---|
| Filename | modeM0/AS1A14_083T05_9000006554_56396cztM0_level2.fits | modeM0/AS1A14_083T05_9000006554_56396cztM0_level2_quad_clean.evt |
| Size (bytes) | 1,079,193,600 | 66,856,320 |
| Size | 1.0 GB | 63.8 MB |
| Events in quadrant A | 11,768,497 | 352,694 |
| Events in quadrant B | 7,806,513 | 561,705 |
| Events in quadrant C | 3,610,743 | 623,167 |
| Events in quadrant D | 16,224,380 | 2,236 |
| Mode SS | |||
|---|---|---|---|
| Quadrant | BADHDUFLAG | Total packets | Discarded packets |
| A | 0 | 138 | 0 |
| B | 0 | 138 | 0 |
| C | 0 | 138 | 0 |
| D | 0 | 138 | 0 |
| Mode M0 | |||
|---|---|---|---|
| Quadrant | BADHDUFLAG | Total packets | Discarded packets |
| A | 0 | 39656 | 0 |
| B | 0 | 27981 | 0 |
| C | 0 | 15869 | 0 |
| D | 0 | 53031 | 0 |
| Quadrant | Total seconds | Saturated seconds | Saturation percentage |
|---|---|---|---|
| A | 6951 | 3458 | 49.748238% |
| B | 6952 | 1663 | 23.921174% |
| C | 6951 | 133 | 1.913394% |
| D | 6951 | 6928 | 99.669112% |
Noise dominated data is calculated using 1-second bins in cleaned event files. If a bin has >2000 counts, and if more than 50% of those come from <1% of pixels, then it is considered to be noise-dominated and hence unusable.
| Quadrant | # 1 sec bins | Bins with >0 counts | Bins with >2000 counts | High rate bins dominated by noise | Noise dominated (total time) | Noise dominated (detector-on time) | Marked lightcurve |
|---|---|---|---|---|---|---|---|
| A | 6951 | 6951 | 3071 | 3071 | 44.18% | 44.18% |  |
| B | 6952 | 6951 | 1052 | 1052 | 15.13% | 15.13% |  |
| C | 6951 | 6951 | 81 | 81 | 1.17% | 1.17% |  |
| D | 6950 | 6950 | 5571 | 5571 | 80.16% | 80.16% |  |
Top three noisy pixels from each quadrant. If the there are fewer than three noisy pixels in the level2.evt file, extra rows are filled as -1
| Pixel properties | Quadrant properties | ||||||
|---|---|---|---|---|---|---|---|
| Quadrant | DetID | PixID | Counts | Sigma | Mean | Median | Sigma |
| A | 12 | 3 | 6374374 | 45082.49 | 564 | 551 | 141.4 |
| A | 3 | 14 | 1567987 | 11086.58 | 564 | 551 | 141.4 |
| A | 12 | 194 | 797822 | 5639.15 | 564 | 551 | 141.4 |
| B | 4 | 206 | 3732613 | 26214.64 | 659 | 636 | 142.4 |
| B | 4 | 171 | 544830 | 3822.6 | 659 | 636 | 142.4 |
| B | 5 | 185 | 261301 | 1831.0 | 659 | 636 | 142.4 |
| C | 13 | 3 | 369900 | 1865.79 | 718 | 711 | 197.9 |
| C | 12 | 249 | 100521 | 504.41 | 718 | 711 | 197.9 |
| C | 15 | 230 | 94574 | 474.36 | 718 | 711 | 197.9 |
| D | 8 | 129 | 15015385 | 363392.06 | 138 | 130 | 41.3 |
| D | 2 | 249 | 263618 | 6376.81 | 138 | 130 | 41.3 |
| D | 2 | 120 | 84844 | 2050.21 | 138 | 130 | 41.3 |
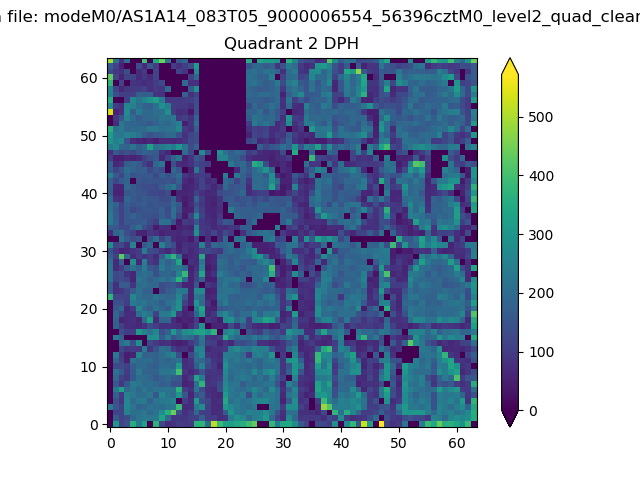
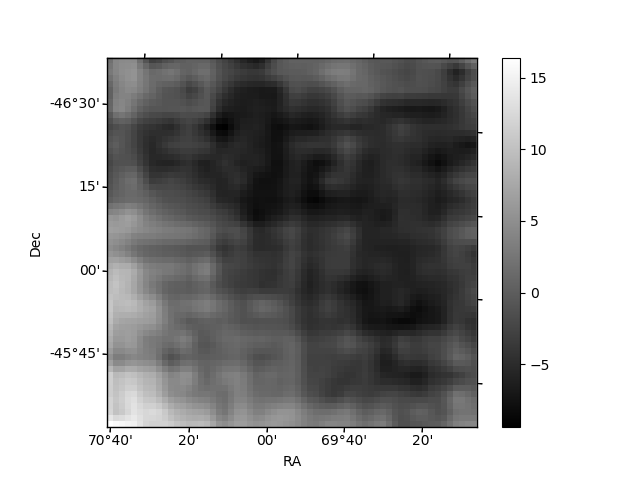
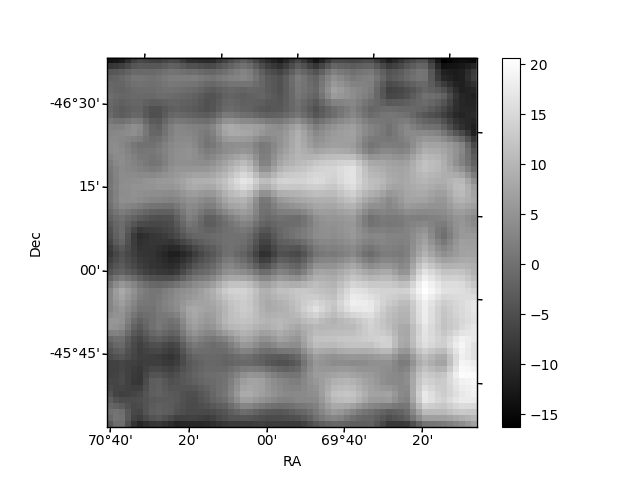
Histogram calculated using DETX and DETY for each event in the final _common_clean file
| Quadrant A |  |
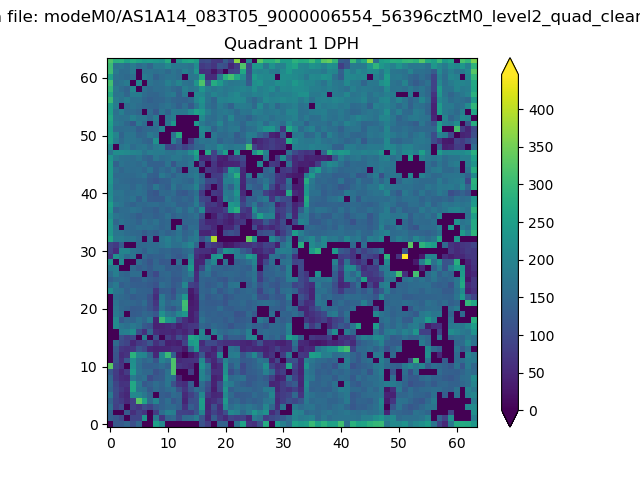 |
Quadrant B |
|---|---|---|---|
| Quadrant D |  |
 |
Quadrant C |
| Plot type | Count rate plots | Images |
|---|---|---|
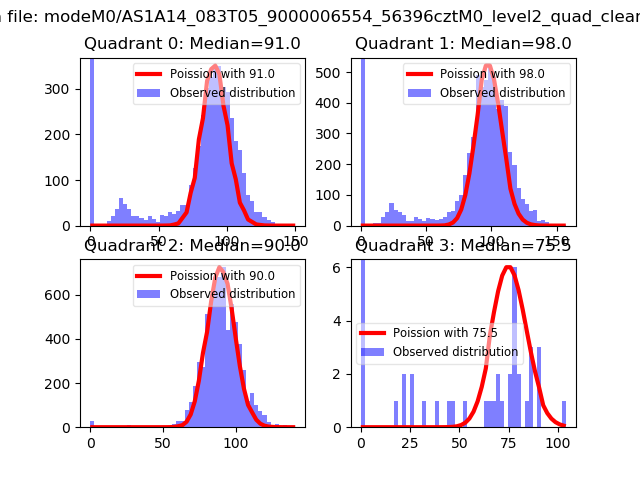
| Comparison with Poisson distribution Blue bars denote a histogram of data divided into 1 sec bins. Red curve is a Poisson curve with rate = median count rate of data. |
 |
 |
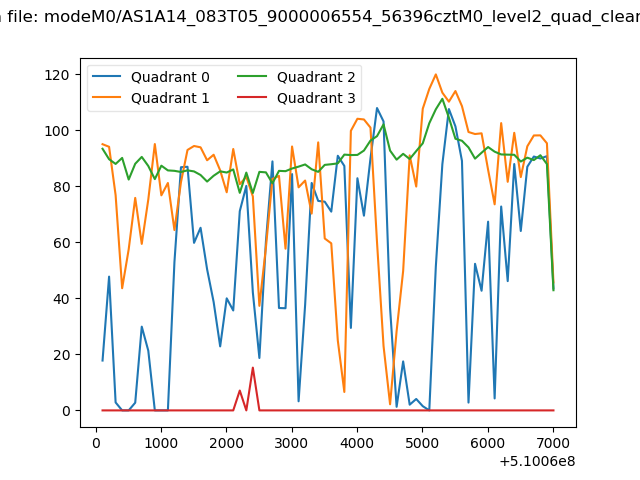
| Quadrant-wise count rates Data is divided into 100 sec bins |
 |
|
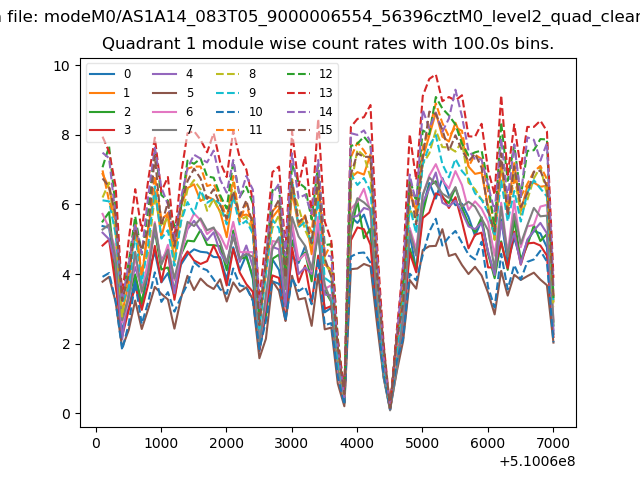
| Module-wise count rates for Quadrant A Data is divided into 100 sec bins |
 |
 |
| Module-wise count rates for Quadrant B Data is divided into 100 sec bins |
 |
 |
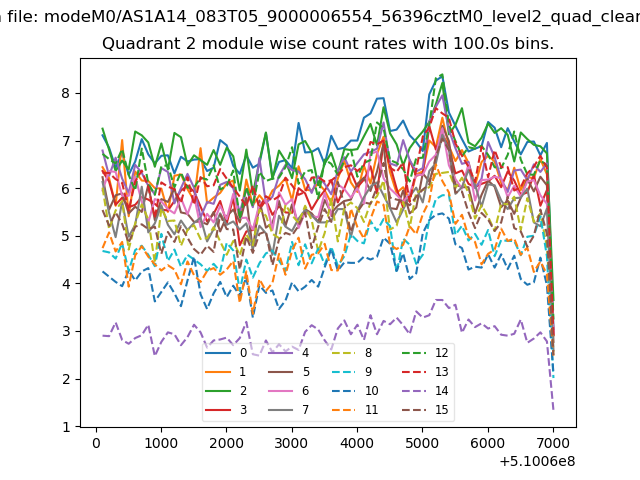
| Module-wise count rates for Quadrant C Data is divided into 100 sec bins |
 |
 |
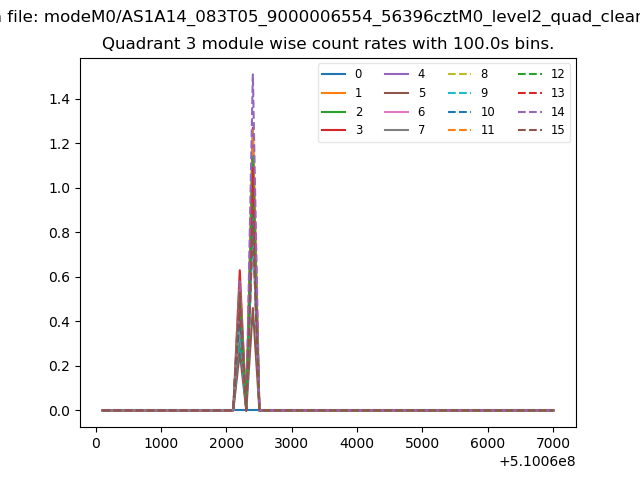
| Module-wise count rates for Quadrant D Data is divided into 100 sec bins |
 |
 |
| Parameter | Plot |
|---|---|
| CZT HV Monitor | 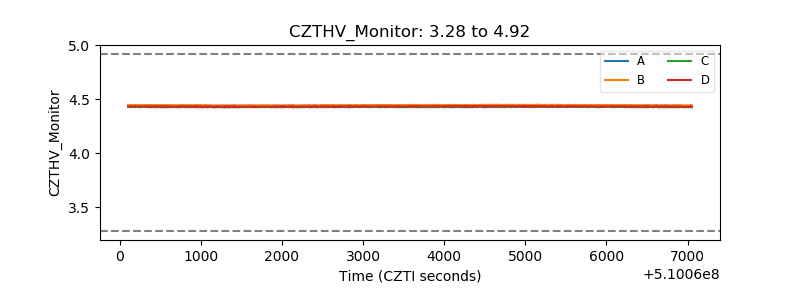 |
| D_VDD |  |
| Temperature 1 | 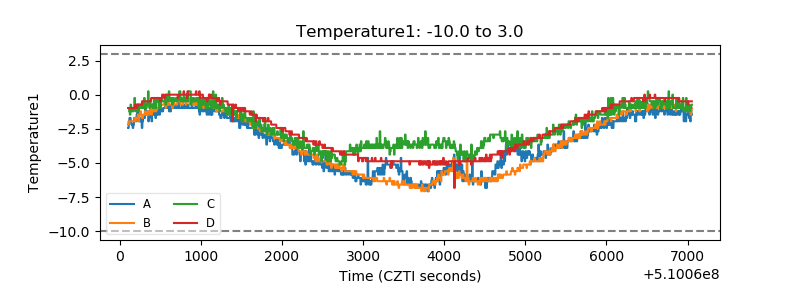 |
| Veto HV Monitor | 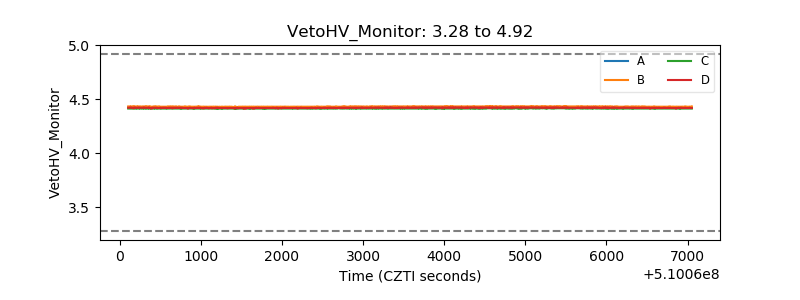 |
| Veto LLD |  |
| Alpha Counter | 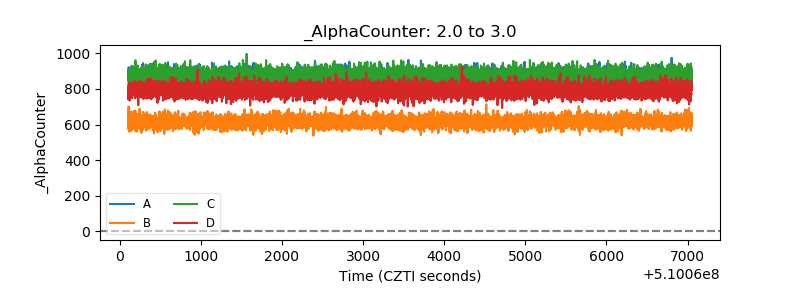 |
| _CPM_Rate | 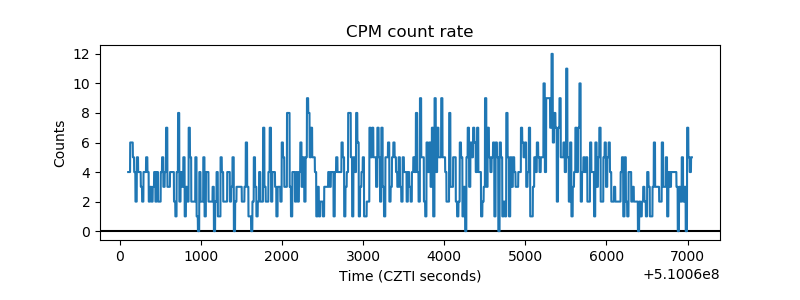 |
| CZT Counter | 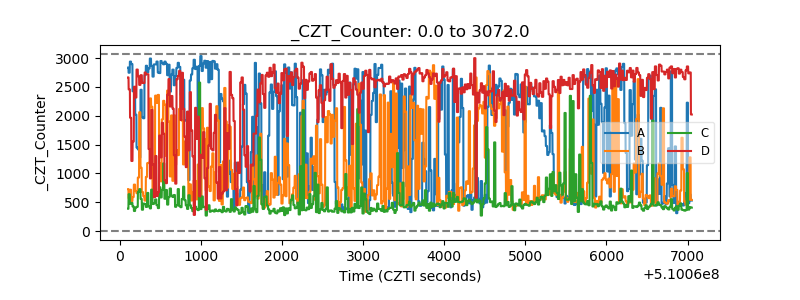 |
| +2.5 Volts monitor | 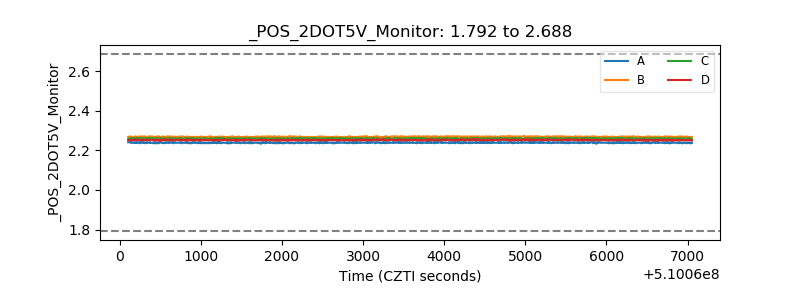 |
| +5 Volts monitor | 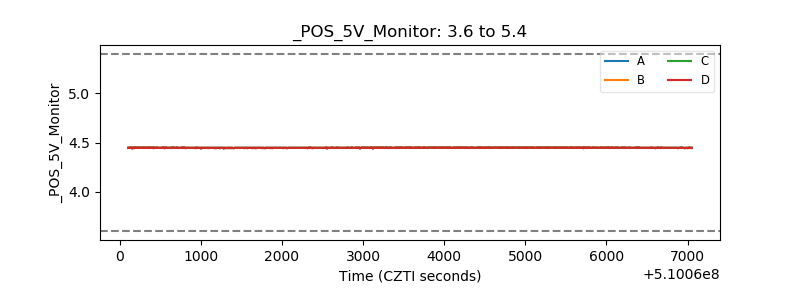 |
| _ROLL_ROT | 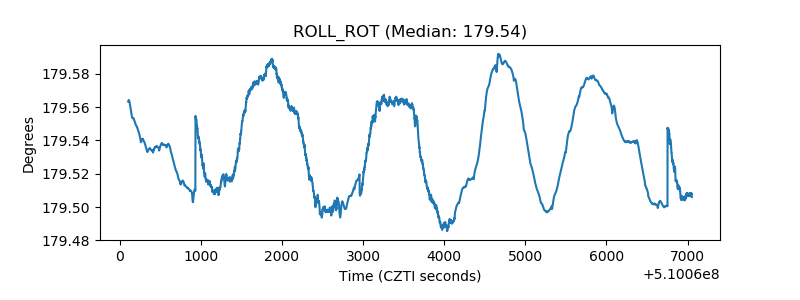 |
| _Roll_DEC | 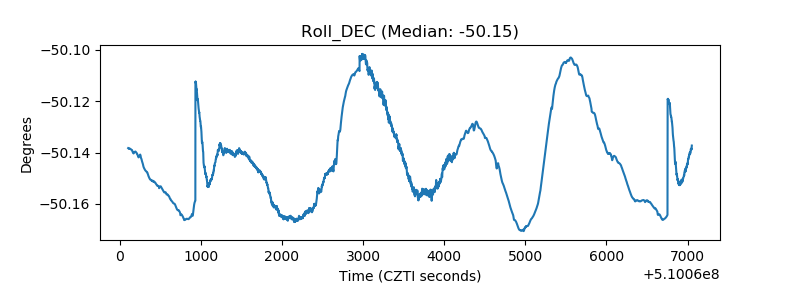 |
| _Roll_RA |  |
| Veto Counter | 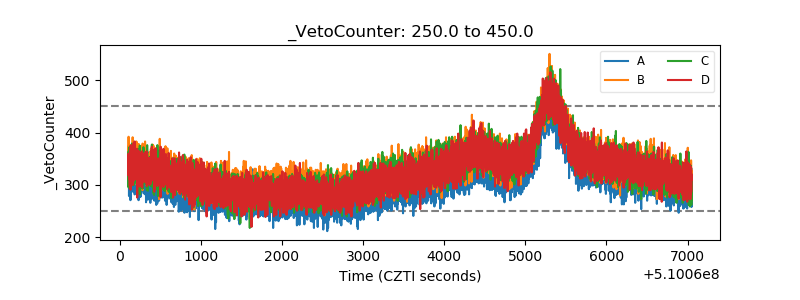 |