| Param | Original file | Final file |
|---|---|---|
| Filename | modeM0/AS1A14_083T05_9000006554_56399cztM0_level2.fits | modeM0/AS1A14_083T05_9000006554_56399cztM0_level2_quad_clean.evt |
| Size (bytes) | 2,372,333,760 | 212,365,440 |
| Size | 2.2 GB | 202.5 MB |
| Events in quadrant A | 30,606,105 | 952,828 |
| Events in quadrant B | 16,993,346 | 1,622,371 |
| Events in quadrant C | 9,253,579 | 1,650,651 |
| Events in quadrant D | 29,520,142 | 912,330 |
| Mode M9 | |||
|---|---|---|---|
| Quadrant | BADHDUFLAG | Total packets | Discarded packets |
| A | 0 | 10 | 0 |
| B | 0 | 10 | 0 |
| C | 0 | 10 | 0 |
| D | 0 | 10 | 0 |
| Mode SS | |||
|---|---|---|---|
| Quadrant | BADHDUFLAG | Total packets | Discarded packets |
| A | 0 | 382 | 0 |
| B | 0 | 382 | 0 |
| C | 0 | 382 | 0 |
| D | 0 | 382 | 0 |
| Mode M0 | |||
|---|---|---|---|
| Quadrant | BADHDUFLAG | Total packets | Discarded packets |
| A | 0 | 103648 | 4 |
| B | 0 | 63353 | 7 |
| C | 0 | 41900 | 4 |
| D | 0 | 100885 | 4 |
| Quadrant | Total seconds | Saturated seconds | Saturation percentage |
|---|---|---|---|
| A | 18714 | 8705 | 46.515977% |
| B | 18713 | 2830 | 15.123176% |
| C | 18713 | 264 | 1.410784% |
| D | 18713 | 7850 | 41.949447% |
Noise dominated data is calculated using 1-second bins in cleaned event files. If a bin has >2000 counts, and if more than 50% of those come from <1% of pixels, then it is considered to be noise-dominated and hence unusable.
| Quadrant | # 1 sec bins | Bins with >0 counts | Bins with >2000 counts | High rate bins dominated by noise | Noise dominated (total time) | Noise dominated (detector-on time) | Marked lightcurve |
|---|---|---|---|---|---|---|---|
| A | 19869 | 18715 | 7589 | 7589 | 38.20% | 40.55% |  |
| B | 19868 | 18717 | 1612 | 1612 | 8.11% | 8.61% |  |
| C | 19868 | 18717 | 167 | 167 | 0.84% | 0.89% |  |
| D | 19868 | 18716 | 6591 | 6591 | 33.17% | 35.22% |  |
Top three noisy pixels from each quadrant. If the there are fewer than three noisy pixels in the level2.evt file, extra rows are filled as -1
| Pixel properties | Quadrant properties | ||||||
|---|---|---|---|---|---|---|---|
| Quadrant | DetID | PixID | Counts | Sigma | Mean | Median | Sigma |
| A | 12 | 3 | 13611262 | 37128.38 | 1485 | 1451 | 366.6 |
| A | 7 | 64 | 5832990 | 15908.79 | 1485 | 1451 | 366.6 |
| A | 12 | 194 | 1654320 | 4509.13 | 1485 | 1451 | 366.6 |
| B | 4 | 206 | 5499742 | 13821.09 | 1878 | 1808 | 397.8 |
| B | 5 | 172 | 1997674 | 5017.35 | 1878 | 1808 | 397.8 |
| B | 4 | 171 | 791451 | 1985.06 | 1878 | 1808 | 397.8 |
| C | 13 | 3 | 523641 | 982.74 | 1936 | 1912 | 530.9 |
| C | 12 | 249 | 416044 | 780.07 | 1936 | 1912 | 530.9 |
| C | 6 | 223 | 199675 | 372.51 | 1936 | 1912 | 530.9 |
| D | 8 | 129 | 21947595 | 55248.42 | 1402 | 1337 | 397.2 |
| D | 2 | 249 | 506299 | 1271.21 | 1402 | 1337 | 397.2 |
| D | 13 | 153 | 288470 | 722.84 | 1402 | 1337 | 397.2 |
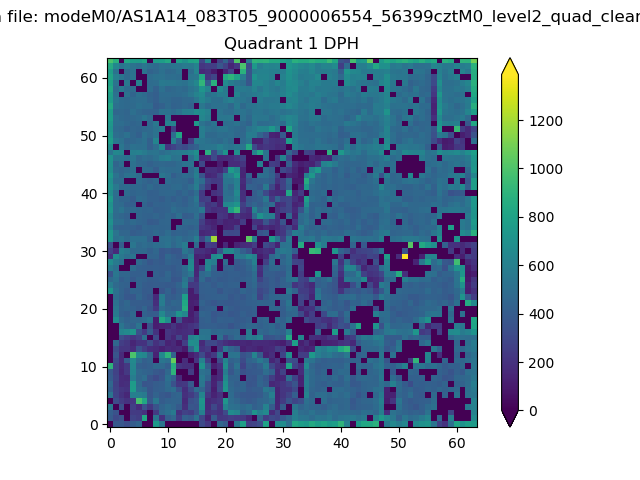
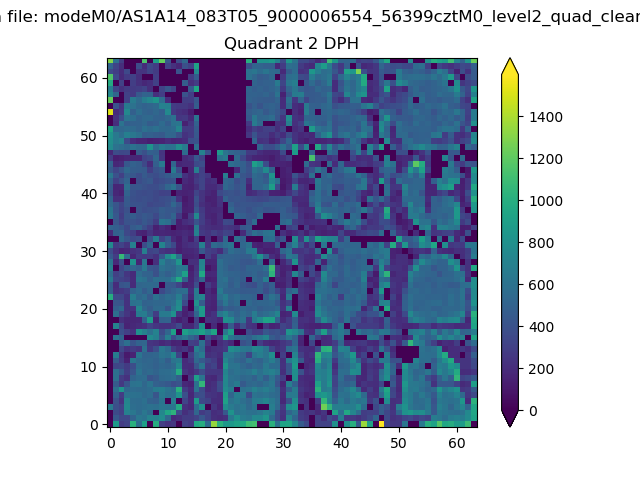
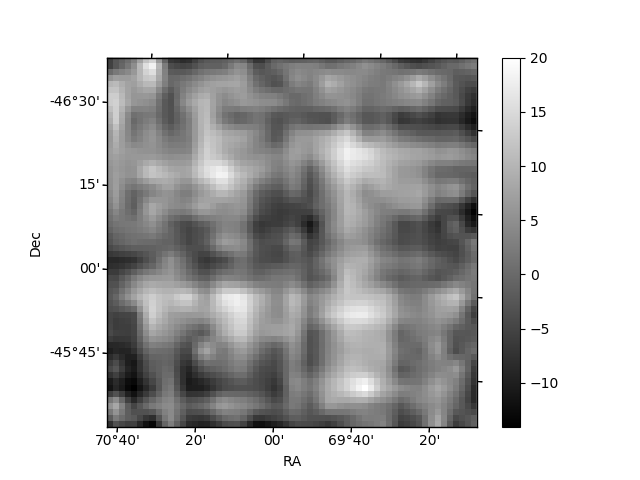
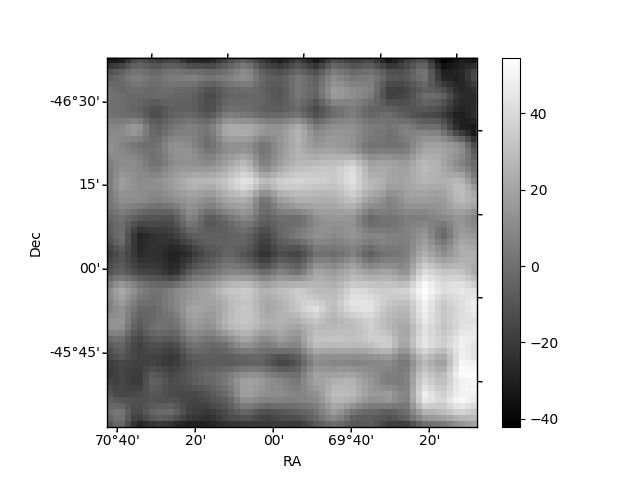
Histogram calculated using DETX and DETY for each event in the final _common_clean file
| Quadrant A |  |
 |
Quadrant B |
|---|---|---|---|
| Quadrant D |  |
 |
Quadrant C |
| Plot type | Count rate plots | Images |
|---|---|---|
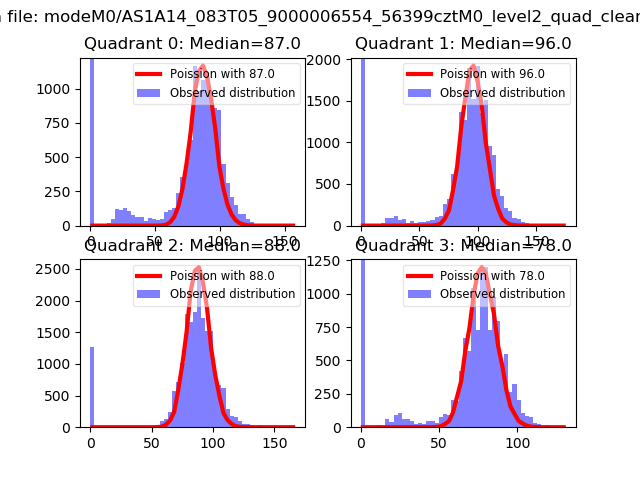
| Comparison with Poisson distribution Blue bars denote a histogram of data divided into 1 sec bins. Red curve is a Poisson curve with rate = median count rate of data. |
 |
 |
| Quadrant-wise count rates Data is divided into 100 sec bins |
 |
|
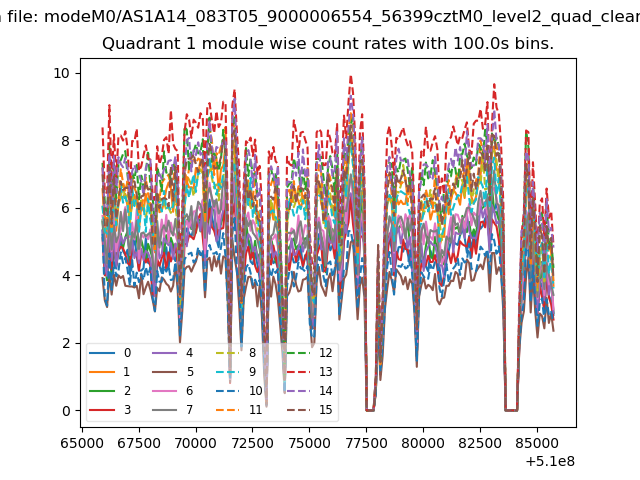
| Module-wise count rates for Quadrant A Data is divided into 100 sec bins |
 |
 |
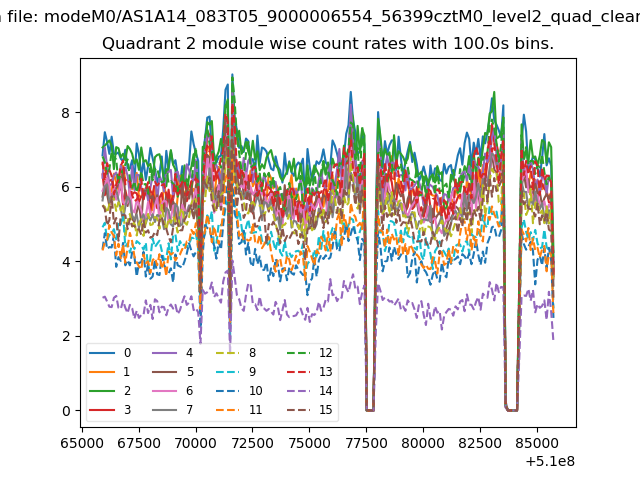
| Module-wise count rates for Quadrant B Data is divided into 100 sec bins |
 |
 |
| Module-wise count rates for Quadrant C Data is divided into 100 sec bins |
 |
 |
| Module-wise count rates for Quadrant D Data is divided into 100 sec bins |
 |
 |
| Parameter | Plot |
|---|---|
| CZT HV Monitor | 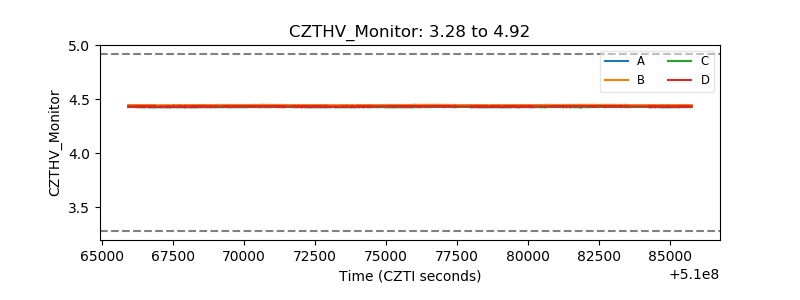 |
| D_VDD |  |
| Temperature 1 | 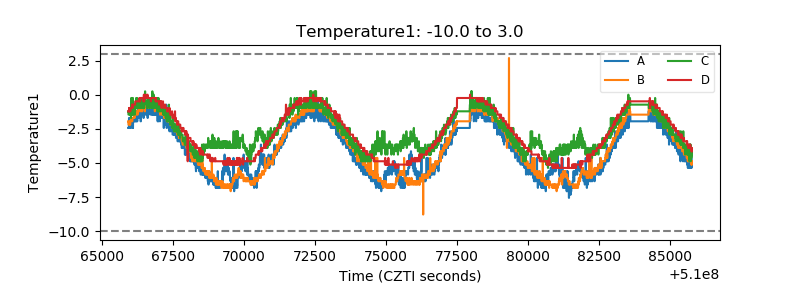 |
| Veto HV Monitor |  |
| Veto LLD |  |
| Alpha Counter |  |
| _CPM_Rate | 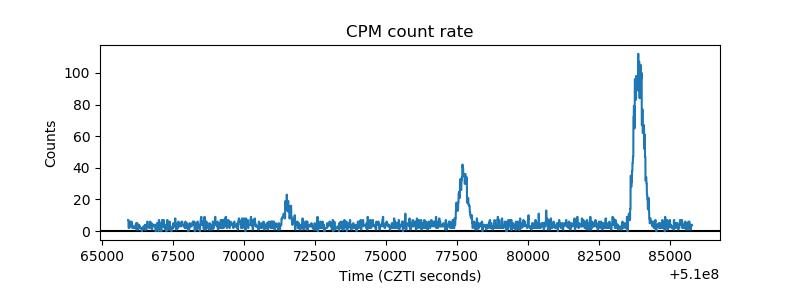 |
| CZT Counter | 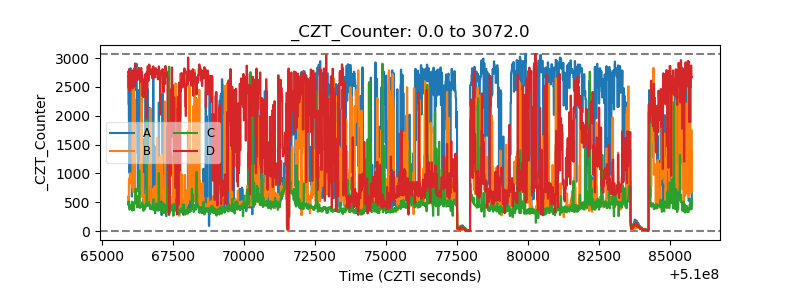 |
| +2.5 Volts monitor | 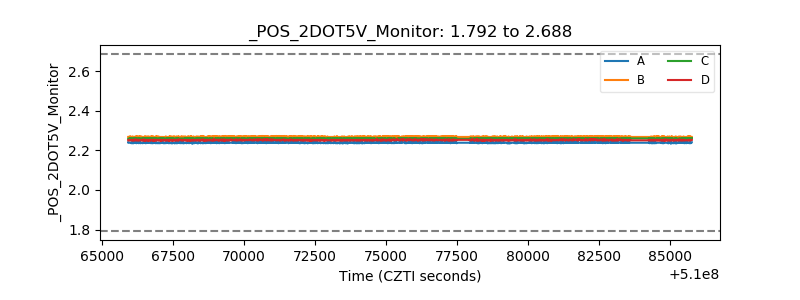 |
| +5 Volts monitor | 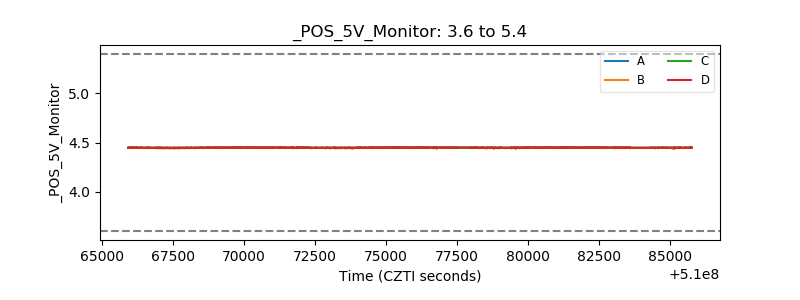 |
| _ROLL_ROT |  |
| _Roll_DEC |  |
| _Roll_RA |  |
| Veto Counter |  |