| Param | Original file | Final file |
|---|---|---|
| Filename | modeM0/AS1A14_083T05_9000006554_56400cztM0_level2.fits | modeM0/AS1A14_083T05_9000006554_56400cztM0_level2_quad_clean.evt |
| Size (bytes) | 1,035,794,880 | 70,107,840 |
| Size | 987.8 MB | 66.9 MB |
| Events in quadrant A | 11,555,768 | 347,645 |
| Events in quadrant B | 6,762,171 | 568,132 |
| Events in quadrant C | 3,448,661 | 607,367 |
| Events in quadrant D | 16,044,673 | 120,942 |
| Mode M9 | |||
|---|---|---|---|
| Quadrant | BADHDUFLAG | Total packets | Discarded packets |
| A | 0 | 8 | 0 |
| B | 0 | 8 | 0 |
| C | 0 | 8 | 0 |
| D | 0 | 8 | 0 |
| Mode SS | |||
|---|---|---|---|
| Quadrant | BADHDUFLAG | Total packets | Discarded packets |
| A | 0 | 140 | 0 |
| B | 0 | 140 | 0 |
| C | 0 | 140 | 0 |
| D | 0 | 140 | 0 |
| Mode M0 | |||
|---|---|---|---|
| Quadrant | BADHDUFLAG | Total packets | Discarded packets |
| A | 0 | 39067 | 2 |
| B | 0 | 24871 | 1 |
| C | 0 | 15418 | 1 |
| D | 0 | 52338 | 1 |
| Quadrant | Total seconds | Saturated seconds | Saturation percentage |
|---|---|---|---|
| A | 6860 | 3272 | 47.696793% |
| B | 6861 | 1406 | 20.492640% |
| C | 6861 | 72 | 1.049410% |
| D | 6861 | 5660 | 82.495263% |
Noise dominated data is calculated using 1-second bins in cleaned event files. If a bin has >2000 counts, and if more than 50% of those come from <1% of pixels, then it is considered to be noise-dominated and hence unusable.
| Quadrant | # 1 sec bins | Bins with >0 counts | Bins with >2000 counts | High rate bins dominated by noise | Noise dominated (total time) | Noise dominated (detector-on time) | Marked lightcurve |
|---|---|---|---|---|---|---|---|
| A | 7674 | 6859 | 3058 | 3058 | 39.85% | 44.58% |  |
| B | 7676 | 6862 | 889 | 889 | 11.58% | 12.96% |  |
| C | 7676 | 6862 | 49 | 49 | 0.64% | 0.71% | 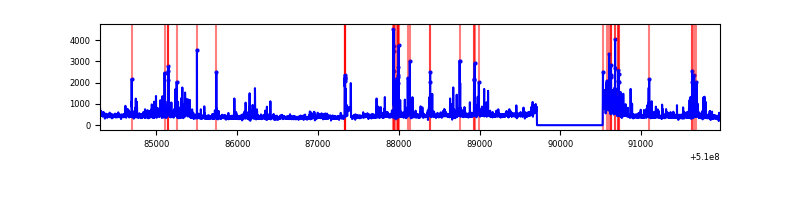 |
| D | 7675 | 6861 | 4954 | 4954 | 64.55% | 72.21% |  |
Top three noisy pixels from each quadrant. If the there are fewer than three noisy pixels in the level2.evt file, extra rows are filled as -1
| Pixel properties | Quadrant properties | ||||||
|---|---|---|---|---|---|---|---|
| Quadrant | DetID | PixID | Counts | Sigma | Mean | Median | Sigma |
| A | 12 | 3 | 6392516 | 49084.58 | 513 | 500 | 130.2 |
| A | 4 | 95 | 1006505 | 7725.16 | 513 | 500 | 130.2 |
| A | 12 | 194 | 762434 | 5850.93 | 513 | 500 | 130.2 |
| B | 4 | 206 | 2534980 | 18275.82 | 647 | 623 | 138.7 |
| B | 5 | 172 | 848396 | 6113.48 | 647 | 623 | 138.7 |
| B | 4 | 171 | 316585 | 2278.47 | 647 | 623 | 138.7 |
| C | 12 | 249 | 158972 | 826.68 | 696 | 691 | 191.5 |
| C | 15 | 230 | 150019 | 779.92 | 696 | 691 | 191.5 |
| C | 6 | 223 | 106279 | 551.47 | 696 | 691 | 191.5 |
| D | 8 | 129 | 14255336 | 156247.0 | 313 | 296 | 91.2 |
| D | 8 | 240 | 217451 | 2380.2 | 313 | 296 | 91.2 |
| D | 2 | 249 | 72383 | 790.13 | 313 | 296 | 91.2 |
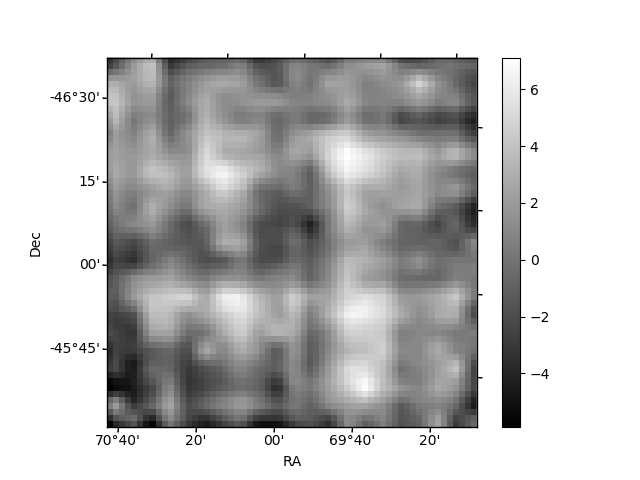
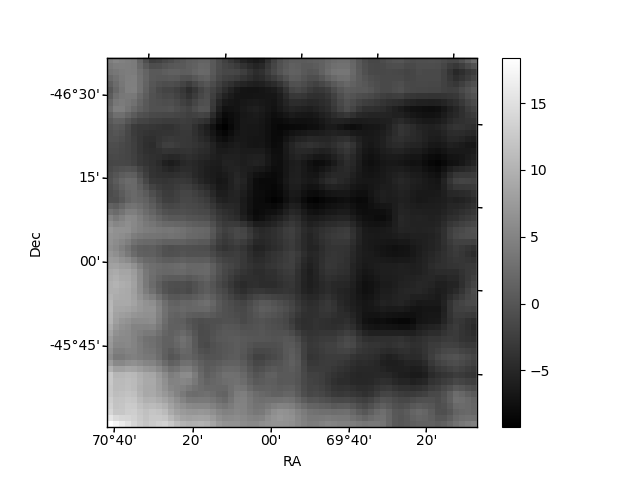
Histogram calculated using DETX and DETY for each event in the final _common_clean file
| Quadrant A | 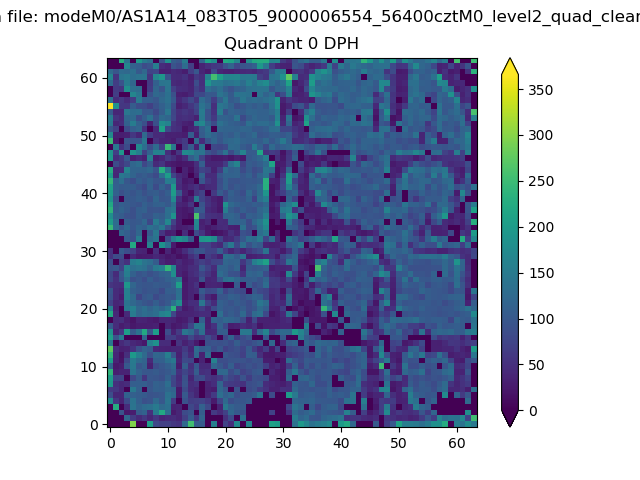 |
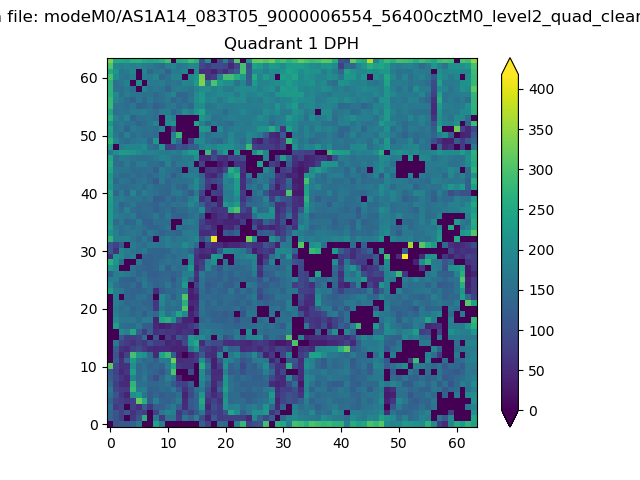 |
Quadrant B |
|---|---|---|---|
| Quadrant D |  |
 |
Quadrant C |
| Plot type | Count rate plots | Images |
|---|---|---|
| Comparison with Poisson distribution Blue bars denote a histogram of data divided into 1 sec bins. Red curve is a Poisson curve with rate = median count rate of data. |
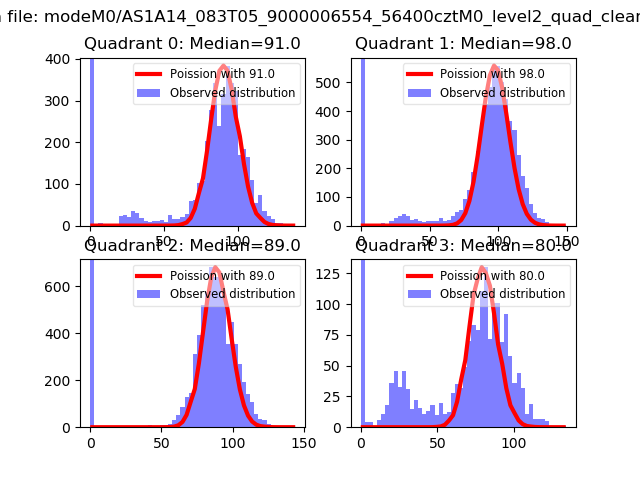 |
 |
| Quadrant-wise count rates Data is divided into 100 sec bins |
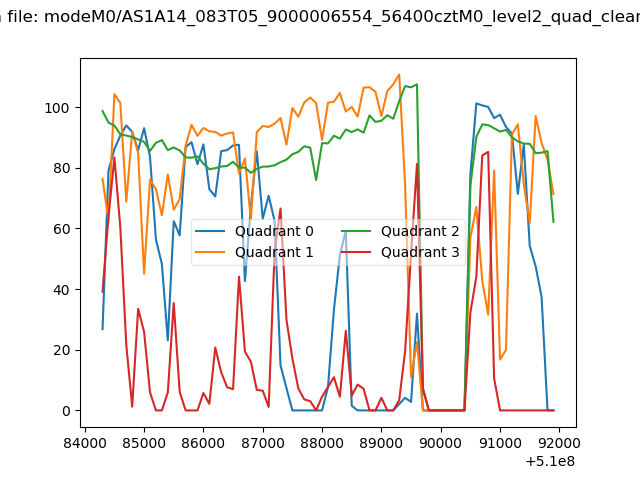 |
|
| Module-wise count rates for Quadrant A Data is divided into 100 sec bins |
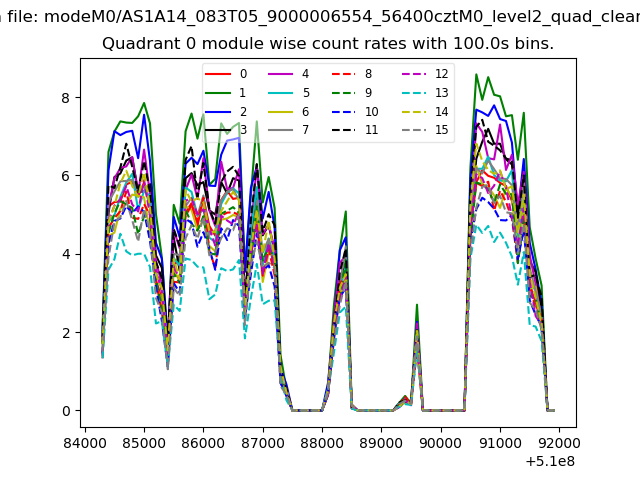 |
 |
| Module-wise count rates for Quadrant B Data is divided into 100 sec bins |
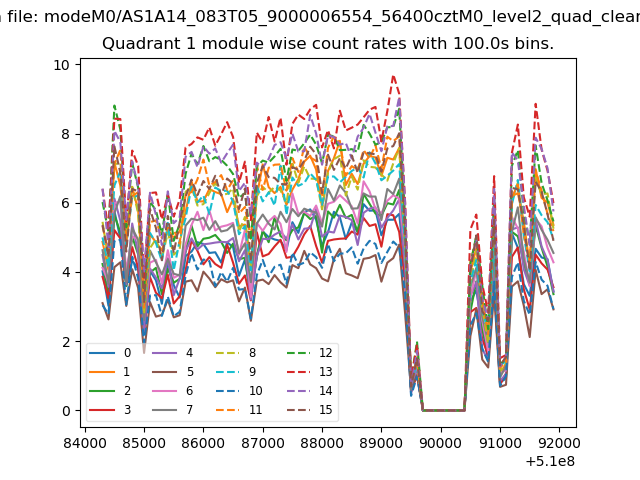 |
 |
| Module-wise count rates for Quadrant C Data is divided into 100 sec bins |
 |
 |
| Module-wise count rates for Quadrant D Data is divided into 100 sec bins |
 |
 |
| Parameter | Plot |
|---|---|
| CZT HV Monitor |  |
| D_VDD |  |
| Temperature 1 |  |
| Veto HV Monitor | 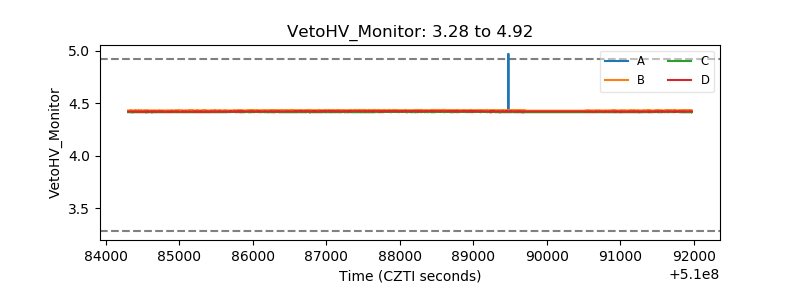 |
| Veto LLD | 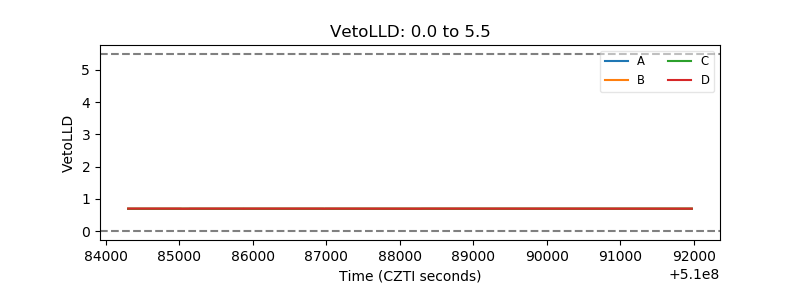 |
| Alpha Counter |  |
| _CPM_Rate | 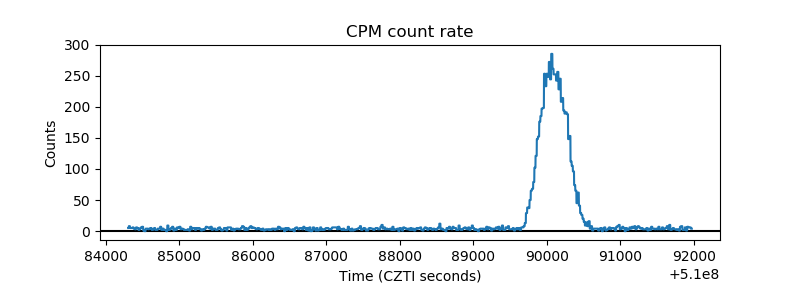 |
| CZT Counter |  |
| +2.5 Volts monitor |  |
| +5 Volts monitor |  |
| _ROLL_ROT | 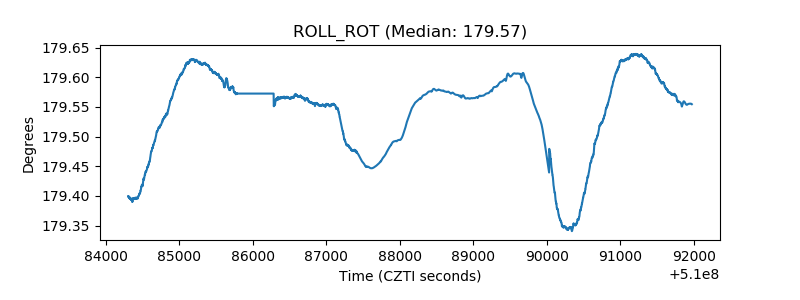 |
| _Roll_DEC | 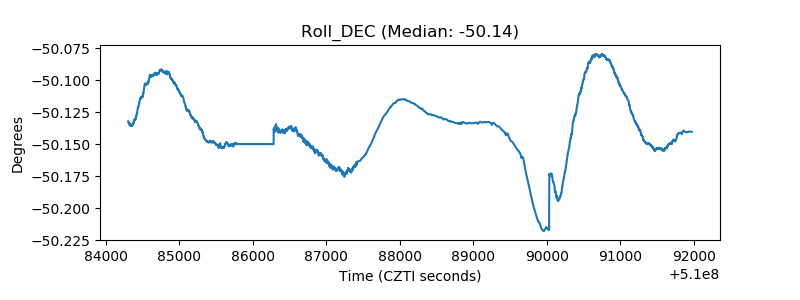 |
| _Roll_RA |  |
| Veto Counter | 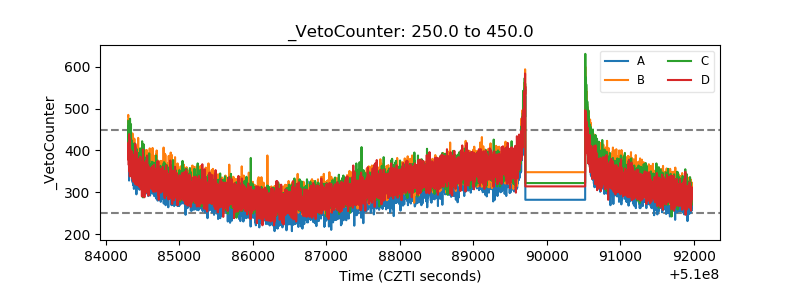 |