| Param | Original file | Final file |
|---|---|---|
| Filename | modeM0/AS1A14_083T05_9000006554_56403cztM0_level2.fits | modeM0/AS1A14_083T05_9000006554_56403cztM0_level2_quad_clean.evt |
| Size (bytes) | 868,417,920 | 66,044,160 |
| Size | 828.2 MB | 63.0 MB |
| Events in quadrant A | 14,974,708 | 324,584 |
| Events in quadrant B | 6,333,939 | 624,594 |
| Events in quadrant C | 3,311,079 | 591,970 |
| Events in quadrant D | 7,021,542 | 827 |
| Mode M9 | |||
|---|---|---|---|
| Quadrant | BADHDUFLAG | Total packets | Discarded packets |
| A | 0 | 11 | 0 |
| B | 0 | 11 | 0 |
| C | 0 | 11 | 0 |
| D | 0 | 11 | 0 |
| Mode SS | |||
|---|---|---|---|
| Quadrant | BADHDUFLAG | Total packets | Discarded packets |
| A | 0 | 132 | 0 |
| B | 0 | 132 | 0 |
| C | 0 | 132 | 0 |
| D | 0 | 132 | 0 |
| Mode M0 | |||
|---|---|---|---|
| Quadrant | BADHDUFLAG | Total packets | Discarded packets |
| A | 0 | 48681 | 0 |
| B | 0 | 23299 | 0 |
| C | 0 | 14596 | 0 |
| D | 0 | 25519 | 0 |
| Quadrant | Total seconds | Saturated seconds | Saturation percentage |
|---|---|---|---|
| A | 6475 | 4904 | 75.737452% |
| B | 6475 | 1187 | 18.332046% |
| C | 6476 | 58 | 0.895615% |
| D | 6476 | 6476 | 100.000000% |
Noise dominated data is calculated using 1-second bins in cleaned event files. If a bin has >2000 counts, and if more than 50% of those come from <1% of pixels, then it is considered to be noise-dominated and hence unusable.
| Quadrant | # 1 sec bins | Bins with >0 counts | Bins with >2000 counts | High rate bins dominated by noise | Noise dominated (total time) | Noise dominated (detector-on time) | Marked lightcurve |
|---|---|---|---|---|---|---|---|
| A | 7585 | 6476 | 4616 | 4616 | 60.86% | 71.28% | 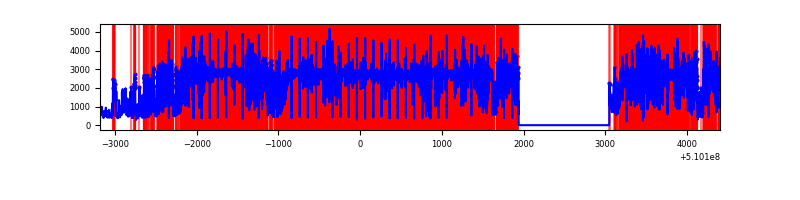 |
| B | 7585 | 6475 | 724 | 724 | 9.55% | 11.18% |  |
| C | 7586 | 6477 | 53 | 53 | 0.70% | 0.82% |  |
| D | 7585 | 6475 | 859 | 859 | 11.32% | 13.27% |  |
Top three noisy pixels from each quadrant. If the there are fewer than three noisy pixels in the level2.evt file, extra rows are filled as -1
| Pixel properties | Quadrant properties | ||||||
|---|---|---|---|---|---|---|---|
| Quadrant | DetID | PixID | Counts | Sigma | Mean | Median | Sigma |
| A | 12 | 3 | 9893995 | 108604.98 | 361 | 352 | 91.1 |
| A | 4 | 95 | 1447432 | 15884.96 | 361 | 352 | 91.1 |
| A | 12 | 194 | 1182337 | 12974.94 | 361 | 352 | 91.1 |
| B | 4 | 206 | 1920429 | 14366.05 | 633 | 610 | 133.6 |
| B | 5 | 172 | 815423 | 6097.26 | 633 | 610 | 133.6 |
| B | 5 | 185 | 460420 | 3440.76 | 633 | 610 | 133.6 |
| C | 12 | 254 | 297226 | 1616.07 | 668 | 662 | 183.5 |
| C | 12 | 249 | 205667 | 1117.14 | 668 | 662 | 183.5 |
| C | 15 | 230 | 54317 | 292.38 | 668 | 662 | 183.5 |
| D | 8 | 129 | 6943530 | 1252699.3 | 14 | 13 | 5.5 |
| D | 2 | 249 | 5683 | 1022.94 | 14 | 13 | 5.5 |
| D | 8 | 113 | 2546 | 456.99 | 14 | 13 | 5.5 |
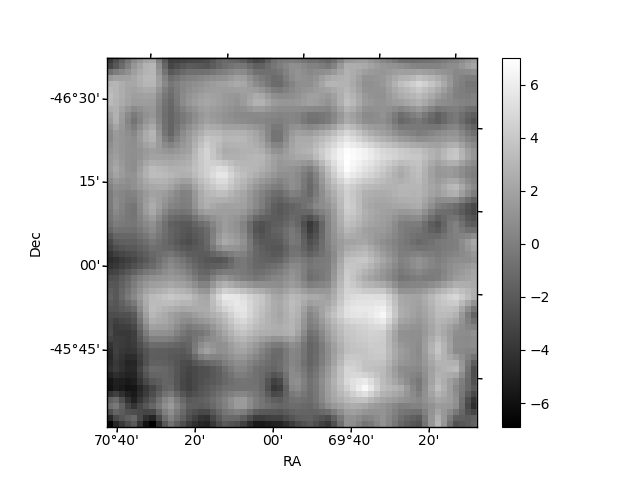
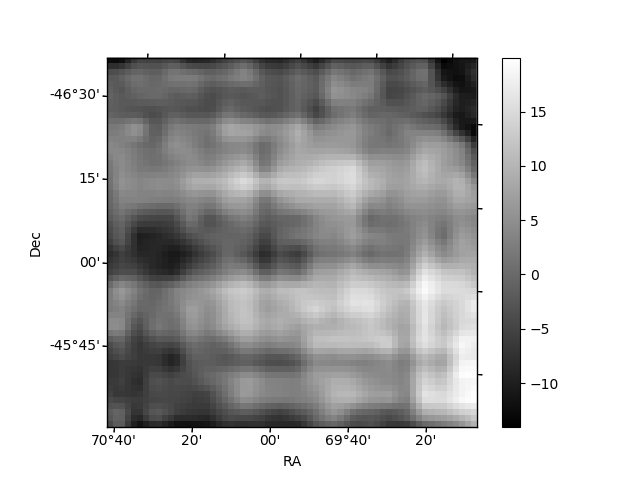
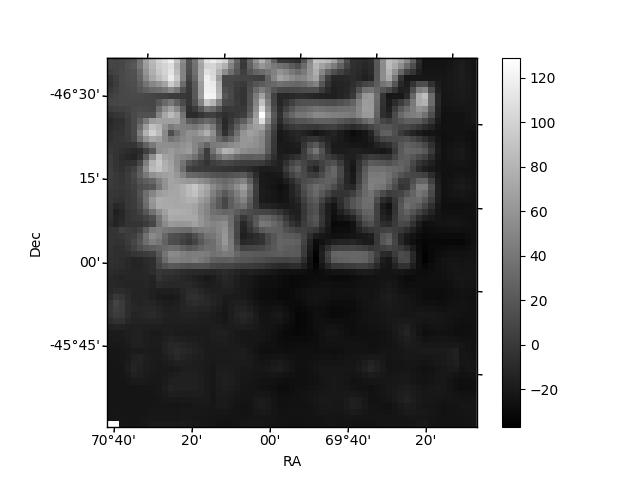
Histogram calculated using DETX and DETY for each event in the final _common_clean file
| Quadrant A | 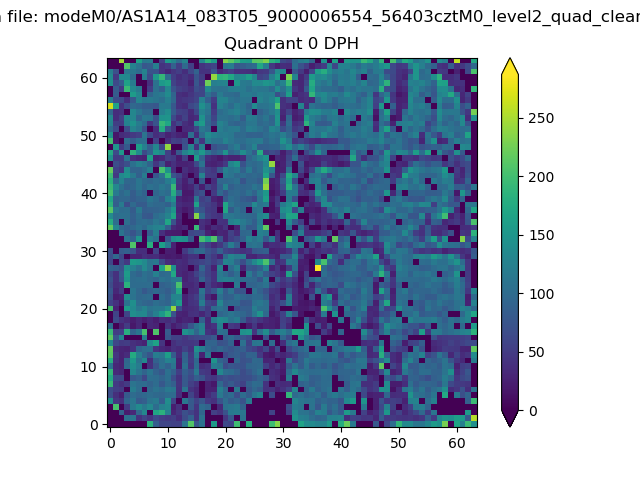 |
 |
Quadrant B |
|---|---|---|---|
| Quadrant D | 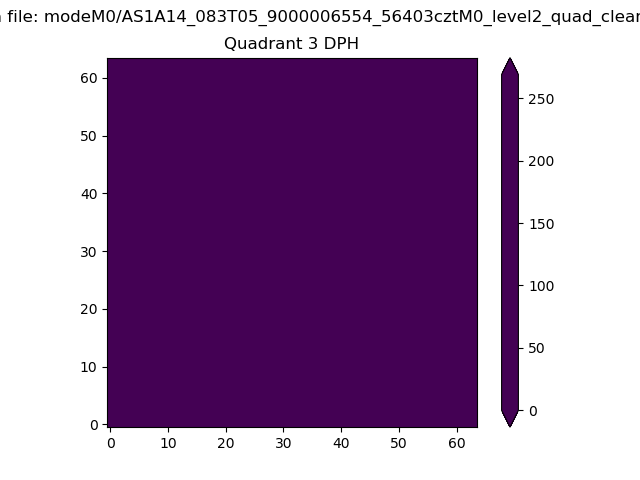 |
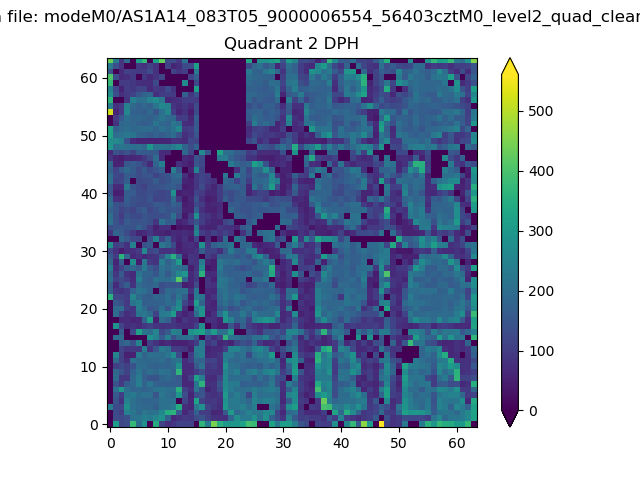 |
Quadrant C |
| Plot type | Count rate plots | Images |
|---|---|---|
| Comparison with Poisson distribution Blue bars denote a histogram of data divided into 1 sec bins. Red curve is a Poisson curve with rate = median count rate of data. |
 |
 |
| Quadrant-wise count rates Data is divided into 100 sec bins |
 |
|
| Module-wise count rates for Quadrant A Data is divided into 100 sec bins |
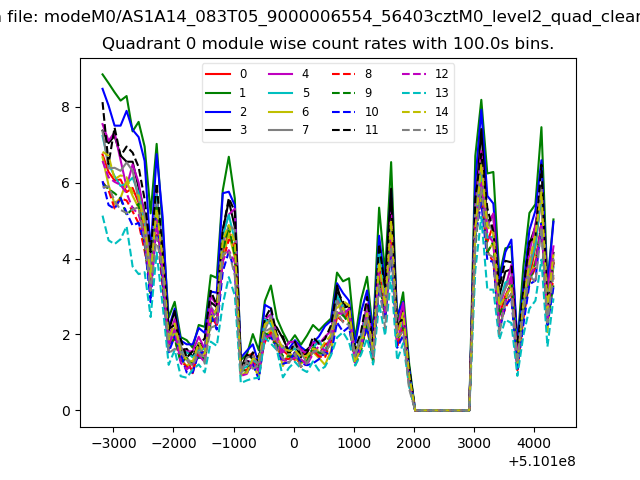 |
 |
| Module-wise count rates for Quadrant B Data is divided into 100 sec bins |
 |
 |
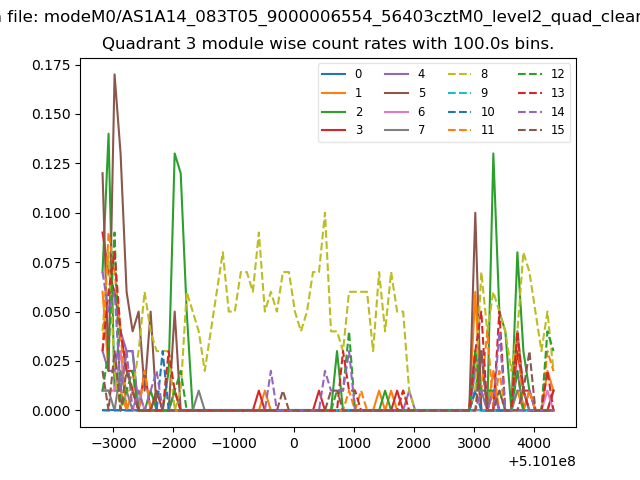
| Module-wise count rates for Quadrant C Data is divided into 100 sec bins |
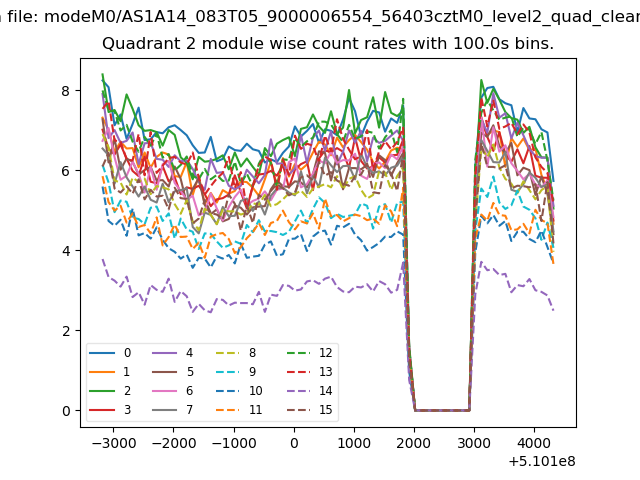 |
 |
| Module-wise count rates for Quadrant D Data is divided into 100 sec bins |
 |
 |
| Parameter | Plot |
|---|---|
| CZT HV Monitor | 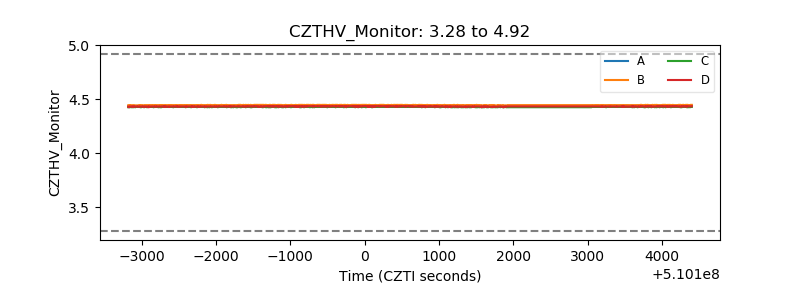 |
| D_VDD |  |
| Temperature 1 | 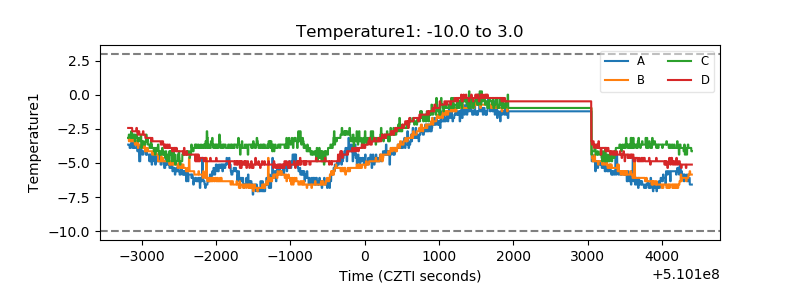 |
| Veto HV Monitor | 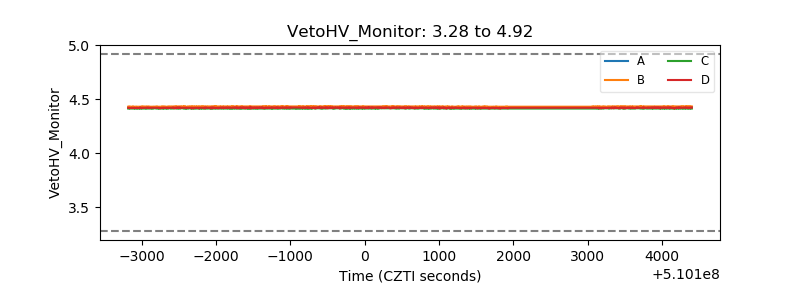 |
| Veto LLD |  |
| Alpha Counter |  |
| _CPM_Rate |  |
| CZT Counter | 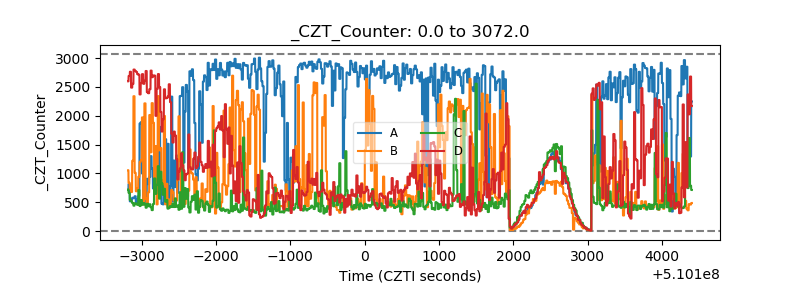 |
| +2.5 Volts monitor | 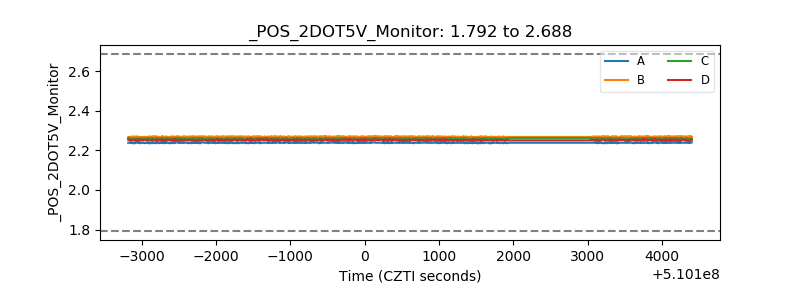 |
| +5 Volts monitor | 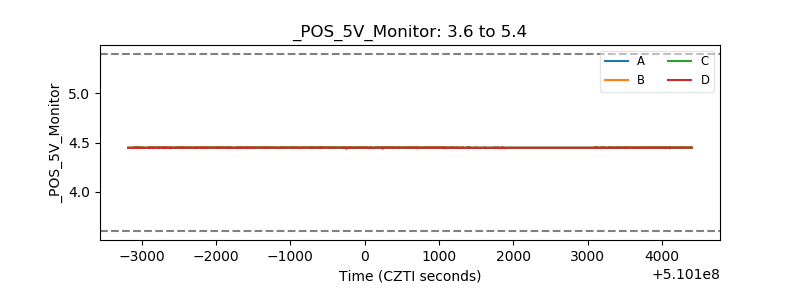 |
| _ROLL_ROT | 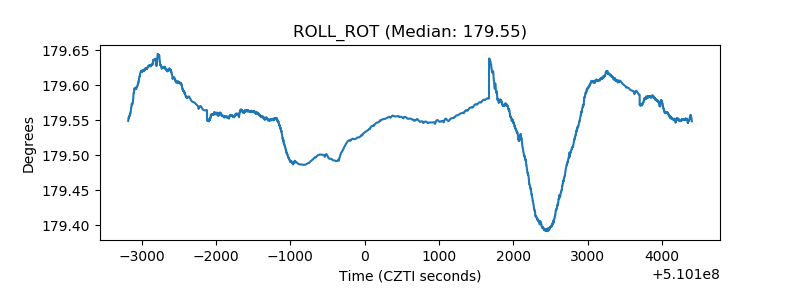 |
| _Roll_DEC | 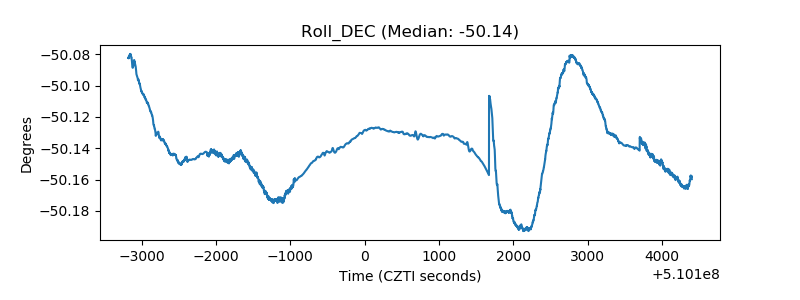 |
| _Roll_RA |  |
| Veto Counter | 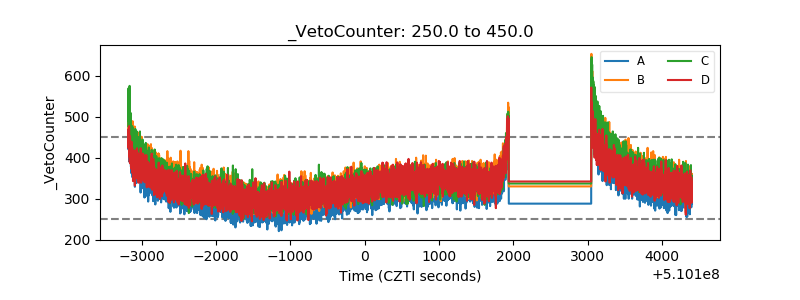 |