| Param | Original file | Final file |
|---|---|---|
| Filename | modeM0/AS1A14_083T05_9000006554_56404cztM0_level2.fits | modeM0/AS1A14_083T05_9000006554_56404cztM0_level2_quad_clean.evt |
| Size (bytes) | 790,724,160 | 65,384,640 |
| Size | 754.1 MB | 62.4 MB |
| Events in quadrant A | 11,112,985 | 415,581 |
| Events in quadrant B | 5,653,349 | 536,292 |
| Events in quadrant C | 3,580,028 | 557,702 |
| Events in quadrant D | 8,404,021 | 925 |
| Mode M9 | |||
|---|---|---|---|
| Quadrant | BADHDUFLAG | Total packets | Discarded packets |
| A | 0 | 18 | 0 |
| B | 0 | 18 | 0 |
| C | 0 | 19 | 0 |
| D | 0 | 19 | 0 |
| Mode SS | |||
|---|---|---|---|
| Quadrant | BADHDUFLAG | Total packets | Discarded packets |
| A | 0 | 136 | 0 |
| B | 0 | 136 | 0 |
| C | 0 | 136 | 0 |
| D | 0 | 136 | 0 |
| Mode M0 | |||
|---|---|---|---|
| Quadrant | BADHDUFLAG | Total packets | Discarded packets |
| A | 0 | 37536 | 0 |
| B | 0 | 21393 | 0 |
| C | 0 | 15423 | 0 |
| D | 0 | 29704 | 0 |
| Quadrant | Total seconds | Saturated seconds | Saturation percentage |
|---|---|---|---|
| A | 6650 | 2920 | 43.909774% |
| B | 6650 | 2056 | 30.917293% |
| C | 6650 | 97 | 1.458647% |
| D | 6650 | 6650 | 100.000000% |
Noise dominated data is calculated using 1-second bins in cleaned event files. If a bin has >2000 counts, and if more than 50% of those come from <1% of pixels, then it is considered to be noise-dominated and hence unusable.
| Quadrant | # 1 sec bins | Bins with >0 counts | Bins with >2000 counts | High rate bins dominated by noise | Noise dominated (total time) | Noise dominated (detector-on time) | Marked lightcurve |
|---|---|---|---|---|---|---|---|
| A | 8059 | 6807 | 2658 | 2658 | 32.98% | 39.05% |  |
| B | 8058 | 6661 | 415 | 415 | 5.15% | 6.23% |  |
| C | 8059 | 6925 | 67 | 67 | 0.83% | 0.97% | 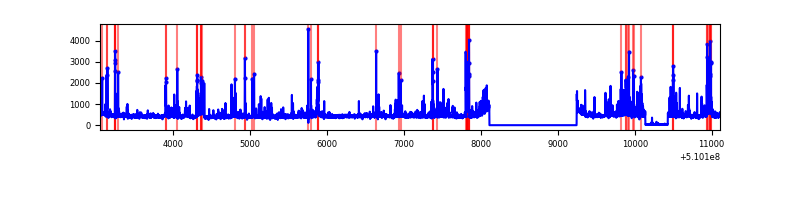 |
| D | 8058 | 6674 | 1882 | 1882 | 23.36% | 28.20% |  |
Top three noisy pixels from each quadrant. If the there are fewer than three noisy pixels in the level2.evt file, extra rows are filled as -1
| Pixel properties | Quadrant properties | ||||||
|---|---|---|---|---|---|---|---|
| Quadrant | DetID | PixID | Counts | Sigma | Mean | Median | Sigma |
| A | 12 | 3 | 4821437 | 33884.83 | 570 | 554 | 142.3 |
| A | 4 | 95 | 2069410 | 14541.49 | 570 | 554 | 142.3 |
| A | 12 | 194 | 624265 | 4383.92 | 570 | 554 | 142.3 |
| B | 5 | 172 | 1919515 | 16539.9 | 548 | 531 | 116.0 |
| B | 4 | 206 | 992705 | 8551.64 | 548 | 531 | 116.0 |
| B | 4 | 171 | 268837 | 2312.55 | 548 | 531 | 116.0 |
| C | 12 | 254 | 595926 | 3100.68 | 703 | 697 | 192.0 |
| C | 12 | 249 | 130721 | 677.32 | 703 | 697 | 192.0 |
| C | 5 | 250 | 35822 | 182.97 | 703 | 697 | 192.0 |
| D | 8 | 129 | 8297298 | 1199347.02 | 18 | 17 | 6.9 |
| D | 2 | 31 | 7377 | 1063.87 | 18 | 17 | 6.9 |
| D | 2 | 249 | 5566 | 802.09 | 18 | 17 | 6.9 |
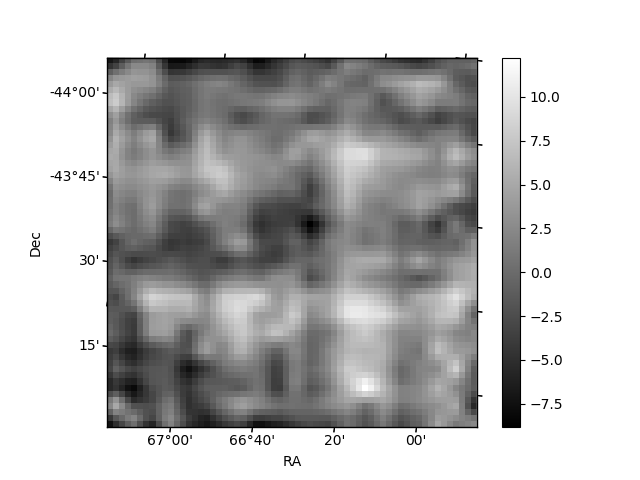
Histogram calculated using DETX and DETY for each event in the final _common_clean file
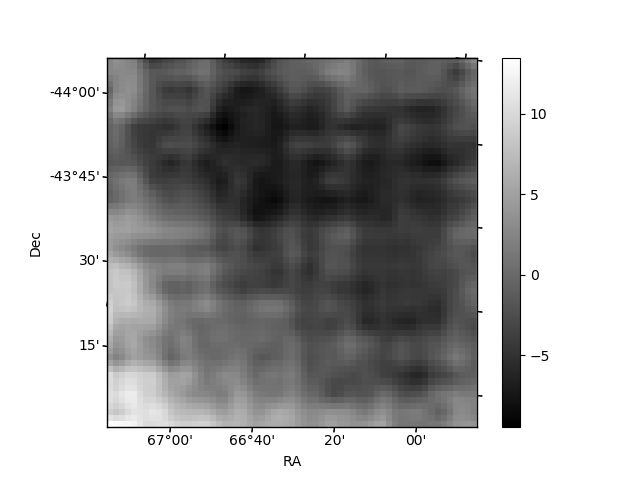
| Quadrant A | 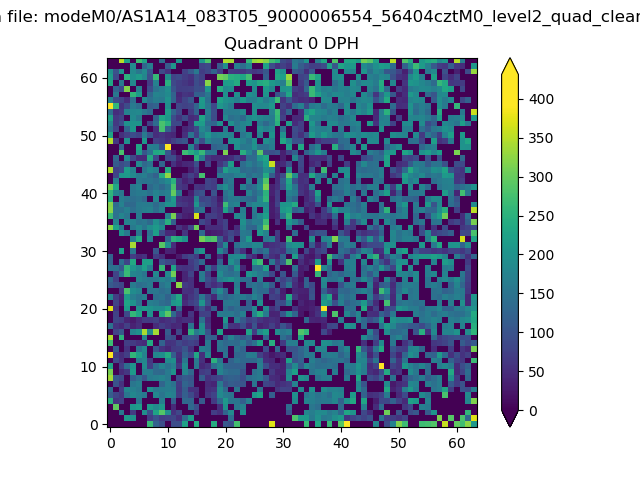 |
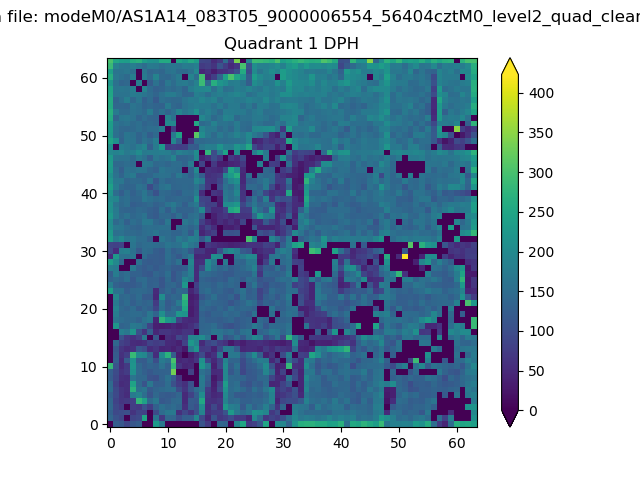 |
Quadrant B |
|---|---|---|---|
| Quadrant D | 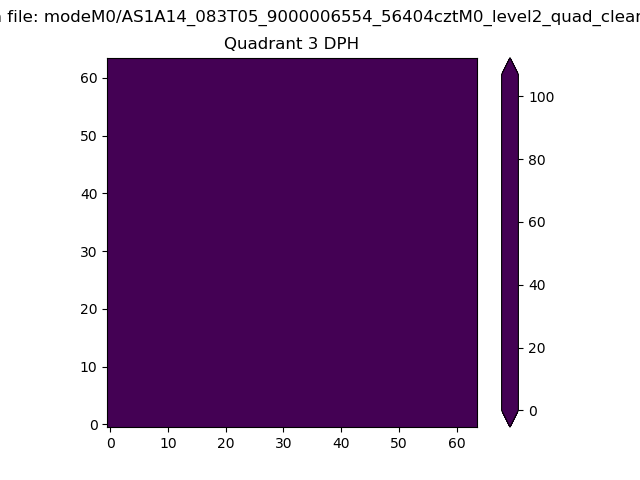 |
 |
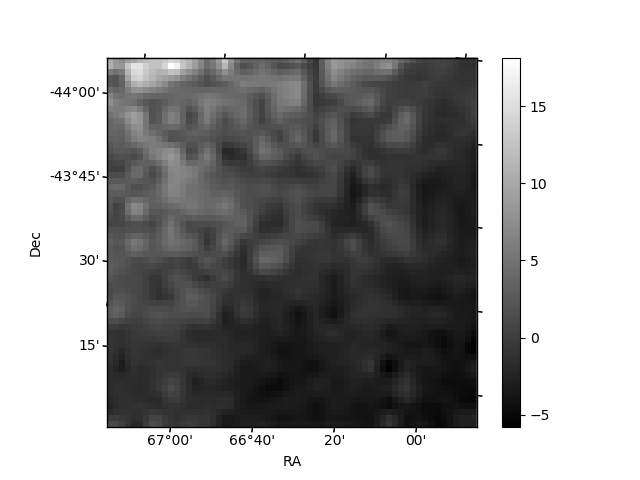
Quadrant C |
| Plot type | Count rate plots | Images |
|---|---|---|
| Comparison with Poisson distribution Blue bars denote a histogram of data divided into 1 sec bins. Red curve is a Poisson curve with rate = median count rate of data. |
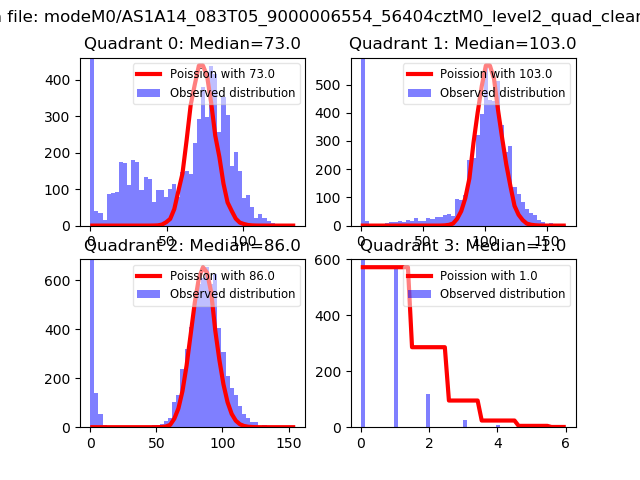 |
 |
| Quadrant-wise count rates Data is divided into 100 sec bins |
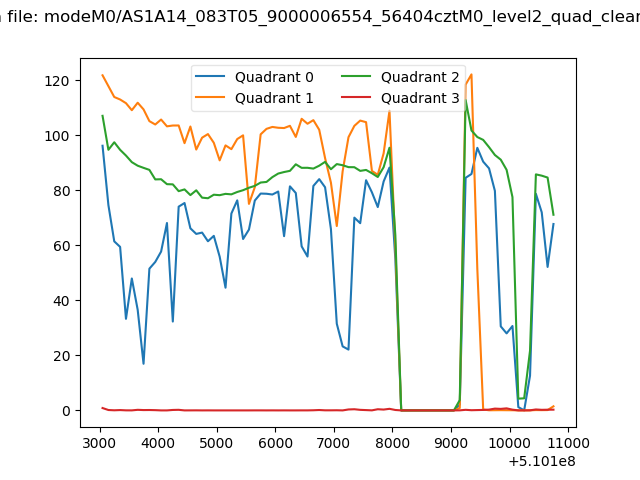 |
|
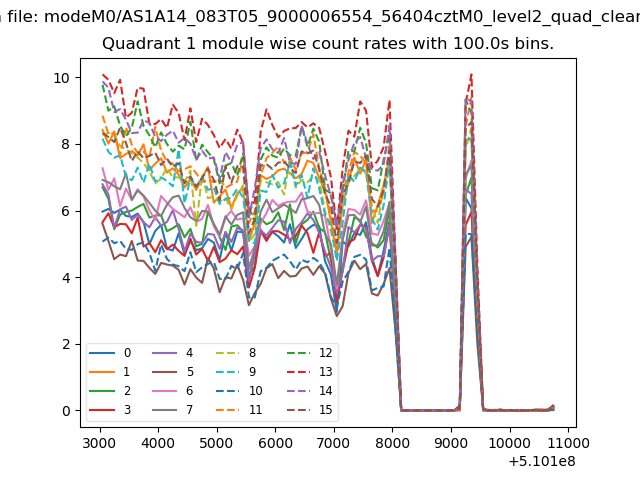
| Module-wise count rates for Quadrant A Data is divided into 100 sec bins |
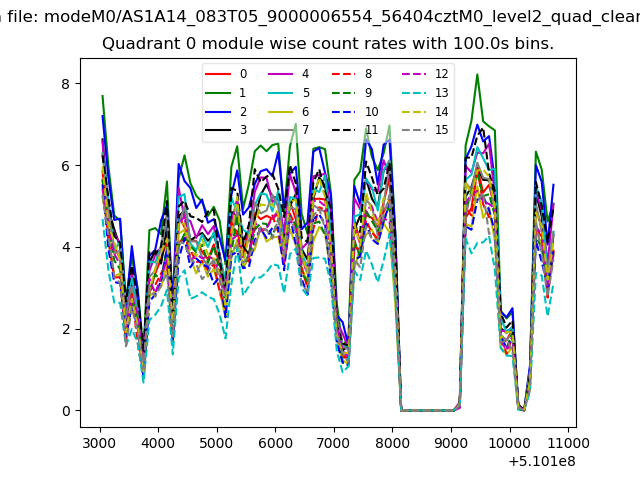 |
 |
| Module-wise count rates for Quadrant B Data is divided into 100 sec bins |
 |
 |
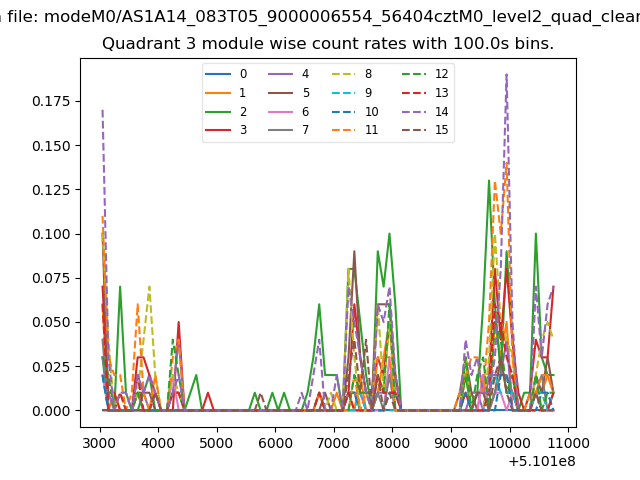
| Module-wise count rates for Quadrant C Data is divided into 100 sec bins |
 |
 |
| Module-wise count rates for Quadrant D Data is divided into 100 sec bins |
 |
 |
| Parameter | Plot |
|---|---|
| CZT HV Monitor |  |
| D_VDD | 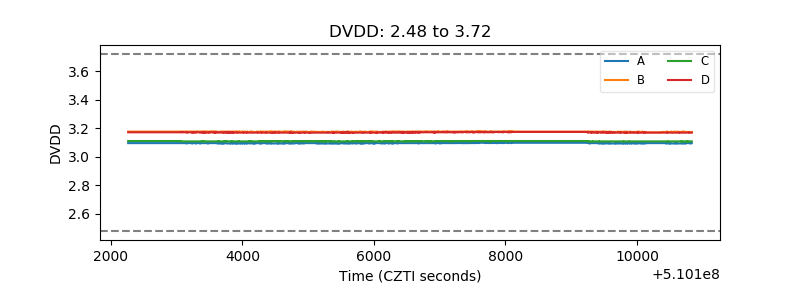 |
| Temperature 1 | 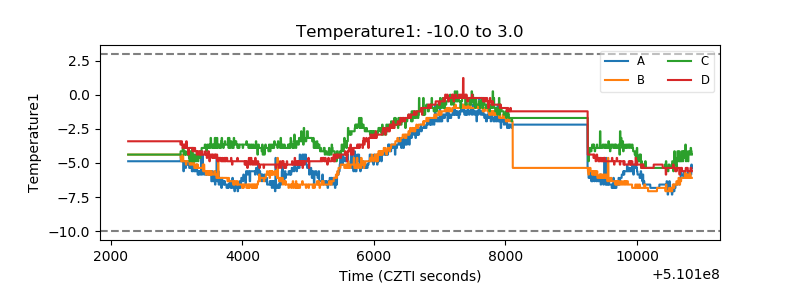 |
| Veto HV Monitor | 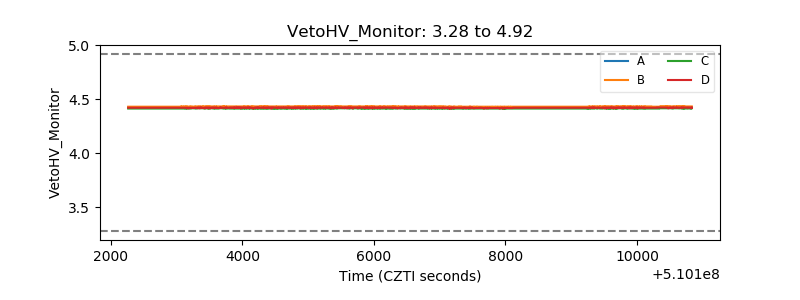 |
| Veto LLD | 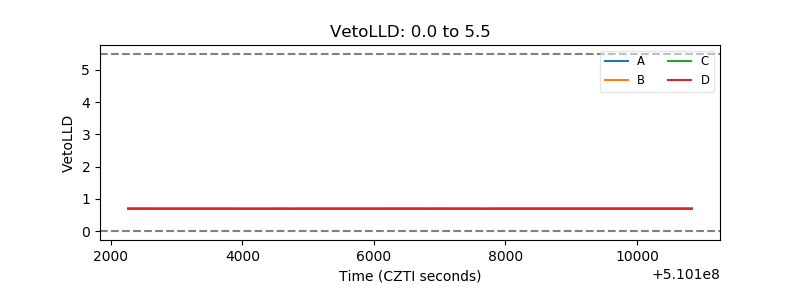 |
| Alpha Counter |  |
| _CPM_Rate | 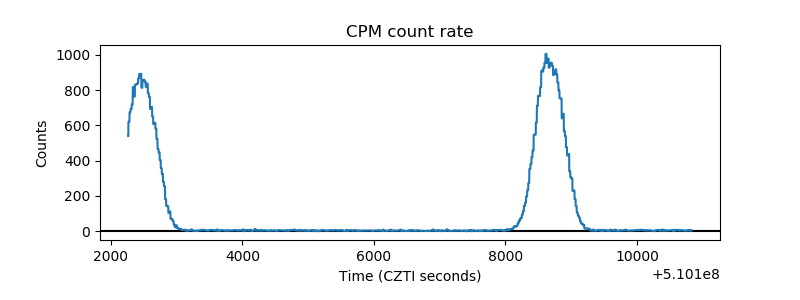 |
| CZT Counter | 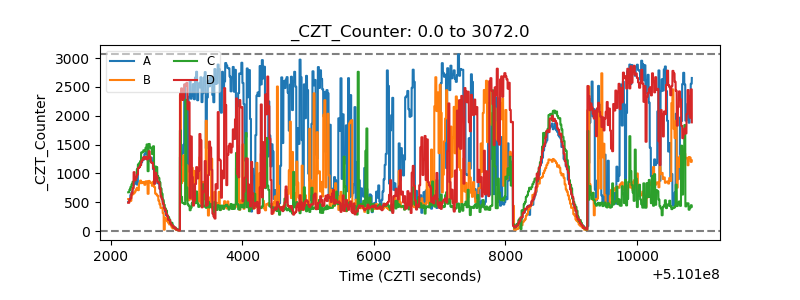 |
| +2.5 Volts monitor | 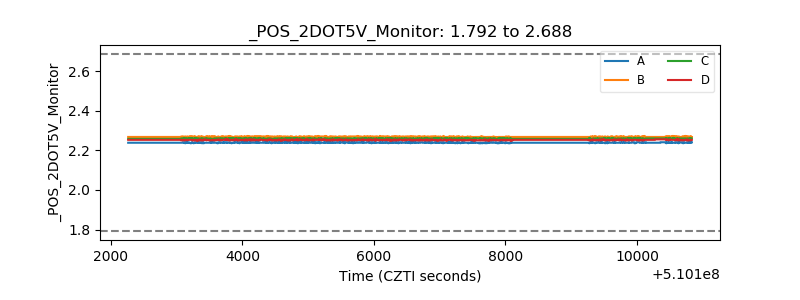 |
| +5 Volts monitor |  |
| _ROLL_ROT | 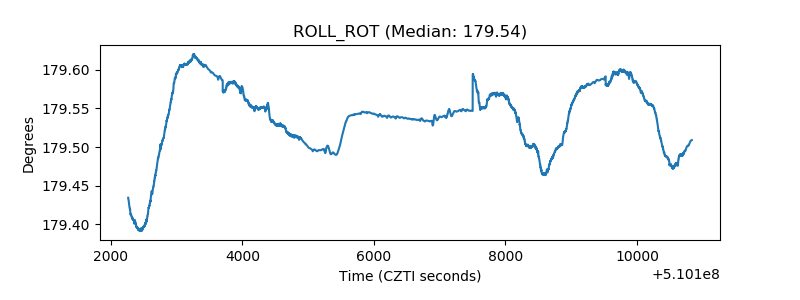 |
| _Roll_DEC | 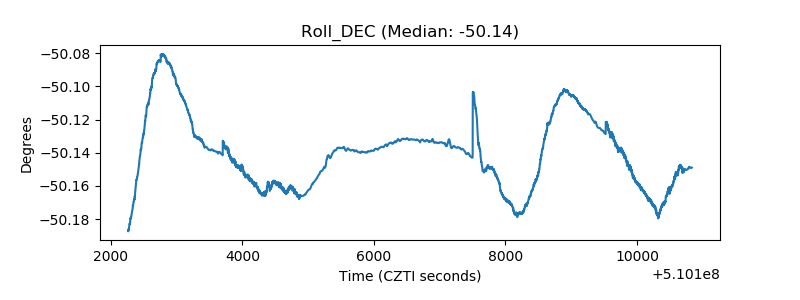 |
| _Roll_RA |  |
| Veto Counter | 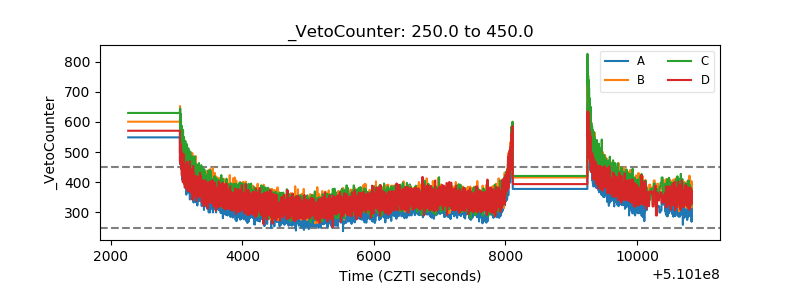 |