| Param | Original file | Final file |
|---|---|---|
| Filename | modeM0/AS1A14_083T05_9000006554_56405cztM0_level2.fits | modeM0/AS1A14_083T05_9000006554_56405cztM0_level2_quad_clean.evt |
| Size (bytes) | 842,365,440 | 56,119,680 |
| Size | 803.3 MB | 53.5 MB |
| Events in quadrant A | 12,577,237 | 303,369 |
| Events in quadrant B | 5,190,922 | 466,816 |
| Events in quadrant C | 3,667,567 | 502,381 |
| Events in quadrant D | 9,277,018 | 1,073 |
| Mode M9 | |||
|---|---|---|---|
| Quadrant | BADHDUFLAG | Total packets | Discarded packets |
| A | 0 | 11 | 0 |
| B | 0 | 11 | 0 |
| C | 0 | 11 | 0 |
| D | 0 | 11 | 0 |
| Mode SS | |||
|---|---|---|---|
| Quadrant | BADHDUFLAG | Total packets | Discarded packets |
| A | 0 | 122 | 0 |
| B | 0 | 122 | 0 |
| C | 0 | 122 | 0 |
| D | 0 | 122 | 0 |
| Mode M0 | |||
|---|---|---|---|
| Quadrant | BADHDUFLAG | Total packets | Discarded packets |
| A | 0 | 41447 | 0 |
| B | 0 | 19564 | 0 |
| C | 0 | 15129 | 0 |
| D | 0 | 31768 | 0 |
| Quadrant | Total seconds | Saturated seconds | Saturation percentage |
|---|---|---|---|
| A | 6013 | 4174 | 69.416265% |
| B | 6013 | 1784 | 29.669050% |
| C | 6014 | 157 | 2.610575% |
| D | 6014 | 6014 | 100.000000% |
Noise dominated data is calculated using 1-second bins in cleaned event files. If a bin has >2000 counts, and if more than 50% of those come from <1% of pixels, then it is considered to be noise-dominated and hence unusable.
| Quadrant | # 1 sec bins | Bins with >0 counts | Bins with >2000 counts | High rate bins dominated by noise | Noise dominated (total time) | Noise dominated (detector-on time) | Marked lightcurve |
|---|---|---|---|---|---|---|---|
| A | 7432 | 6169 | 3622 | 3622 | 48.74% | 58.71% |  |
| B | 7432 | 6025 | 373 | 373 | 5.02% | 6.19% |  |
| C | 7433 | 6288 | 118 | 118 | 1.59% | 1.88% |  |
| D | 7432 | 6038 | 1747 | 1747 | 23.51% | 28.93% | 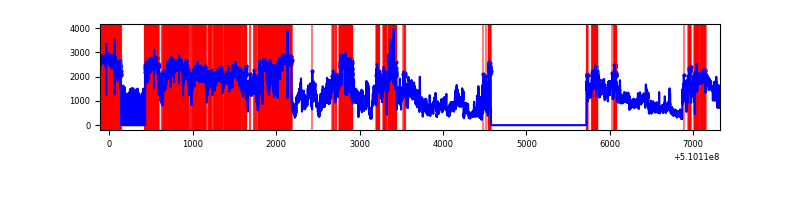 |
Top three noisy pixels from each quadrant. If the there are fewer than three noisy pixels in the level2.evt file, extra rows are filled as -1
| Pixel properties | Quadrant properties | ||||||
|---|---|---|---|---|---|---|---|
| Quadrant | DetID | PixID | Counts | Sigma | Mean | Median | Sigma |
| A | 12 | 3 | 4715178 | 47558.47 | 392 | 381 | 99.1 |
| A | 4 | 95 | 2023539 | 20407.73 | 392 | 381 | 99.1 |
| A | 3 | 79 | 1860901 | 18767.19 | 392 | 381 | 99.1 |
| B | 4 | 206 | 1500521 | 13934.61 | 507 | 490 | 107.6 |
| B | 5 | 172 | 1282358 | 11907.98 | 507 | 490 | 107.6 |
| B | 0 | 213 | 132303 | 1224.48 | 507 | 490 | 107.6 |
| C | 12 | 254 | 895705 | 5111.69 | 645 | 639 | 175.1 |
| C | 9 | 237 | 91197 | 517.17 | 645 | 639 | 175.1 |
| C | 6 | 223 | 43183 | 242.97 | 645 | 639 | 175.1 |
| D | 8 | 129 | 9177683 | 1276046.72 | 20 | 19 | 7.2 |
| D | 2 | 249 | 5744 | 795.99 | 20 | 19 | 7.2 |
| D | 2 | 120 | 2532 | 349.4 | 20 | 19 | 7.2 |
Histogram calculated using DETX and DETY for each event in the final _common_clean file
| Quadrant A |  |
 |
Quadrant B |
|---|---|---|---|
| Quadrant D | 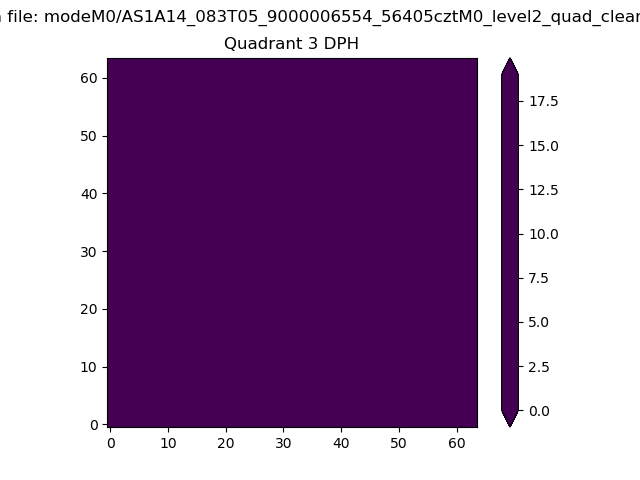 |
 |
Quadrant C |
| Plot type | Count rate plots | Images |
|---|---|---|
| Comparison with Poisson distribution Blue bars denote a histogram of data divided into 1 sec bins. Red curve is a Poisson curve with rate = median count rate of data. |
 |
 |
| Quadrant-wise count rates Data is divided into 100 sec bins |
 |
|
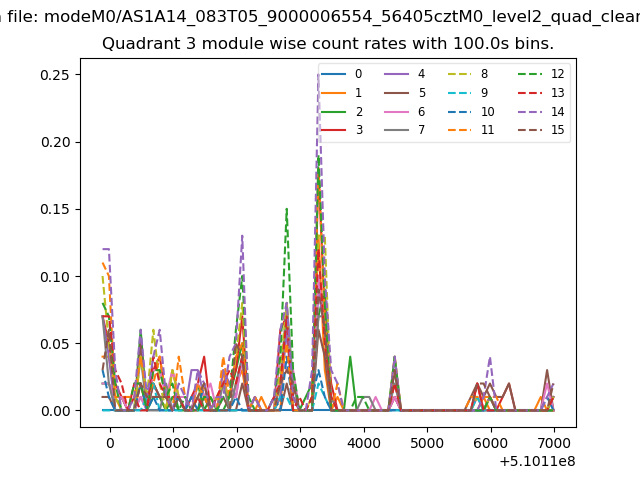
| Module-wise count rates for Quadrant A Data is divided into 100 sec bins |
 |
 |
| Module-wise count rates for Quadrant B Data is divided into 100 sec bins |
 |
 |
| Module-wise count rates for Quadrant C Data is divided into 100 sec bins |
 |
 |
| Module-wise count rates for Quadrant D Data is divided into 100 sec bins |
 |
 |
| Parameter | Plot |
|---|---|
| CZT HV Monitor | 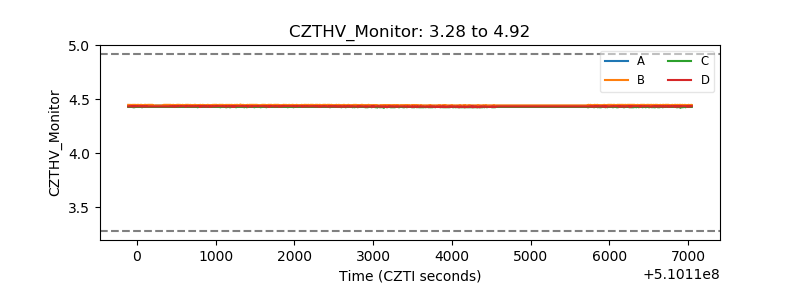 |
| D_VDD |  |
| Temperature 1 | 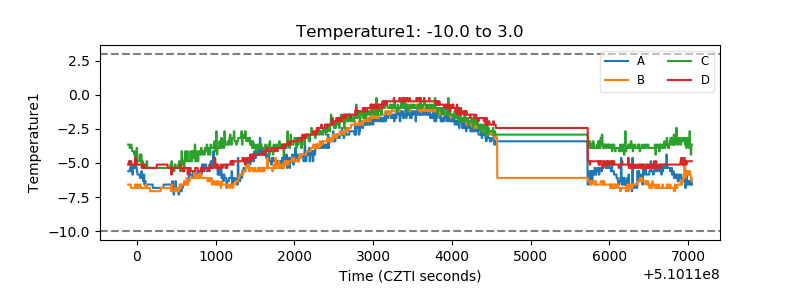 |
| Veto HV Monitor | 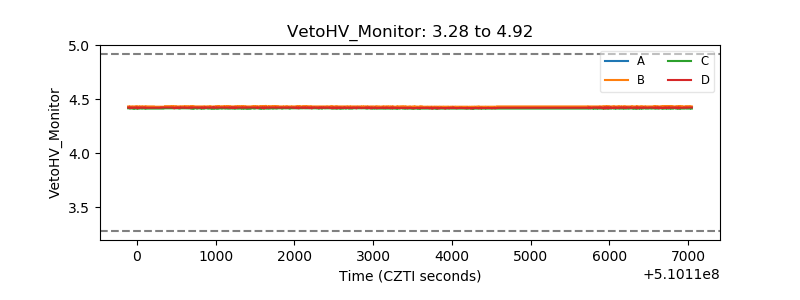 |
| Veto LLD |  |
| Alpha Counter |  |
| _CPM_Rate |  |
| CZT Counter | 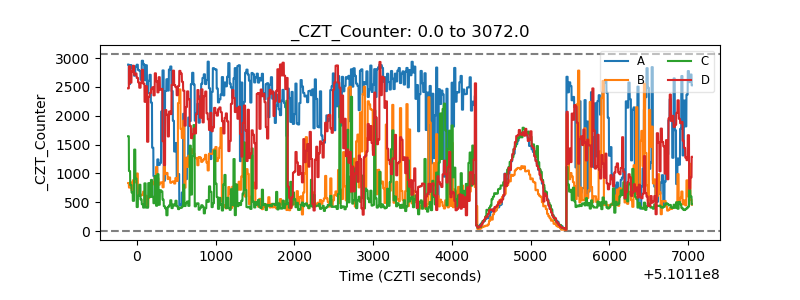 |
| +2.5 Volts monitor | 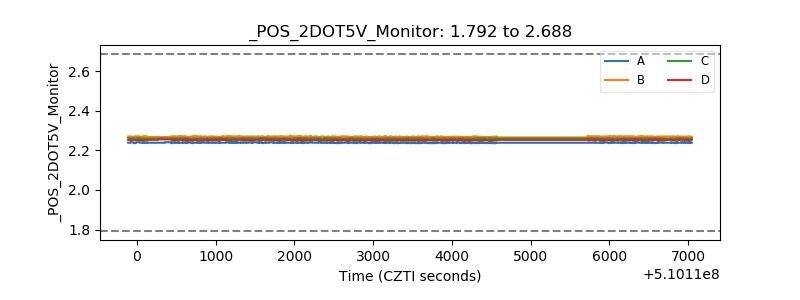 |
| +5 Volts monitor | 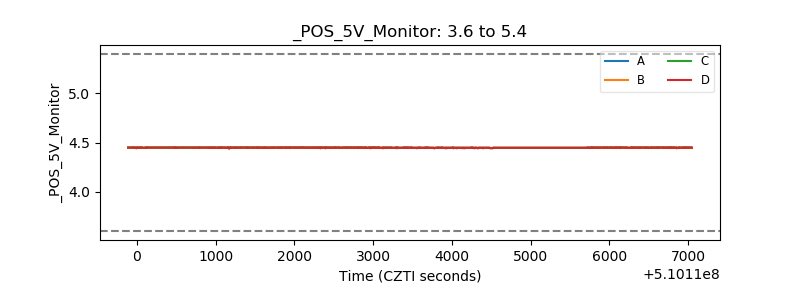 |
| _ROLL_ROT | 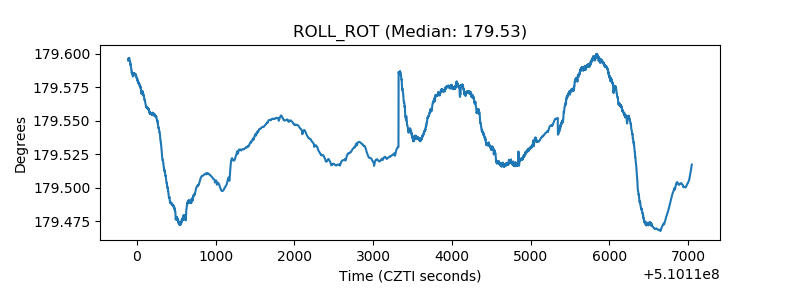 |
| _Roll_DEC | 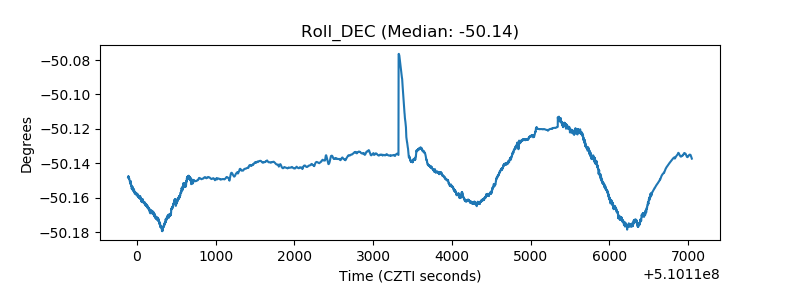 |
| _Roll_RA |  |
| Veto Counter | 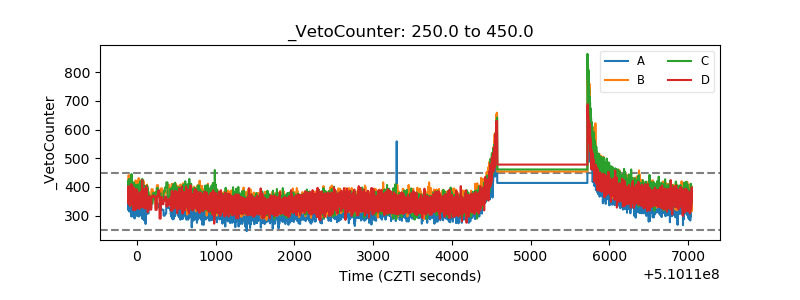 |