| Param | Original file | Final file |
|---|---|---|
| Filename | modeM0/AS1A14_083T05_9000006554_56407cztM0_level2.fits | modeM0/AS1A14_083T05_9000006554_56407cztM0_level2_quad_clean.evt |
| Size (bytes) | 762,877,440 | 86,264,640 |
| Size | 727.5 MB | 82.3 MB |
| Events in quadrant A | 7,776,021 | 538,955 |
| Events in quadrant B | 7,021,702 | 566,166 |
| Events in quadrant C | 4,701,945 | 568,175 |
| Events in quadrant D | 8,213,126 | 464,482 |
| Mode M9 | |||
|---|---|---|---|
| Quadrant | BADHDUFLAG | Total packets | Discarded packets |
| A | 0 | 16 | 0 |
| B | 0 | 16 | 0 |
| C | 0 | 17 | 0 |
| D | 0 | 17 | 0 |
| Mode SS | |||
|---|---|---|---|
| Quadrant | BADHDUFLAG | Total packets | Discarded packets |
| A | 0 | 138 | 0 |
| B | 0 | 138 | 0 |
| C | 0 | 138 | 0 |
| D | 0 | 138 | 0 |
| Mode M0 | |||
|---|---|---|---|
| Quadrant | BADHDUFLAG | Total packets | Discarded packets |
| A | 0 | 27780 | 2 |
| B | 0 | 25500 | 2 |
| C | 0 | 18981 | 2 |
| D | 0 | 29055 | 3 |
| Quadrant | Total seconds | Saturated seconds | Saturation percentage |
|---|---|---|---|
| A | 6797 | 1421 | 20.906282% |
| B | 6797 | 1621 | 23.848757% |
| C | 6797 | 783 | 11.519788% |
| D | 6796 | 1545 | 22.733961% |
Noise dominated data is calculated using 1-second bins in cleaned event files. If a bin has >2000 counts, and if more than 50% of those come from <1% of pixels, then it is considered to be noise-dominated and hence unusable.
| Quadrant | # 1 sec bins | Bins with >0 counts | Bins with >2000 counts | High rate bins dominated by noise | Noise dominated (total time) | Noise dominated (detector-on time) | Marked lightcurve |
|---|---|---|---|---|---|---|---|
| A | 7692 | 6798 | 1187 | 1187 | 15.43% | 17.46% |  |
| B | 7692 | 6798 | 839 | 839 | 10.91% | 12.34% |  |
| C | 7692 | 6798 | 358 | 358 | 4.65% | 5.27% |  |
| D | 7691 | 6797 | 1333 | 1333 | 17.33% | 19.61% | 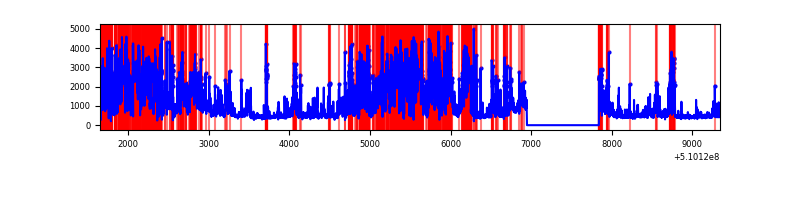 |
Top three noisy pixels from each quadrant. If the there are fewer than three noisy pixels in the level2.evt file, extra rows are filled as -1
| Pixel properties | Quadrant properties | ||||||
|---|---|---|---|---|---|---|---|
| Quadrant | DetID | PixID | Counts | Sigma | Mean | Median | Sigma |
| A | 4 | 95 | 2554472 | 15008.61 | 694 | 677 | 170.2 |
| A | 12 | 3 | 1320200 | 7754.81 | 694 | 677 | 170.2 |
| A | 0 | 8 | 536689 | 3150.13 | 694 | 677 | 170.2 |
| B | 4 | 206 | 3746461 | 26403.42 | 672 | 647 | 141.9 |
| B | 5 | 172 | 224115 | 1575.18 | 672 | 647 | 141.9 |
| B | 4 | 171 | 91606 | 641.15 | 672 | 647 | 141.9 |
| C | 5 | 250 | 1142908 | 5902.09 | 709 | 702 | 193.5 |
| C | 5 | 233 | 234150 | 1206.29 | 709 | 702 | 193.5 |
| C | 15 | 198 | 201820 | 1039.23 | 709 | 702 | 193.5 |
| D | 8 | 129 | 4129487 | 22523.99 | 650 | 618 | 183.3 |
| D | 8 | 160 | 709680 | 3868.11 | 650 | 618 | 183.3 |
| D | 2 | 249 | 534590 | 2912.95 | 650 | 618 | 183.3 |
Histogram calculated using DETX and DETY for each event in the final _common_clean file
| Quadrant A |  |
 |
Quadrant B |
|---|---|---|---|
| Quadrant D | 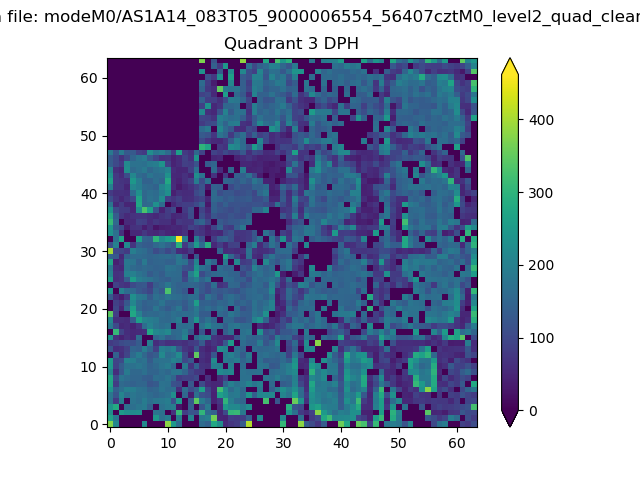 |
 |
Quadrant C |
| Plot type | Count rate plots | Images |
|---|---|---|
| Comparison with Poisson distribution Blue bars denote a histogram of data divided into 1 sec bins. Red curve is a Poisson curve with rate = median count rate of data. |
 |
 |
| Quadrant-wise count rates Data is divided into 100 sec bins |
 |
|
| Module-wise count rates for Quadrant A Data is divided into 100 sec bins |
 |
 |
| Module-wise count rates for Quadrant B Data is divided into 100 sec bins |
 |
 |
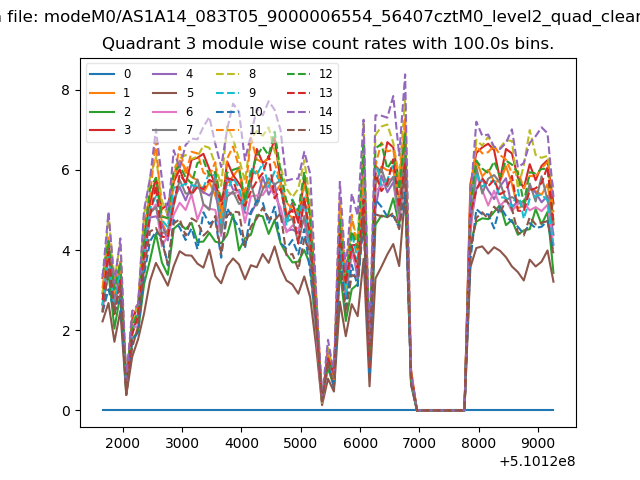
| Module-wise count rates for Quadrant C Data is divided into 100 sec bins |
 |
 |
| Module-wise count rates for Quadrant D Data is divided into 100 sec bins |
 |
 |
| Parameter | Plot |
|---|---|
| CZT HV Monitor |  |
| D_VDD |  |
| Temperature 1 | 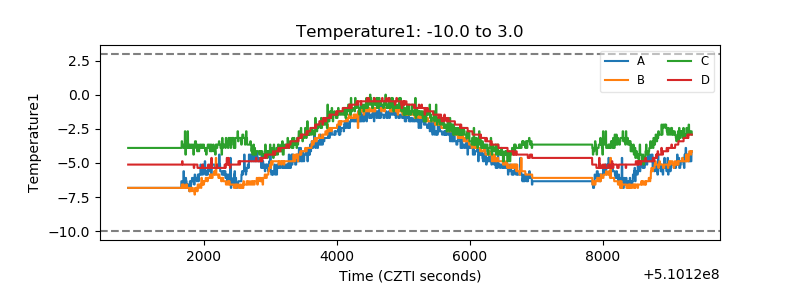 |
| Veto HV Monitor | 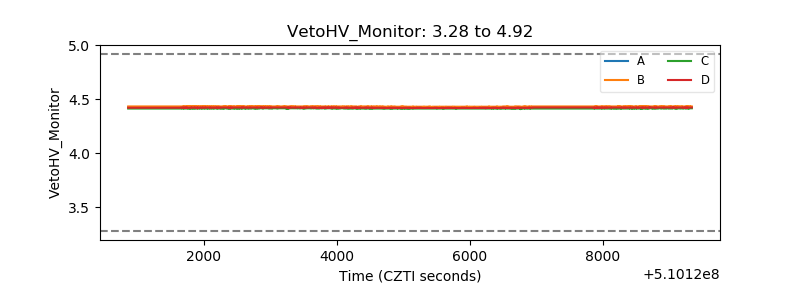 |
| Veto LLD |  |
| Alpha Counter |  |
| _CPM_Rate | 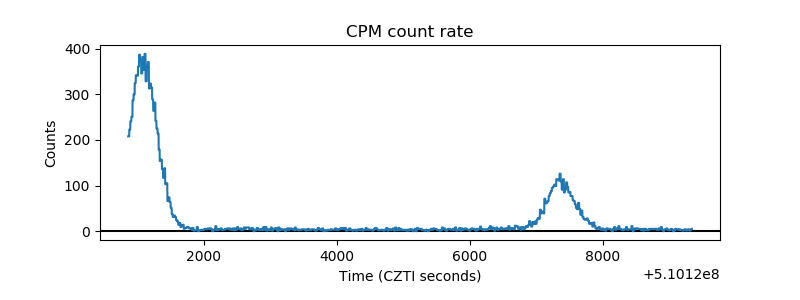 |
| CZT Counter | 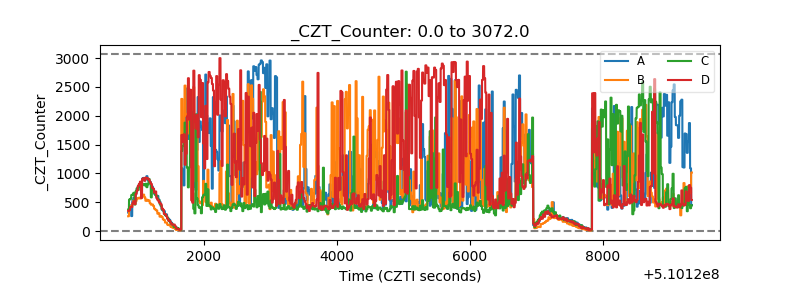 |
| +2.5 Volts monitor | 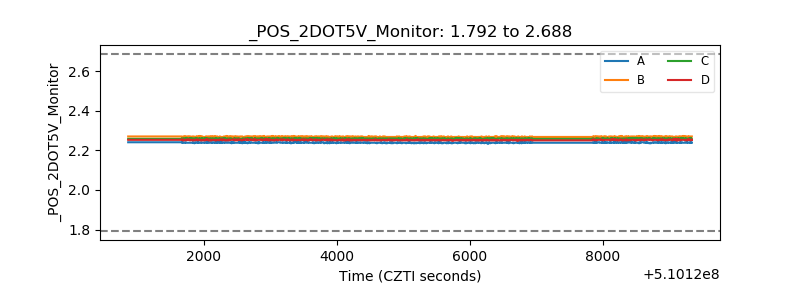 |
| +5 Volts monitor | 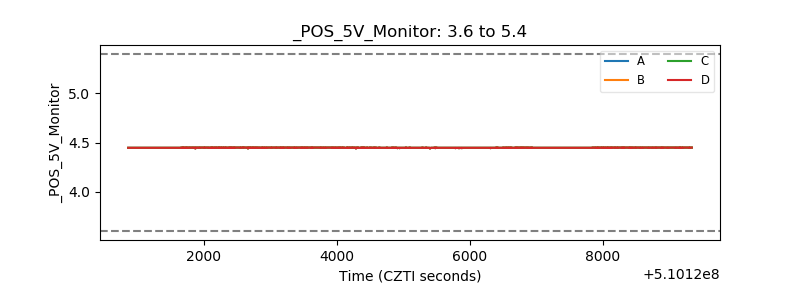 |
| _ROLL_ROT | 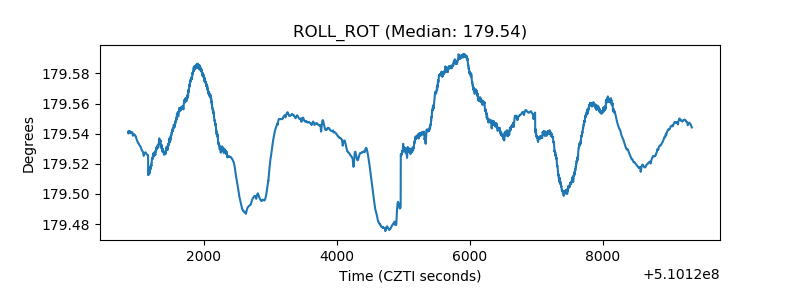 |
| _Roll_DEC | 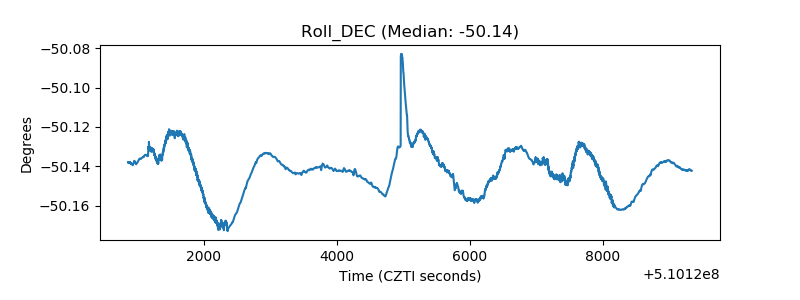 |
| _Roll_RA |  |
| Veto Counter | 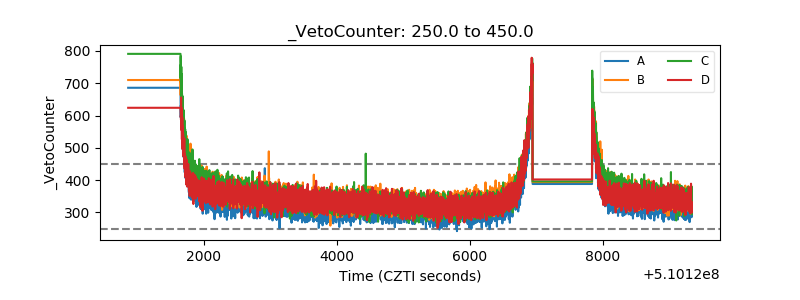 |