| Param | Original file | Final file |
|---|---|---|
| Filename | modeM0/AS1A14_083T05_9000006554_56408cztM0_level2.fits | modeM0/AS1A14_083T05_9000006554_56408cztM0_level2_quad_clean.evt |
| Size (bytes) | 832,875,840 | 76,020,480 |
| Size | 794.3 MB | 72.5 MB |
| Events in quadrant A | 9,941,574 | 484,674 |
| Events in quadrant B | 6,119,012 | 582,575 |
| Events in quadrant C | 4,790,620 | 575,303 |
| Events in quadrant D | 9,447,327 | 181,960 |
| Mode M9 | |||
|---|---|---|---|
| Quadrant | BADHDUFLAG | Total packets | Discarded packets |
| A | 0 | 5 | 0 |
| B | 0 | 5 | 0 |
| C | 0 | 5 | 0 |
| D | 0 | 5 | 0 |
| Mode SS | |||
|---|---|---|---|
| Quadrant | BADHDUFLAG | Total packets | Discarded packets |
| A | 0 | 140 | 0 |
| B | 0 | 140 | 0 |
| C | 0 | 140 | 0 |
| D | 0 | 140 | 0 |
| Mode M0 | |||
|---|---|---|---|
| Quadrant | BADHDUFLAG | Total packets | Discarded packets |
| A | 0 | 34255 | 6 |
| B | 0 | 22861 | 1 |
| C | 0 | 19208 | 1 |
| D | 0 | 32896 | 1 |
| Quadrant | Total seconds | Saturated seconds | Saturation percentage |
|---|---|---|---|
| A | 6840 | 2032 | 29.707602% |
| B | 6840 | 1316 | 19.239766% |
| C | 6841 | 661 | 9.662330% |
| D | 6841 | 4774 | 69.785119% |
Noise dominated data is calculated using 1-second bins in cleaned event files. If a bin has >2000 counts, and if more than 50% of those come from <1% of pixels, then it is considered to be noise-dominated and hence unusable.
| Quadrant | # 1 sec bins | Bins with >0 counts | Bins with >2000 counts | High rate bins dominated by noise | Noise dominated (total time) | Noise dominated (detector-on time) | Marked lightcurve |
|---|---|---|---|---|---|---|---|
| A | 7375 | 6841 | 1772 | 1772 | 24.03% | 25.90% | 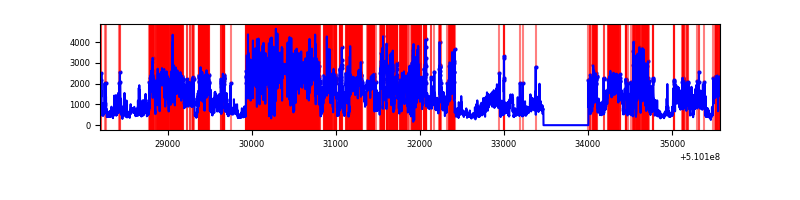 |
| B | 7375 | 6841 | 738 | 738 | 10.01% | 10.79% |  |
| C | 7376 | 6842 | 394 | 394 | 5.34% | 5.76% |  |
| D | 7375 | 6840 | 2036 | 2036 | 27.61% | 29.77% |  |
Top three noisy pixels from each quadrant. If the there are fewer than three noisy pixels in the level2.evt file, extra rows are filled as -1
| Pixel properties | Quadrant properties | ||||||
|---|---|---|---|---|---|---|---|
| Quadrant | DetID | PixID | Counts | Sigma | Mean | Median | Sigma |
| A | 4 | 95 | 3971031 | 24238.48 | 661 | 646 | 163.8 |
| A | 12 | 3 | 2312894 | 14115.85 | 661 | 646 | 163.8 |
| A | 3 | 14 | 380133 | 2316.7 | 661 | 646 | 163.8 |
| B | 4 | 206 | 2766760 | 19009.11 | 682 | 658 | 145.5 |
| B | 0 | 213 | 128222 | 876.64 | 682 | 658 | 145.5 |
| B | 4 | 171 | 127721 | 873.2 | 682 | 658 | 145.5 |
| C | 5 | 250 | 860146 | 4468.06 | 703 | 698 | 192.4 |
| C | 12 | 254 | 353612 | 1834.71 | 703 | 698 | 192.4 |
| C | 6 | 223 | 315130 | 1634.65 | 703 | 698 | 192.4 |
| D | 8 | 129 | 7674634 | 94585.32 | 277 | 262 | 81.1 |
| D | 2 | 249 | 190685 | 2346.93 | 277 | 262 | 81.1 |
| D | 8 | 160 | 188244 | 2316.85 | 277 | 262 | 81.1 |
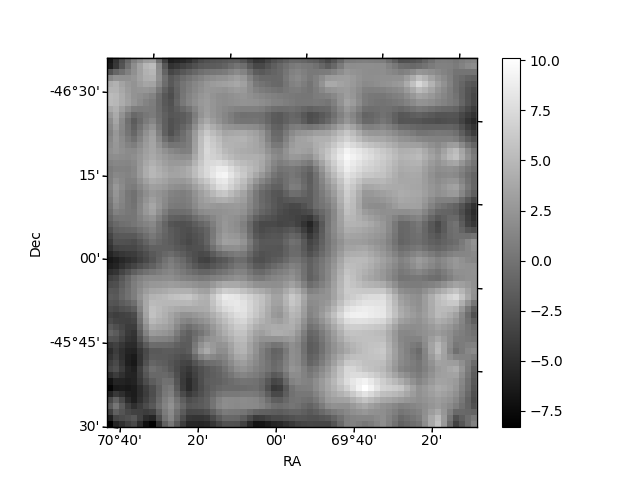
Histogram calculated using DETX and DETY for each event in the final _common_clean file
| Quadrant A | 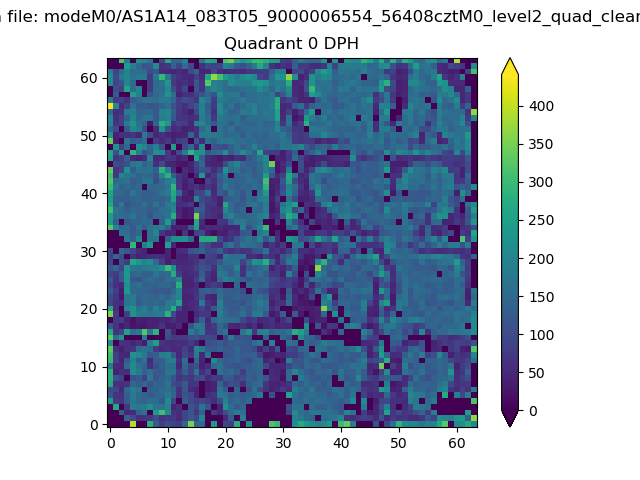 |
 |
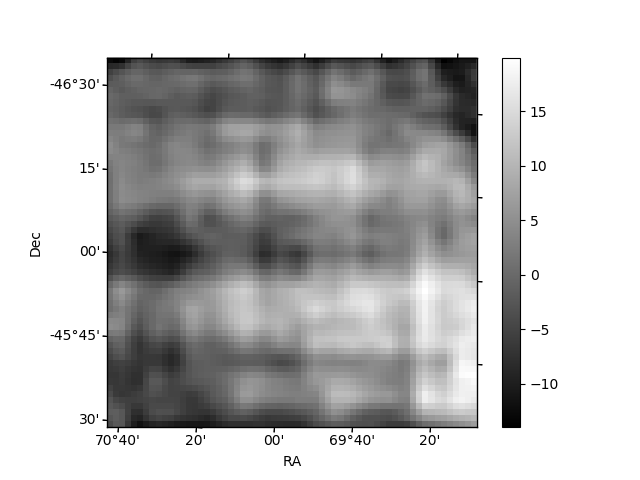
Quadrant B |
|---|---|---|---|
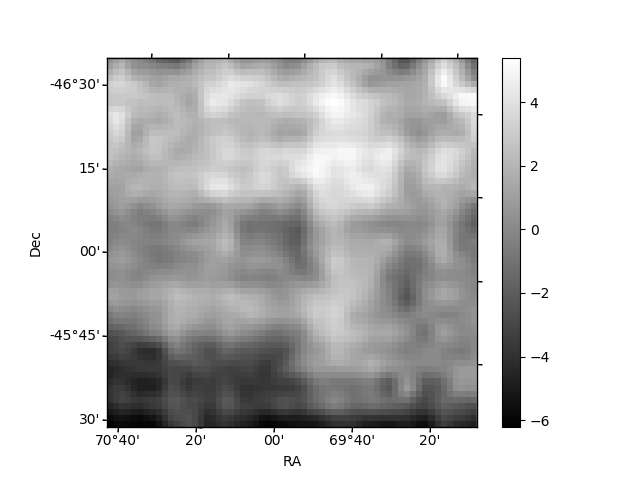
| Quadrant D | 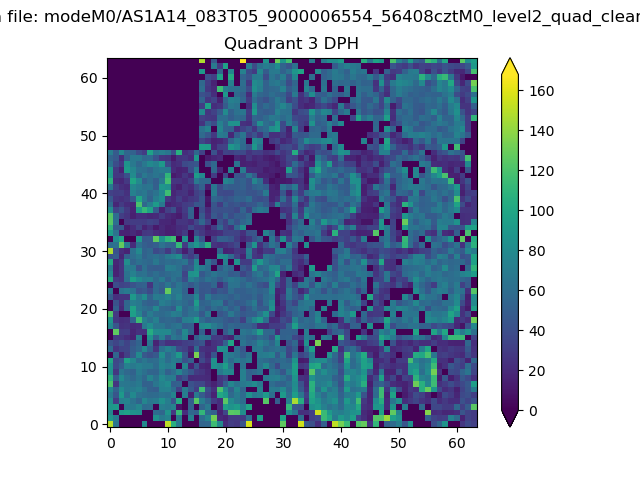 |
 |
Quadrant C |
| Plot type | Count rate plots | Images |
|---|---|---|
| Comparison with Poisson distribution Blue bars denote a histogram of data divided into 1 sec bins. Red curve is a Poisson curve with rate = median count rate of data. |
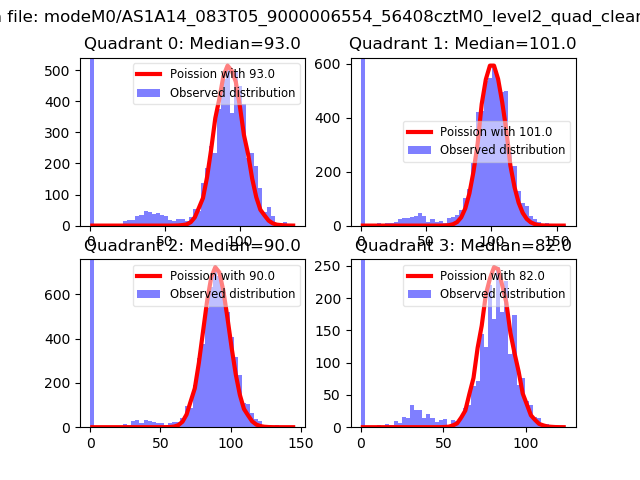 |
 |
| Quadrant-wise count rates Data is divided into 100 sec bins |
 |
|
| Module-wise count rates for Quadrant A Data is divided into 100 sec bins |
 |
 |
| Module-wise count rates for Quadrant B Data is divided into 100 sec bins |
 |
 |
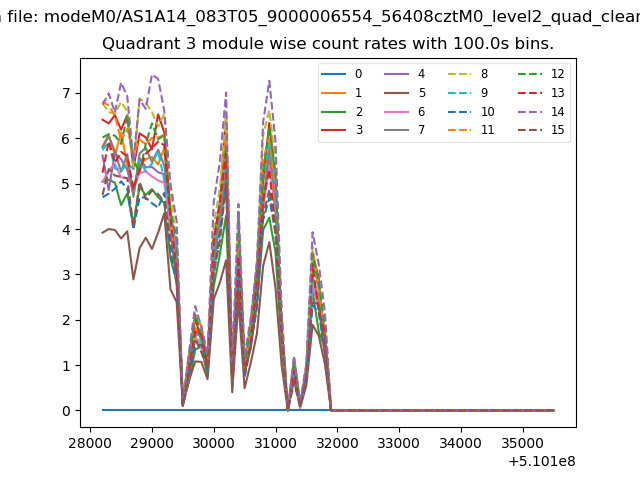
| Module-wise count rates for Quadrant C Data is divided into 100 sec bins |
 |
 |
| Module-wise count rates for Quadrant D Data is divided into 100 sec bins |
 |
 |
| Parameter | Plot |
|---|---|
| CZT HV Monitor | 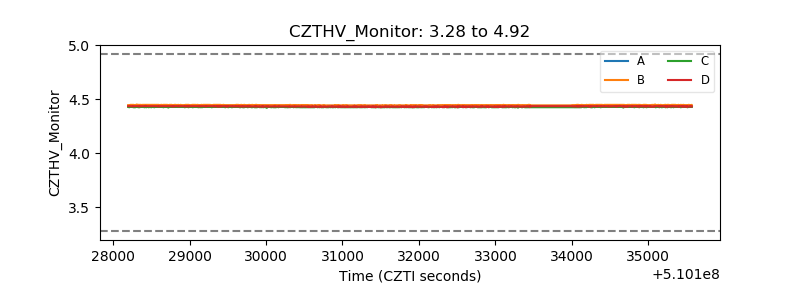 |
| D_VDD |  |
| Temperature 1 | 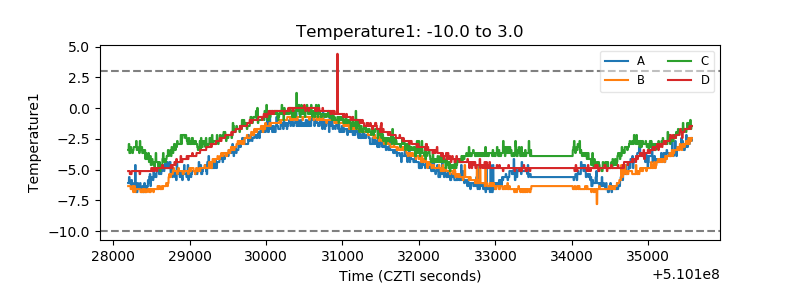 |
| Veto HV Monitor | 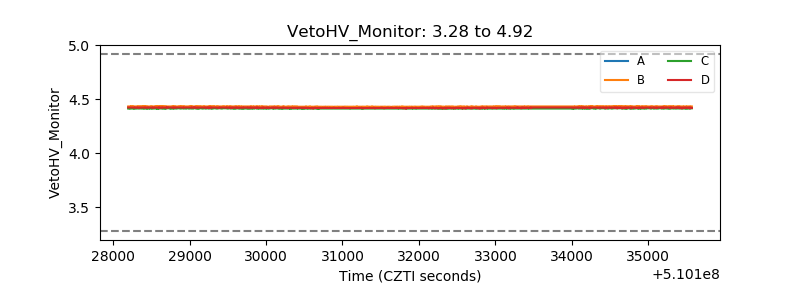 |
| Veto LLD |  |
| Alpha Counter |  |
| _CPM_Rate |  |
| CZT Counter | 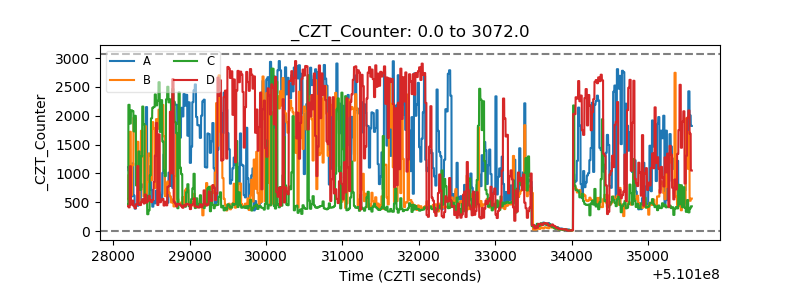 |
| +2.5 Volts monitor | 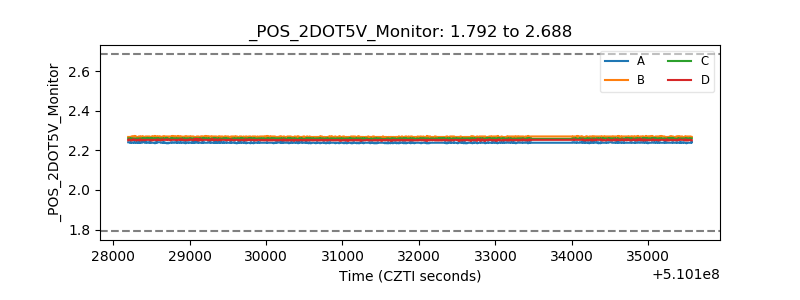 |
| +5 Volts monitor | 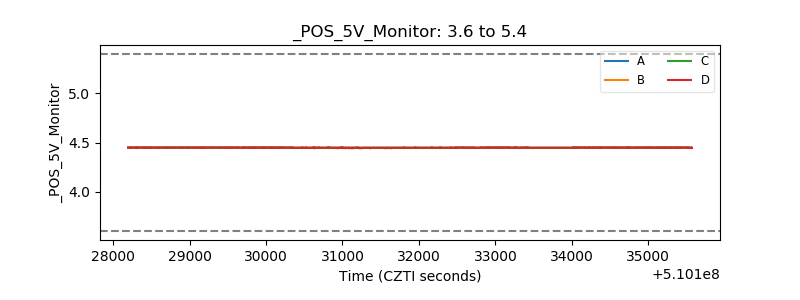 |
| _ROLL_ROT | 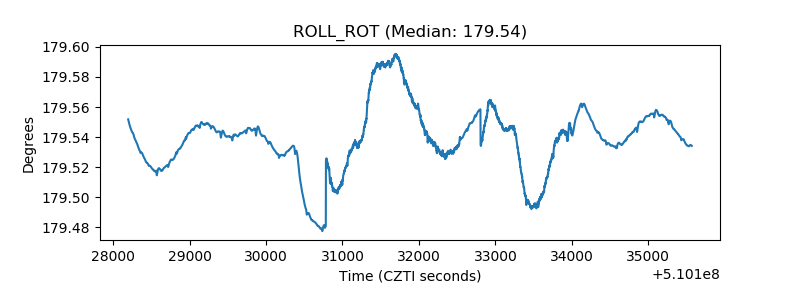 |
| _Roll_DEC | 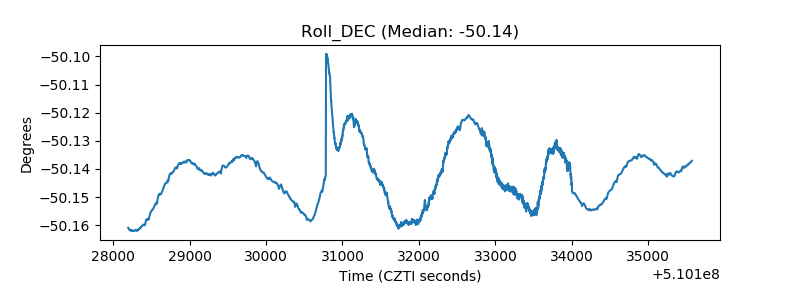 |
| _Roll_RA |  |
| Veto Counter | 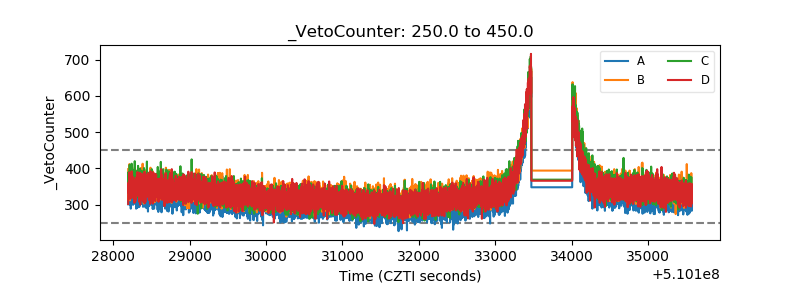 |