| Param | Original file | Final file |
|---|---|---|
| Filename | modeM0/AS1A14_083T05_9000006554_56409cztM0_level2.fits | modeM0/AS1A14_083T05_9000006554_56409cztM0_level2_quad_clean.evt |
| Size (bytes) | 1,008,074,880 | 85,239,360 |
| Size | 961.4 MB | 81.3 MB |
| Events in quadrant A | 11,702,997 | 537,105 |
| Events in quadrant B | 5,912,187 | 732,092 |
| Events in quadrant C | 4,301,945 | 709,709 |
| Events in quadrant D | 14,786,242 | 53,408 |
| Mode M9 | |||
|---|---|---|---|
| Quadrant | BADHDUFLAG | Total packets | Discarded packets |
| A | 0 | 4 | 0 |
| B | 0 | 5 | 0 |
| C | 0 | 5 | 0 |
| D | 0 | 5 | 0 |
| Mode SS | |||
|---|---|---|---|
| Quadrant | BADHDUFLAG | Total packets | Discarded packets |
| A | 0 | 158 | 0 |
| B | 0 | 160 | 0 |
| C | 0 | 160 | 0 |
| D | 0 | 160 | 0 |
| Mode M0 | |||
|---|---|---|---|
| Quadrant | BADHDUFLAG | Total packets | Discarded packets |
| A | 0 | 40229 | 1 |
| B | 0 | 23023 | 1 |
| C | 0 | 18573 | 1 |
| D | 0 | 49425 | 1 |
| Quadrant | Total seconds | Saturated seconds | Saturation percentage |
|---|---|---|---|
| A | 7885 | 2584 | 32.771084% |
| B | 7885 | 972 | 12.327204% |
| C | 7885 | 180 | 2.282815% |
| D | 7885 | 7310 | 92.707673% |
Noise dominated data is calculated using 1-second bins in cleaned event files. If a bin has >2000 counts, and if more than 50% of those come from <1% of pixels, then it is considered to be noise-dominated and hence unusable.
| Quadrant | # 1 sec bins | Bins with >0 counts | Bins with >2000 counts | High rate bins dominated by noise | Noise dominated (total time) | Noise dominated (detector-on time) | Marked lightcurve |
|---|---|---|---|---|---|---|---|
| A | 7885 | 7885 | 2139 | 2139 | 27.13% | 27.13% |  |
| B | 7885 | 7885 | 573 | 573 | 7.27% | 7.27% | 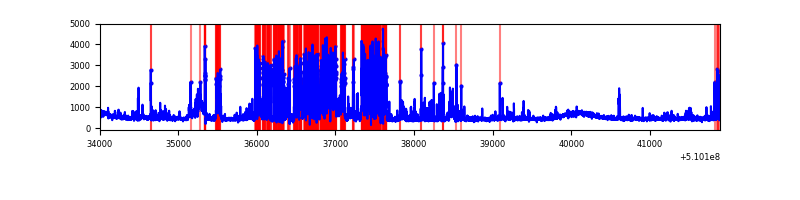 |
| C | 7885 | 7885 | 126 | 126 | 1.60% | 1.60% |  |
| D | 7885 | 7885 | 4230 | 4230 | 53.65% | 53.65% |  |
Top three noisy pixels from each quadrant. If the there are fewer than three noisy pixels in the level2.evt file, extra rows are filled as -1
| Pixel properties | Quadrant properties | ||||||
|---|---|---|---|---|---|---|---|
| Quadrant | DetID | PixID | Counts | Sigma | Mean | Median | Sigma |
| A | 12 | 3 | 4447136 | 23789.21 | 755 | 733 | 186.9 |
| A | 4 | 95 | 3188628 | 17055.92 | 755 | 733 | 186.9 |
| A | 12 | 194 | 588118 | 3142.64 | 755 | 733 | 186.9 |
| B | 4 | 206 | 2139952 | 12076.68 | 827 | 794 | 177.1 |
| B | 0 | 213 | 137680 | 772.79 | 827 | 794 | 177.1 |
| B | 5 | 172 | 73367 | 409.71 | 827 | 794 | 177.1 |
| C | 12 | 254 | 609432 | 2651.65 | 843 | 836 | 229.5 |
| C | 5 | 250 | 219808 | 954.06 | 843 | 836 | 229.5 |
| C | 12 | 252 | 68529 | 294.94 | 843 | 836 | 229.5 |
| D | 8 | 129 | 13700222 | 281773.51 | 163 | 155 | 48.6 |
| D | 2 | 31 | 116181 | 2386.34 | 163 | 155 | 48.6 |
| D | 5 | 38 | 108800 | 2234.54 | 163 | 155 | 48.6 |
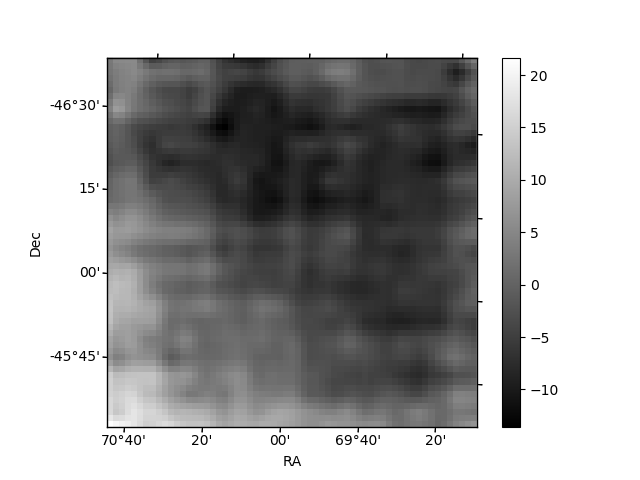
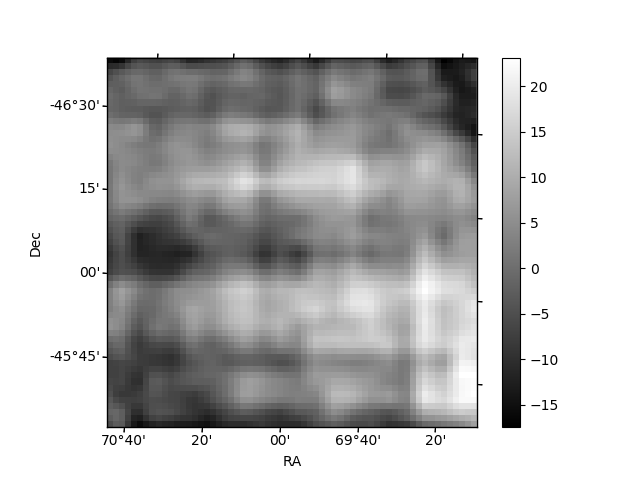
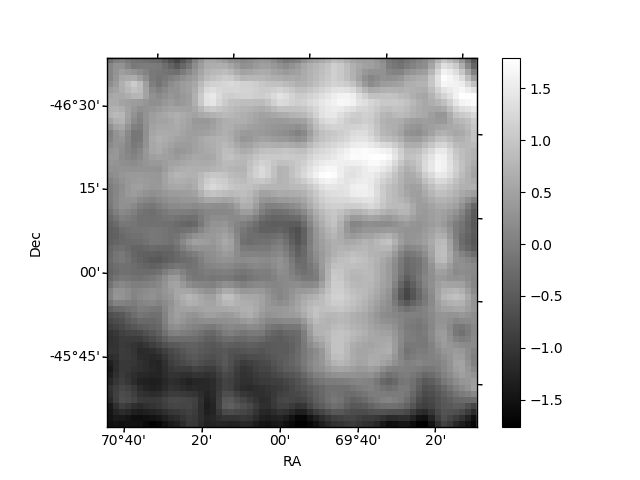
Histogram calculated using DETX and DETY for each event in the final _common_clean file
| Quadrant A | 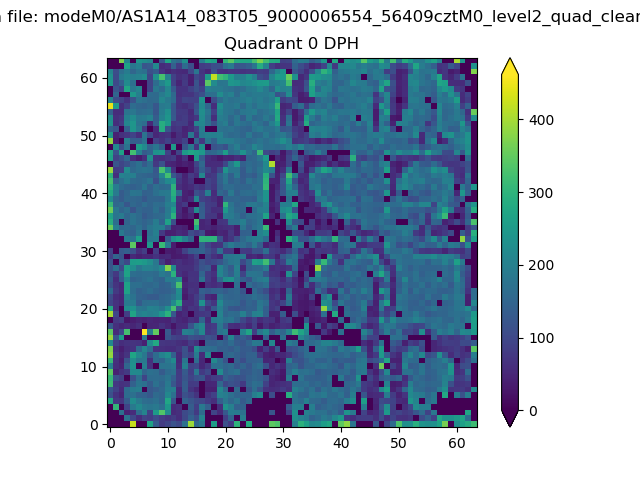 |
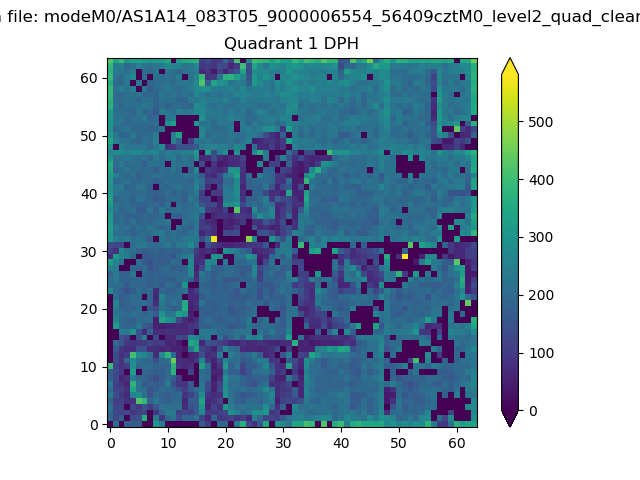 |
Quadrant B |
|---|---|---|---|
| Quadrant D | 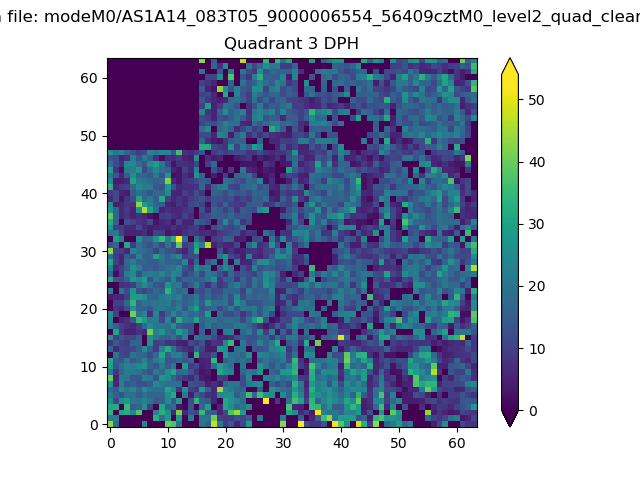 |
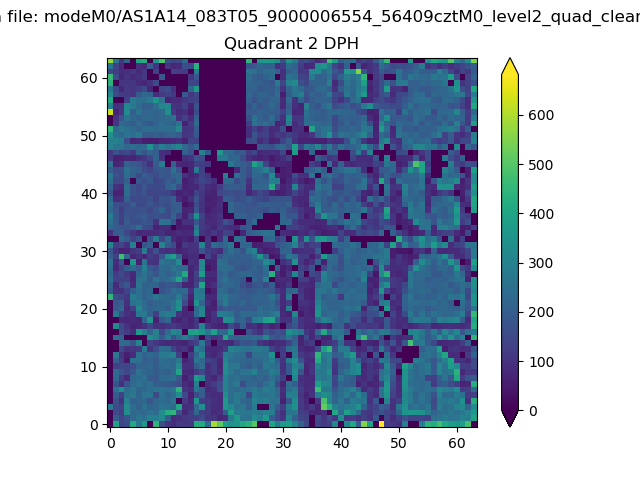 |
Quadrant C |
| Plot type | Count rate plots | Images |
|---|---|---|
| Comparison with Poisson distribution Blue bars denote a histogram of data divided into 1 sec bins. Red curve is a Poisson curve with rate = median count rate of data. |
 |
 |
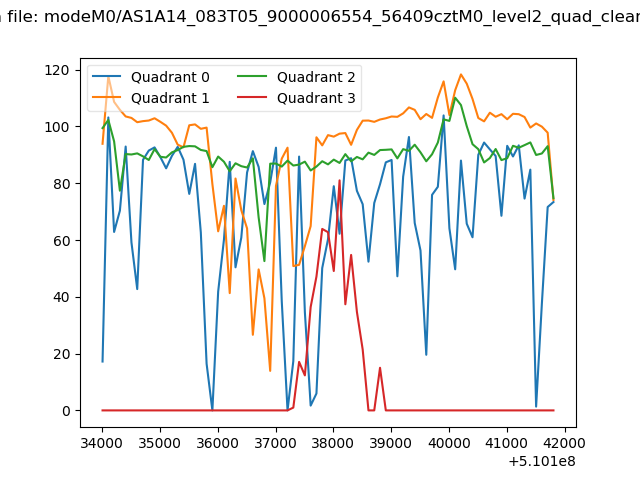
| Quadrant-wise count rates Data is divided into 100 sec bins |
 |
|
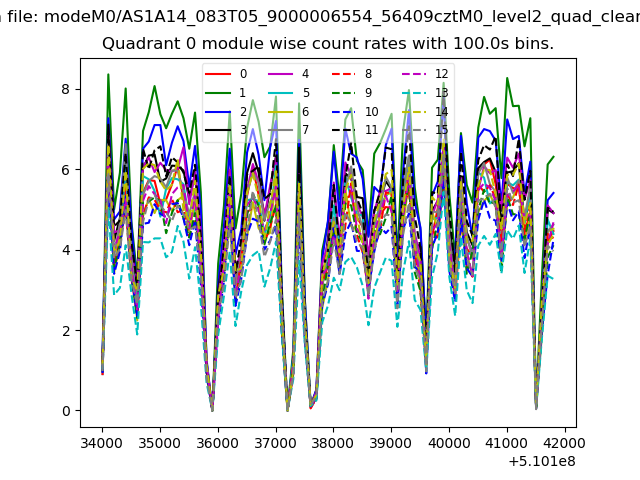
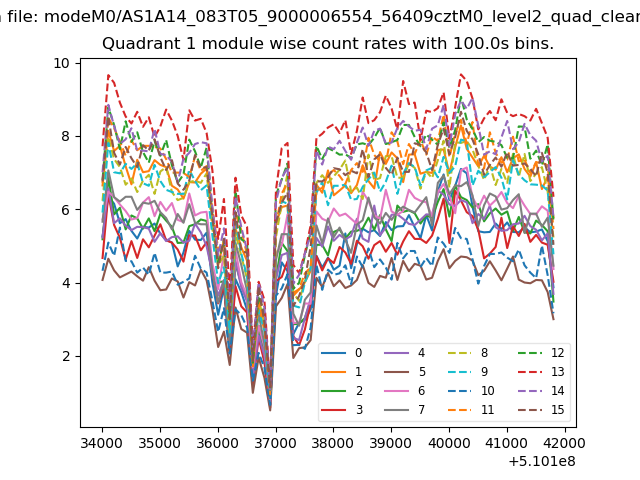
| Module-wise count rates for Quadrant A Data is divided into 100 sec bins |
 |
 |
| Module-wise count rates for Quadrant B Data is divided into 100 sec bins |
 |
 |
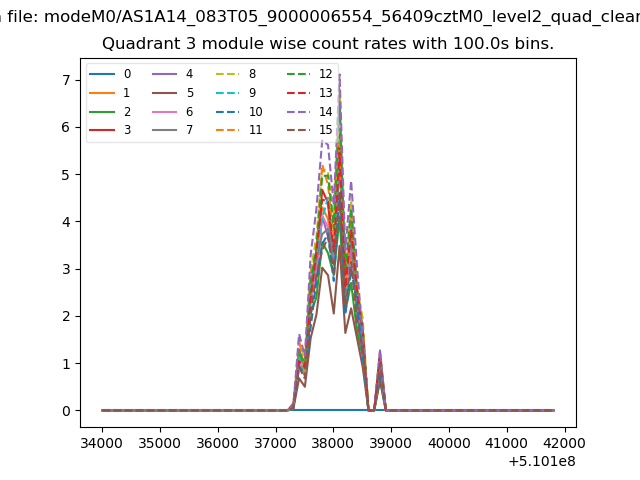
| Module-wise count rates for Quadrant C Data is divided into 100 sec bins |
 |
 |
| Module-wise count rates for Quadrant D Data is divided into 100 sec bins |
 |
 |
| Parameter | Plot |
|---|---|
| CZT HV Monitor |  |
| D_VDD |  |
| Temperature 1 | 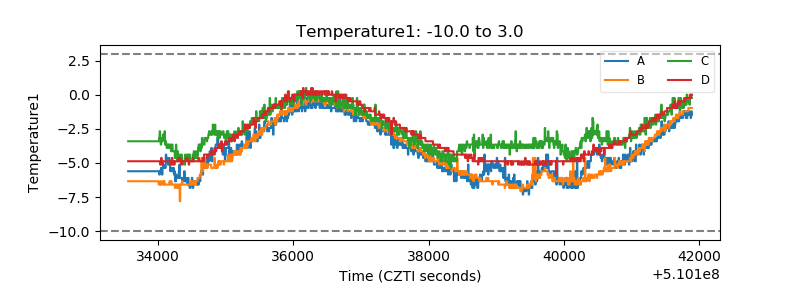 |
| Veto HV Monitor | 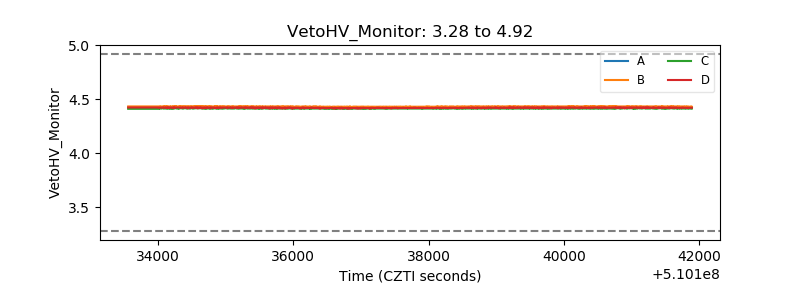 |
| Veto LLD |  |
| Alpha Counter |  |
| _CPM_Rate |  |
| CZT Counter | 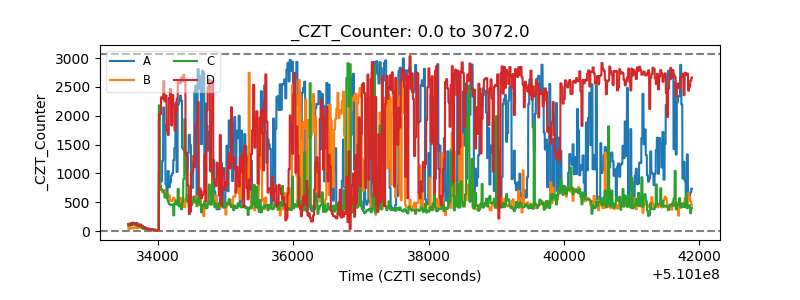 |
| +2.5 Volts monitor | 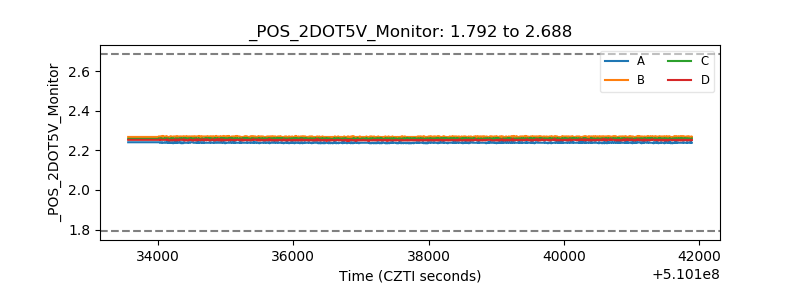 |
| +5 Volts monitor |  |
| _ROLL_ROT | 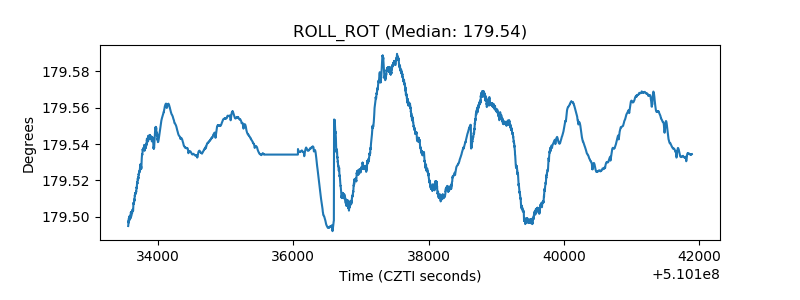 |
| _Roll_DEC | 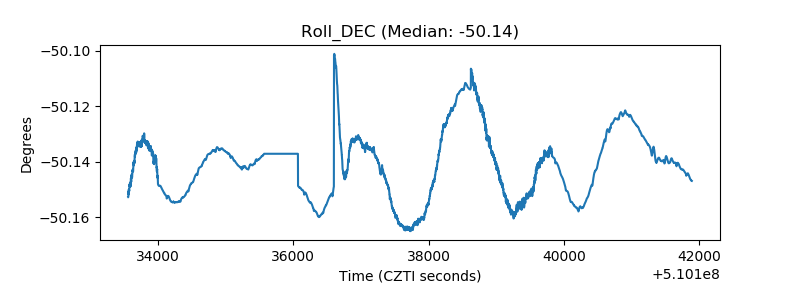 |
| _Roll_RA | 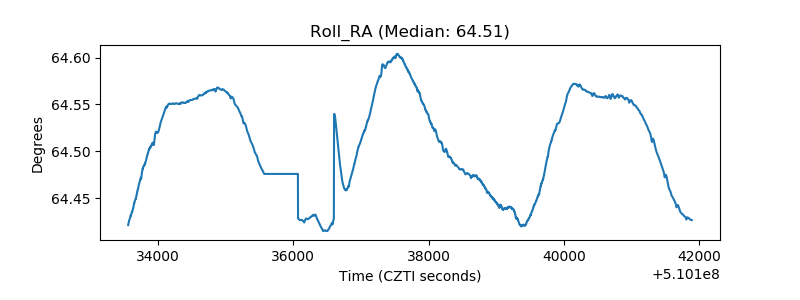 |
| Veto Counter | 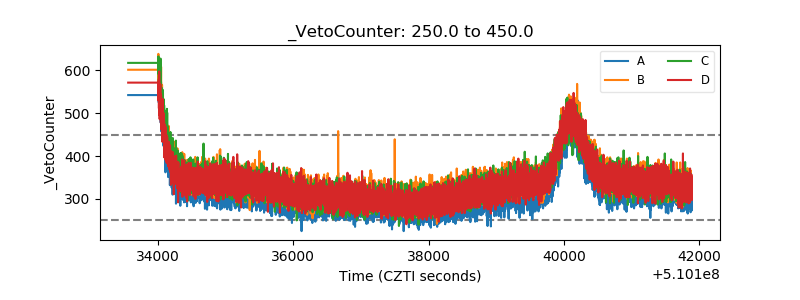 |