| Param | Original file | Final file |
|---|---|---|
| Filename | modeM0/AS1A14_083T05_9000006554_56410cztM0_level2.fits | modeM0/AS1A14_083T05_9000006554_56410cztM0_level2_quad_clean.evt |
| Size (bytes) | 1,201,230,720 | 65,580,480 |
| Size | 1.1 GB | 62.5 MB |
| Events in quadrant A | 11,688,277 | 404,231 |
| Events in quadrant B | 10,873,253 | 384,478 |
| Events in quadrant C | 4,091,038 | 629,459 |
| Events in quadrant D | 17,255,620 | 64,541 |
| Mode SS | |||
|---|---|---|---|
| Quadrant | BADHDUFLAG | Total packets | Discarded packets |
| A | 0 | 144 | 0 |
| B | 0 | 144 | 0 |
| C | 0 | 144 | 0 |
| D | 0 | 144 | 0 |
| Mode M0 | |||
|---|---|---|---|
| Quadrant | BADHDUFLAG | Total packets | Discarded packets |
| A | 0 | 39718 | 0 |
| B | 0 | 37216 | 0 |
| C | 0 | 17333 | 0 |
| D | 0 | 56256 | 7 |
| Quadrant | Total seconds | Saturated seconds | Saturation percentage |
|---|---|---|---|
| A | 7219 | 3130 | 43.357806% |
| B | 7219 | 3636 | 50.367087% |
| C | 7220 | 272 | 3.767313% |
| D | 7219 | 6558 | 90.843607% |
Noise dominated data is calculated using 1-second bins in cleaned event files. If a bin has >2000 counts, and if more than 50% of those come from <1% of pixels, then it is considered to be noise-dominated and hence unusable.
| Quadrant | # 1 sec bins | Bins with >0 counts | Bins with >2000 counts | High rate bins dominated by noise | Noise dominated (total time) | Noise dominated (detector-on time) | Marked lightcurve |
|---|---|---|---|---|---|---|---|
| A | 7218 | 7218 | 2792 | 2792 | 38.68% | 38.68% |  |
| B | 7219 | 7219 | 3196 | 3196 | 44.27% | 44.27% | 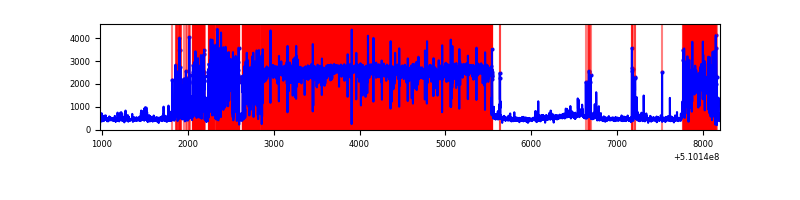 |
| C | 7220 | 7220 | 186 | 186 | 2.58% | 2.58% | 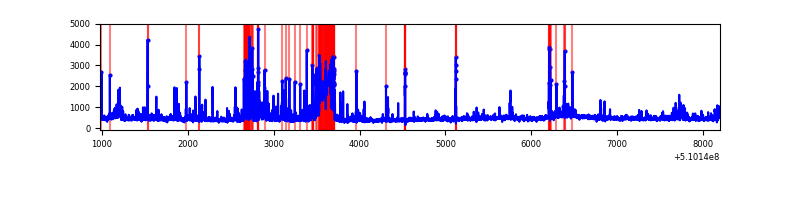 |
| D | 7218 | 7218 | 5724 | 5724 | 79.30% | 79.30% |  |
Top three noisy pixels from each quadrant. If the there are fewer than three noisy pixels in the level2.evt file, extra rows are filled as -1
| Pixel properties | Quadrant properties | ||||||
|---|---|---|---|---|---|---|---|
| Quadrant | DetID | PixID | Counts | Sigma | Mean | Median | Sigma |
| A | 12 | 3 | 6645381 | 44422.63 | 598 | 584 | 149.6 |
| A | 12 | 194 | 834168 | 5572.78 | 598 | 584 | 149.6 |
| A | 0 | 8 | 584777 | 3905.52 | 598 | 584 | 149.6 |
| B | 5 | 172 | 6261692 | 54722.1 | 537 | 519 | 114.4 |
| B | 4 | 206 | 1499455 | 13100.57 | 537 | 519 | 114.4 |
| B | 5 | 185 | 605020 | 5283.29 | 537 | 519 | 114.4 |
| C | 15 | 215 | 568195 | 2793.86 | 738 | 732 | 203.1 |
| C | 12 | 252 | 184891 | 906.69 | 738 | 732 | 203.1 |
| C | 12 | 254 | 139829 | 684.83 | 738 | 732 | 203.1 |
| D | 8 | 129 | 15230819 | 171928.61 | 309 | 294 | 88.6 |
| D | 8 | 160 | 378600 | 4270.48 | 309 | 294 | 88.6 |
| D | 2 | 249 | 100321 | 1129.15 | 309 | 294 | 88.6 |
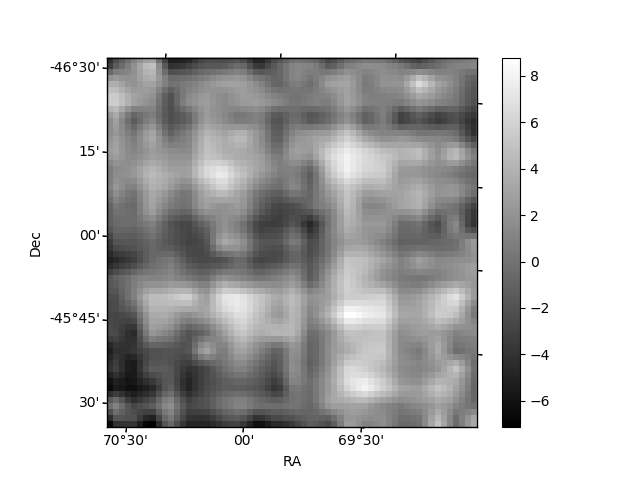
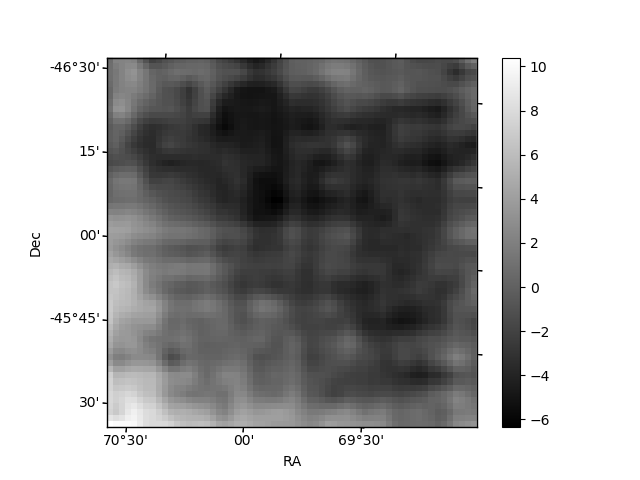
Histogram calculated using DETX and DETY for each event in the final _common_clean file
| Quadrant A | 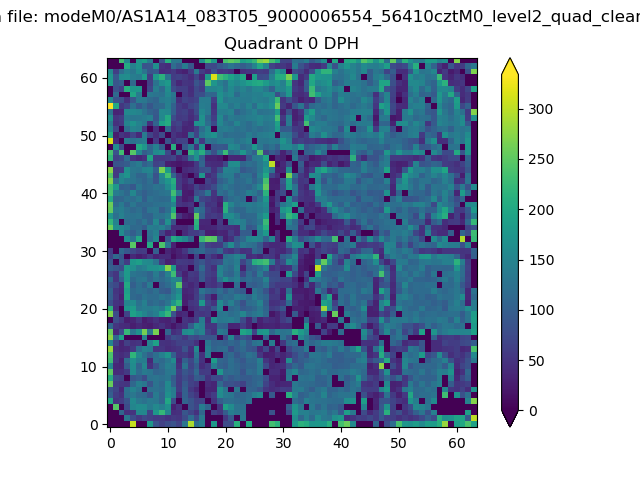 |
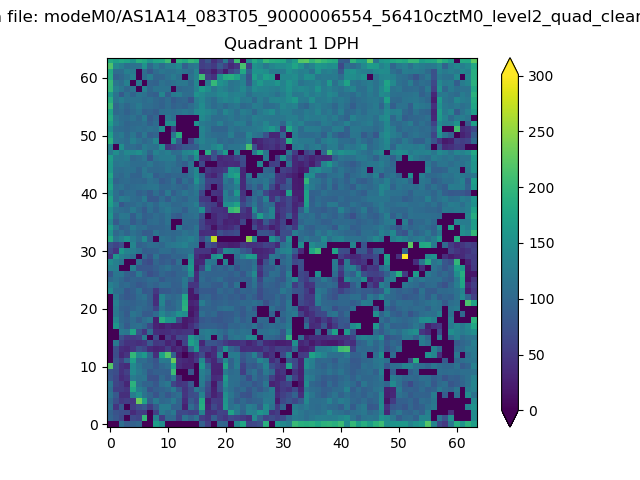 |
Quadrant B |
|---|---|---|---|
| Quadrant D | 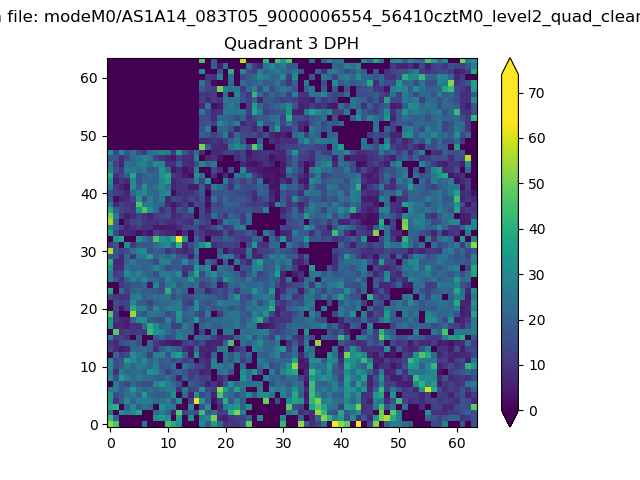 |
 |
Quadrant C |
| Plot type | Count rate plots | Images |
|---|---|---|
| Comparison with Poisson distribution Blue bars denote a histogram of data divided into 1 sec bins. Red curve is a Poisson curve with rate = median count rate of data. |
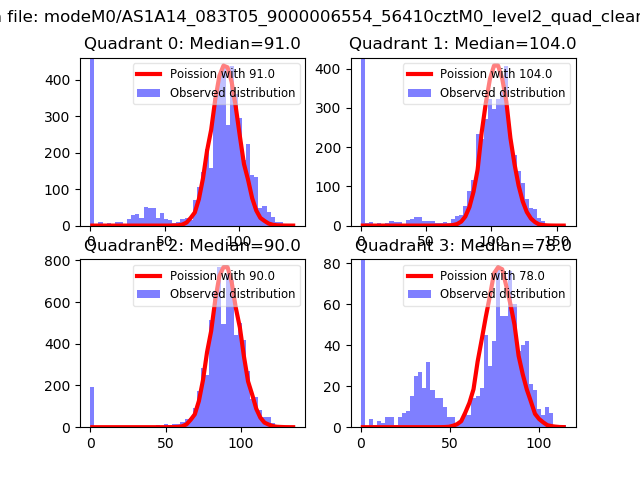 |
 |
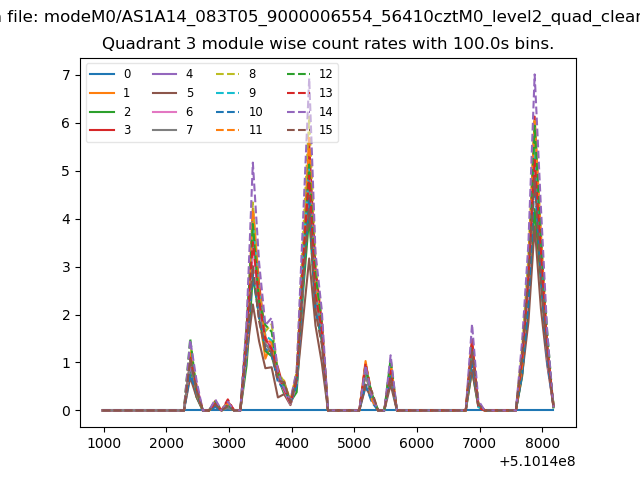
| Quadrant-wise count rates Data is divided into 100 sec bins |
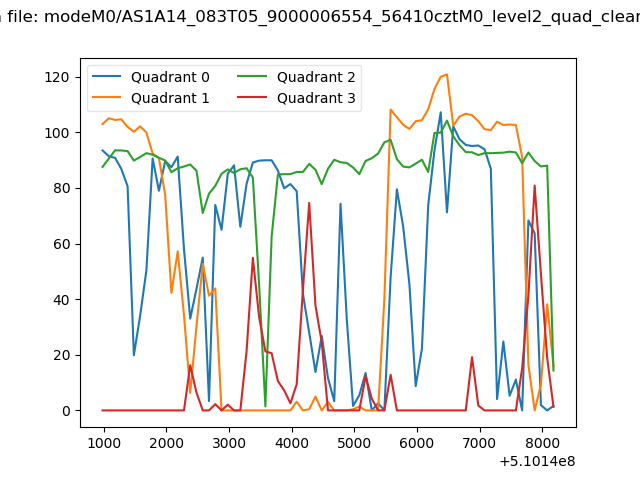 |
|
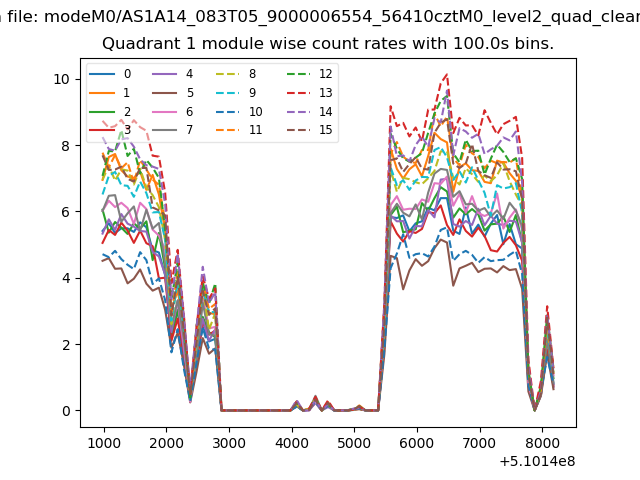
| Module-wise count rates for Quadrant A Data is divided into 100 sec bins |
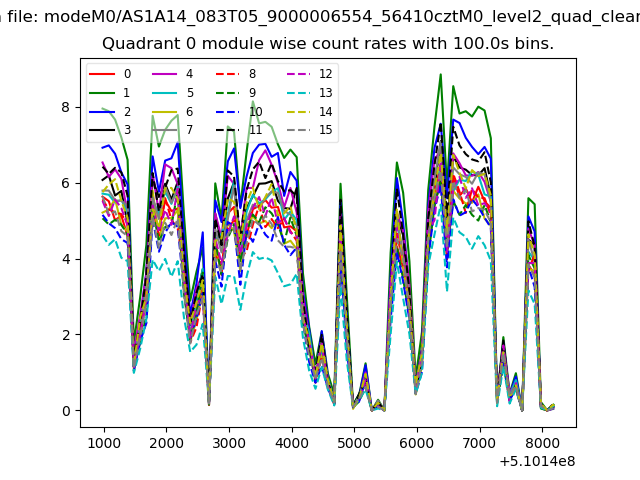 |
 |
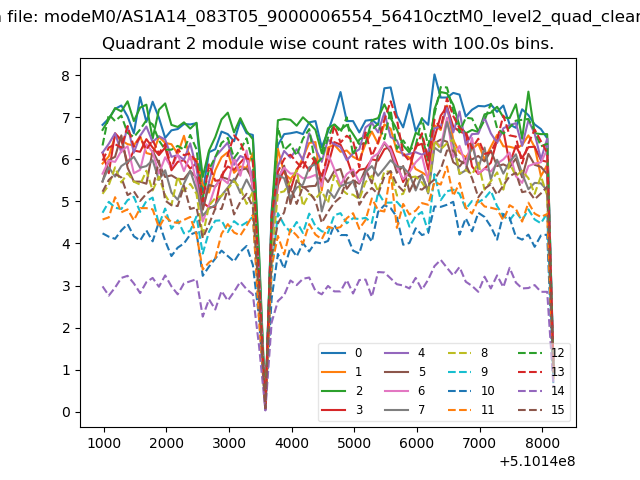
| Module-wise count rates for Quadrant B Data is divided into 100 sec bins |
 |
 |
| Module-wise count rates for Quadrant C Data is divided into 100 sec bins |
 |
 |
| Module-wise count rates for Quadrant D Data is divided into 100 sec bins |
 |
 |
| Parameter | Plot |
|---|---|
| CZT HV Monitor |  |
| D_VDD | 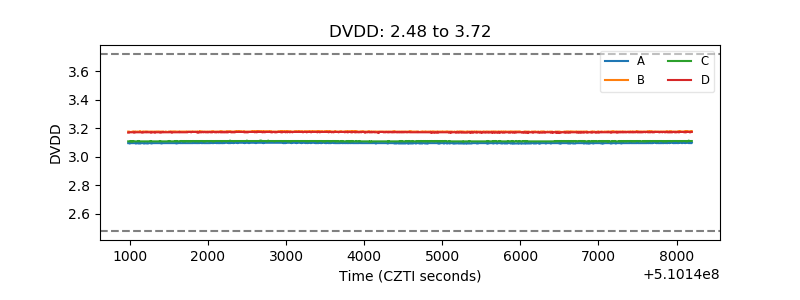 |
| Temperature 1 | 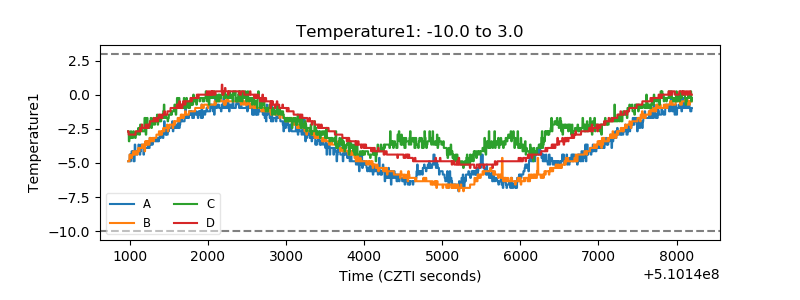 |
| Veto HV Monitor | 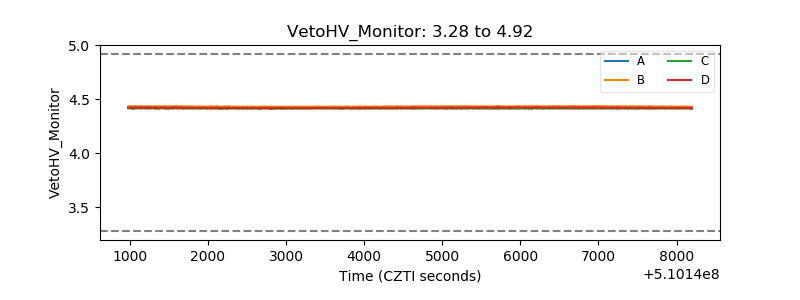 |
| Veto LLD | 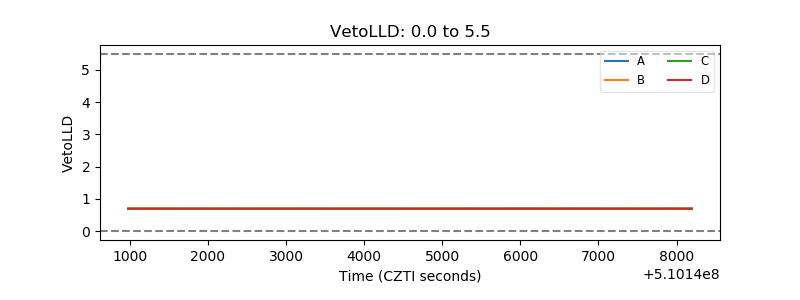 |
| Alpha Counter |  |
| _CPM_Rate | 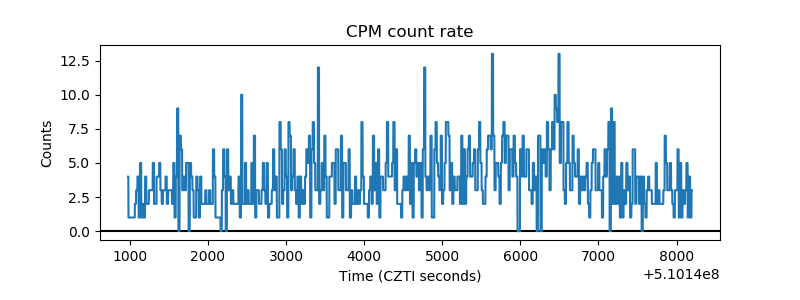 |
| CZT Counter | 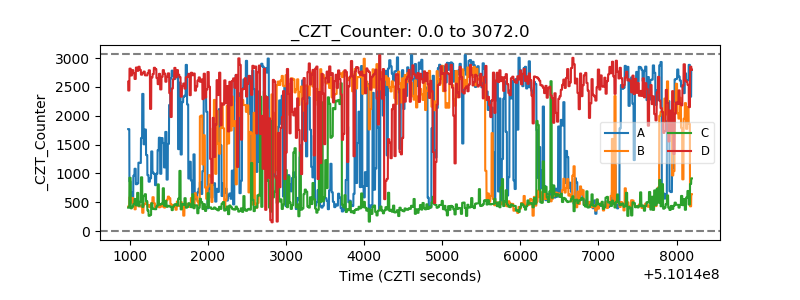 |
| +2.5 Volts monitor |  |
| +5 Volts monitor |  |
| _ROLL_ROT | 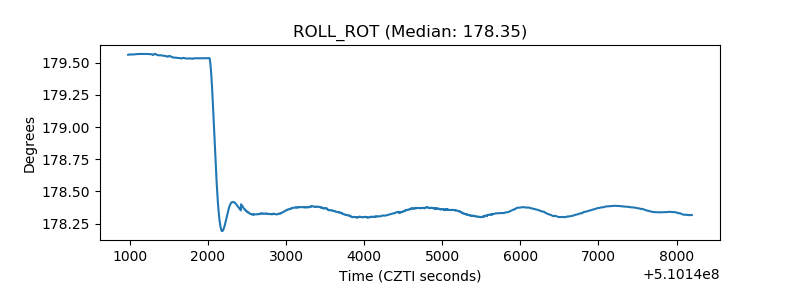 |
| _Roll_DEC | 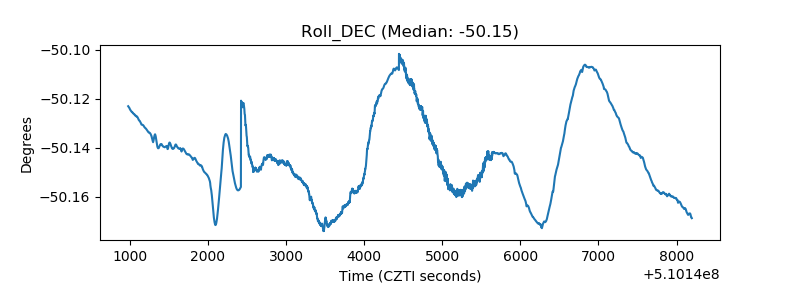 |
| _Roll_RA |  |
| Veto Counter | 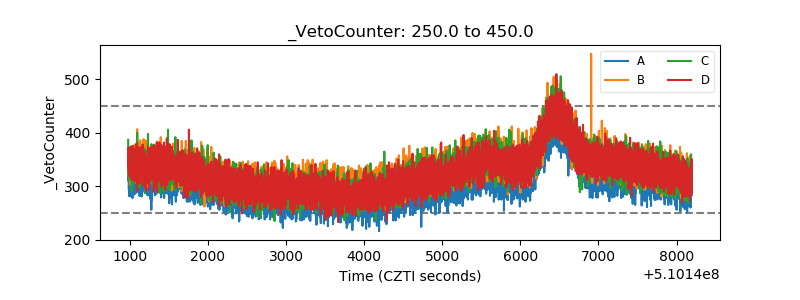 |