| Param | Original file | Final file |
|---|---|---|
| Filename | modeM0/AS1A14_083T05_9000006554_56414cztM0_level2.fits | modeM0/AS1A14_083T05_9000006554_56414cztM0_level2_quad_clean.evt |
| Size (bytes) | 2,267,674,560 | 200,617,920 |
| Size | 2.1 GB | 191.3 MB |
| Events in quadrant A | 27,780,663 | 979,069 |
| Events in quadrant B | 14,556,815 | 1,550,548 |
| Events in quadrant C | 8,718,425 | 1,537,274 |
| Events in quadrant D | 31,528,664 | 791,554 |
| Mode M9 | |||
|---|---|---|---|
| Quadrant | BADHDUFLAG | Total packets | Discarded packets |
| A | 0 | 17 | 0 |
| B | 0 | 17 | 0 |
| C | 0 | 17 | 0 |
| D | 0 | 17 | 0 |
| Mode SS | |||
|---|---|---|---|
| Quadrant | BADHDUFLAG | Total packets | Discarded packets |
| A | 0 | 356 | 0 |
| B | 0 | 356 | 0 |
| C | 0 | 356 | 0 |
| D | 0 | 356 | 0 |
| Mode M0 | |||
|---|---|---|---|
| Quadrant | BADHDUFLAG | Total packets | Discarded packets |
| A | 0 | 94615 | 5 |
| B | 0 | 55374 | 3 |
| C | 0 | 39052 | 3 |
| D | 0 | 105906 | 3 |
| Quadrant | Total seconds | Saturated seconds | Saturation percentage |
|---|---|---|---|
| A | 17626 | 7269 | 41.240213% |
| B | 17626 | 2345 | 13.304210% |
| C | 17626 | 173 | 0.981505% |
| D | 17626 | 8155 | 46.266878% |
Noise dominated data is calculated using 1-second bins in cleaned event files. If a bin has >2000 counts, and if more than 50% of those come from <1% of pixels, then it is considered to be noise-dominated and hence unusable.
| Quadrant | # 1 sec bins | Bins with >0 counts | Bins with >2000 counts | High rate bins dominated by noise | Noise dominated (total time) | Noise dominated (detector-on time) | Marked lightcurve |
|---|---|---|---|---|---|---|---|
| A | 19246 | 17629 | 6480 | 6480 | 33.67% | 36.76% |  |
| B | 19246 | 17629 | 1435 | 1435 | 7.46% | 8.14% |  |
| C | 19246 | 17629 | 120 | 120 | 0.62% | 0.68% | 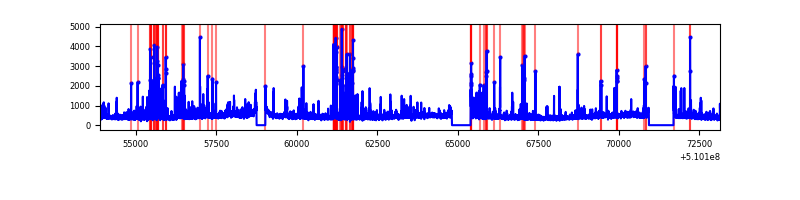 |
| D | 19246 | 17628 | 7951 | 7951 | 41.31% | 45.10% |  |
Top three noisy pixels from each quadrant. If the there are fewer than three noisy pixels in the level2.evt file, extra rows are filled as -1
| Pixel properties | Quadrant properties | ||||||
|---|---|---|---|---|---|---|---|
| Quadrant | DetID | PixID | Counts | Sigma | Mean | Median | Sigma |
| A | 12 | 3 | 13731077 | 37242.94 | 1478 | 1441 | 368.7 |
| A | 4 | 95 | 2283678 | 6190.78 | 1478 | 1441 | 368.7 |
| A | 12 | 194 | 1743244 | 4724.81 | 1478 | 1441 | 368.7 |
| B | 4 | 206 | 5474767 | 14511.98 | 1776 | 1714 | 377.1 |
| B | 5 | 185 | 602308 | 1592.5 | 1776 | 1714 | 377.1 |
| B | 8 | 128 | 474331 | 1253.16 | 1776 | 1714 | 377.1 |
| C | 12 | 254 | 639310 | 1292.71 | 1807 | 1791 | 493.2 |
| C | 13 | 3 | 266364 | 536.48 | 1807 | 1791 | 493.2 |
| C | 12 | 252 | 169862 | 340.8 | 1807 | 1791 | 493.2 |
| D | 8 | 129 | 23936159 | 65624.79 | 1274 | 1216 | 364.7 |
| D | 5 | 113 | 575447 | 1574.43 | 1274 | 1216 | 364.7 |
| D | 8 | 160 | 344859 | 942.2 | 1274 | 1216 | 364.7 |
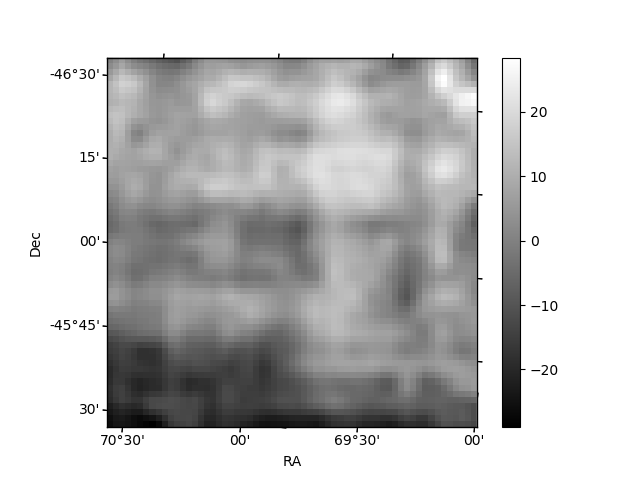
Histogram calculated using DETX and DETY for each event in the final _common_clean file
| Quadrant A | 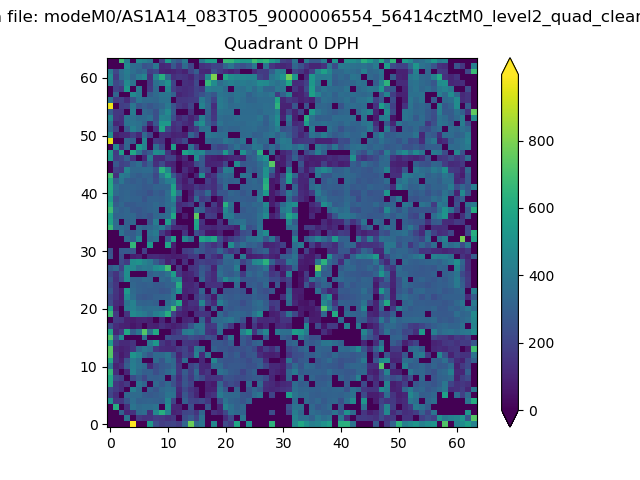 |
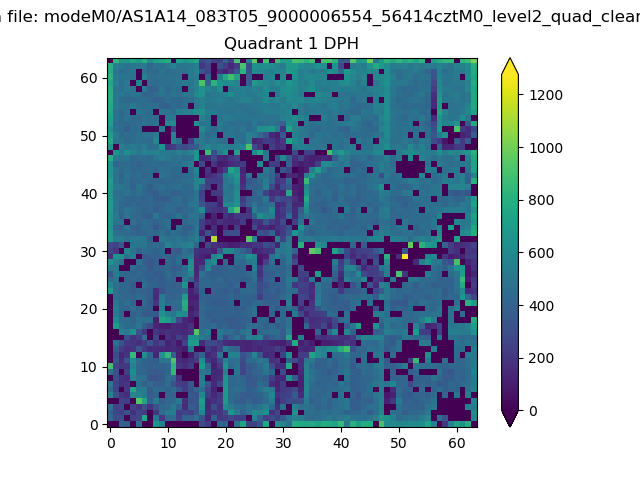 |
Quadrant B |
|---|---|---|---|
| Quadrant D |  |
 |
Quadrant C |
| Plot type | Count rate plots | Images |
|---|---|---|
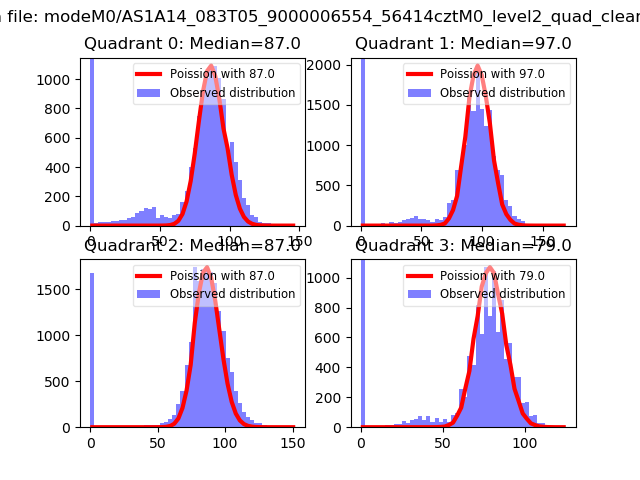
| Comparison with Poisson distribution Blue bars denote a histogram of data divided into 1 sec bins. Red curve is a Poisson curve with rate = median count rate of data. |
 |
 |
| Quadrant-wise count rates Data is divided into 100 sec bins |
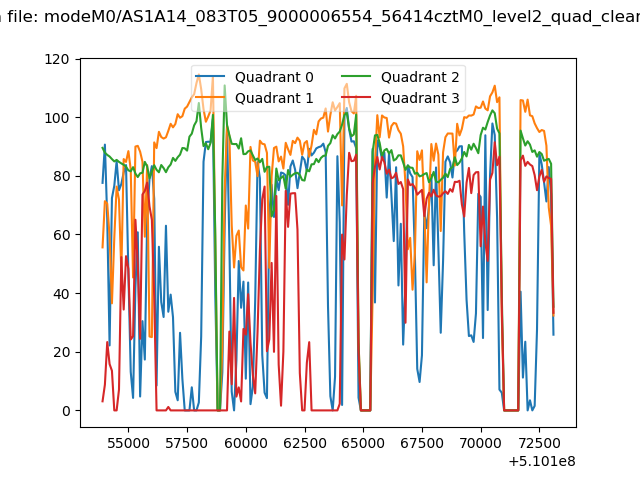 |
|
| Module-wise count rates for Quadrant A Data is divided into 100 sec bins |
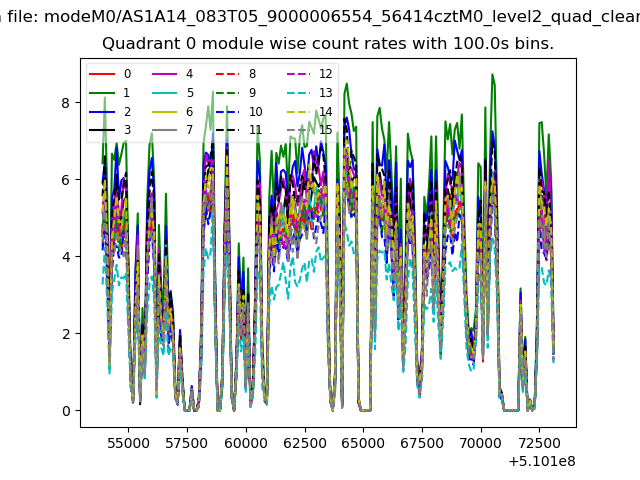 |
 |
| Module-wise count rates for Quadrant B Data is divided into 100 sec bins |
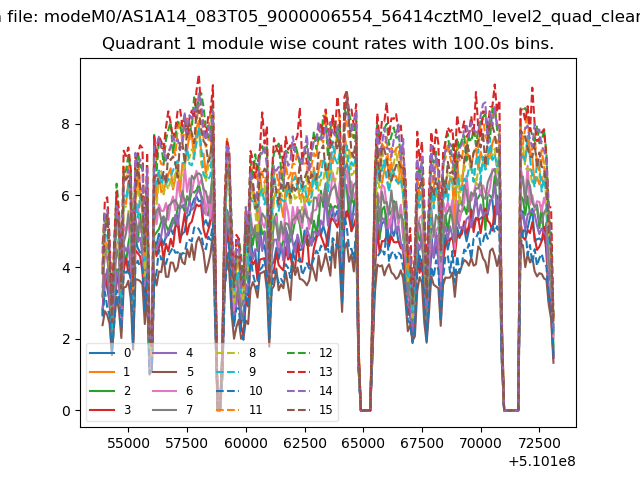 |
 |
| Module-wise count rates for Quadrant C Data is divided into 100 sec bins |
 |
 |
| Module-wise count rates for Quadrant D Data is divided into 100 sec bins |
 |
 |
| Parameter | Plot |
|---|---|
| CZT HV Monitor |  |
| D_VDD |  |
| Temperature 1 |  |
| Veto HV Monitor | 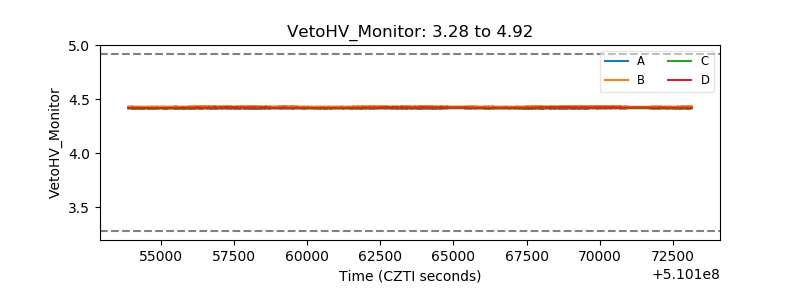 |
| Veto LLD | 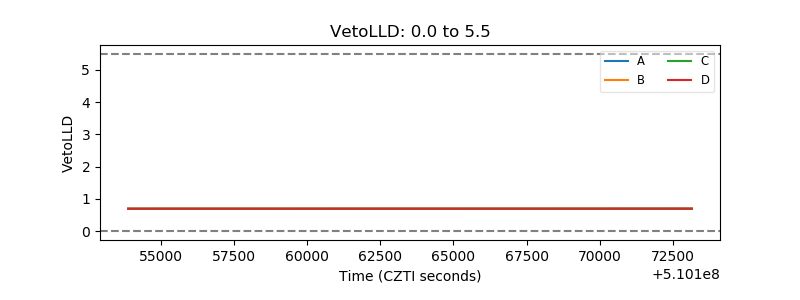 |
| Alpha Counter |  |
| _CPM_Rate | 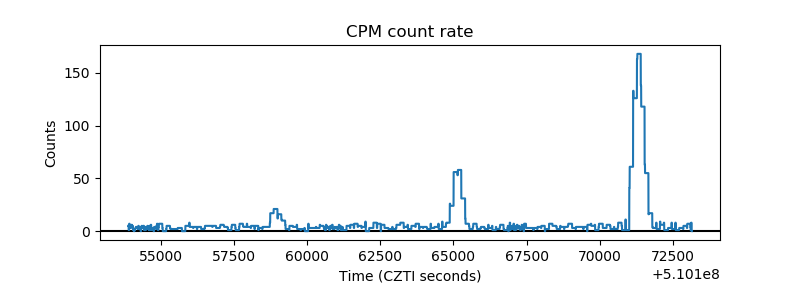 |
| CZT Counter | 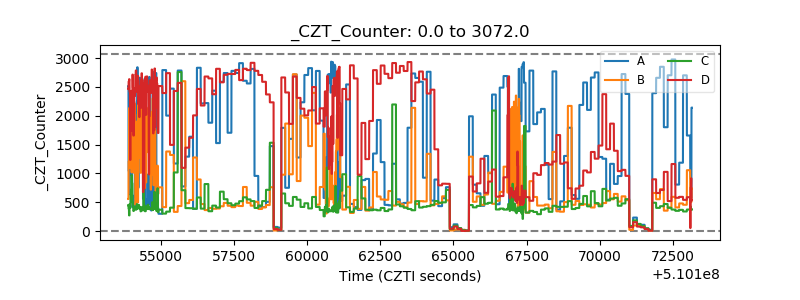 |
| +2.5 Volts monitor |  |
| +5 Volts monitor |  |
| _ROLL_ROT | 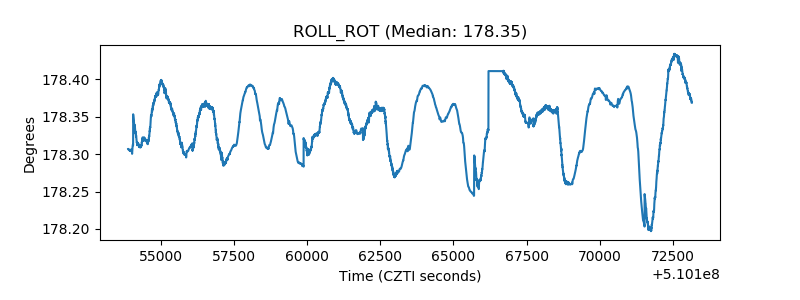 |
| _Roll_DEC | 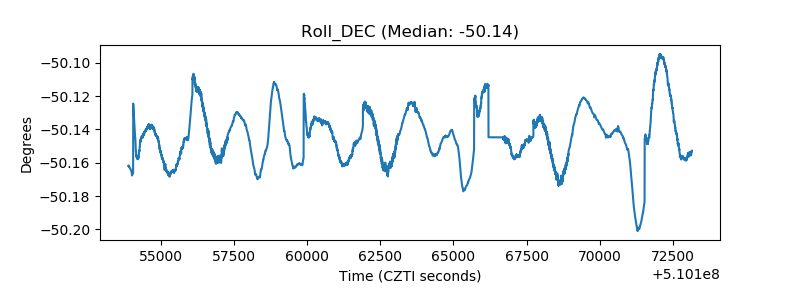 |
| _Roll_RA |  |
| Veto Counter | 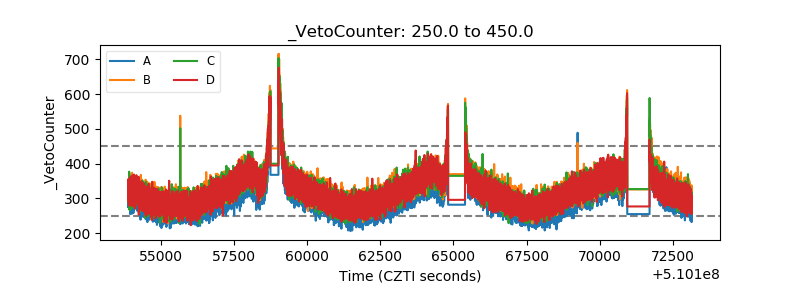 |