| Param | Original file | Final file |
|---|---|---|
| Filename | modeM0/AS1A14_083T05_9000006554_56417cztM0_level2.fits | modeM0/AS1A14_083T05_9000006554_56417cztM0_level2_quad_clean.evt |
| Size (bytes) | 804,712,320 | 72,691,200 |
| Size | 767.4 MB | 69.3 MB |
| Events in quadrant A | 12,053,936 | 300,663 |
| Events in quadrant B | 5,746,020 | 537,233 |
| Events in quadrant C | 3,453,087 | 554,113 |
| Events in quadrant D | 8,053,985 | 374,603 |
| Mode M9 | |||
|---|---|---|---|
| Quadrant | BADHDUFLAG | Total packets | Discarded packets |
| A | 0 | 10 | 0 |
| B | 0 | 10 | 0 |
| C | 0 | 10 | 0 |
| D | 0 | 10 | 0 |
| Mode SS | |||
|---|---|---|---|
| Quadrant | BADHDUFLAG | Total packets | Discarded packets |
| A | 0 | 128 | 0 |
| B | 0 | 128 | 0 |
| C | 0 | 128 | 0 |
| D | 0 | 128 | 0 |
| Mode M0 | |||
|---|---|---|---|
| Quadrant | BADHDUFLAG | Total packets | Discarded packets |
| A | 0 | 39911 | 1 |
| B | 0 | 21380 | 1 |
| C | 0 | 14821 | 1 |
| D | 0 | 28291 | 1 |
| Quadrant | Total seconds | Saturated seconds | Saturation percentage |
|---|---|---|---|
| A | 6211 | 3317 | 53.405249% |
| B | 6211 | 1135 | 18.274030% |
| C | 6212 | 126 | 2.028332% |
| D | 6212 | 1767 | 28.444945% |
Noise dominated data is calculated using 1-second bins in cleaned event files. If a bin has >2000 counts, and if more than 50% of those come from <1% of pixels, then it is considered to be noise-dominated and hence unusable.
| Quadrant | # 1 sec bins | Bins with >0 counts | Bins with >2000 counts | High rate bins dominated by noise | Noise dominated (total time) | Noise dominated (detector-on time) | Marked lightcurve |
|---|---|---|---|---|---|---|---|
| A | 7276 | 6212 | 3054 | 3054 | 41.97% | 49.16% |  |
| B | 7276 | 6212 | 727 | 727 | 9.99% | 11.70% |  |
| C | 7277 | 6213 | 117 | 117 | 1.61% | 1.88% | 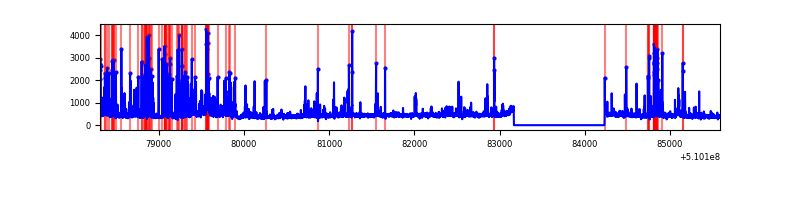 |
| D | 7277 | 6212 | 1638 | 1638 | 22.51% | 26.37% |  |
Top three noisy pixels from each quadrant. If the there are fewer than three noisy pixels in the level2.evt file, extra rows are filled as -1
| Pixel properties | Quadrant properties | ||||||
|---|---|---|---|---|---|---|---|
| Quadrant | DetID | PixID | Counts | Sigma | Mean | Median | Sigma |
| A | 12 | 3 | 6055791 | 51913.04 | 462 | 450 | 116.6 |
| A | 4 | 95 | 1730887 | 14835.21 | 462 | 450 | 116.6 |
| A | 7 | 64 | 1481126 | 12693.98 | 462 | 450 | 116.6 |
| B | 4 | 206 | 2168213 | 17045.36 | 596 | 574 | 127.2 |
| B | 5 | 185 | 485651 | 3814.43 | 596 | 574 | 127.2 |
| B | 8 | 128 | 319526 | 2508.1 | 596 | 574 | 127.2 |
| C | 12 | 254 | 582374 | 3361.33 | 627 | 621 | 173.1 |
| C | 15 | 230 | 289588 | 1669.63 | 627 | 621 | 173.1 |
| C | 6 | 223 | 48954 | 279.27 | 627 | 621 | 173.1 |
| D | 8 | 129 | 3138669 | 21648.0 | 502 | 479 | 145.0 |
| D | 2 | 120 | 922239 | 6358.53 | 502 | 479 | 145.0 |
| D | 11 | 176 | 763919 | 5266.4 | 502 | 479 | 145.0 |
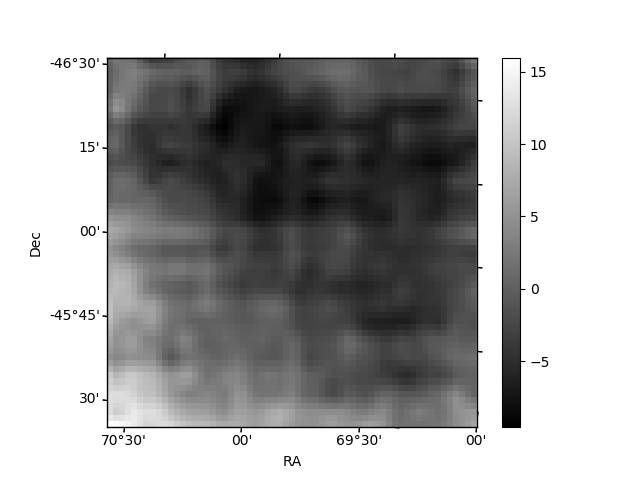
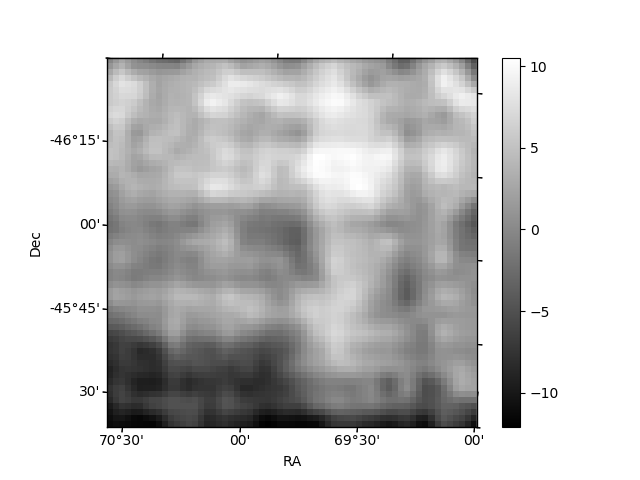
Histogram calculated using DETX and DETY for each event in the final _common_clean file
| Quadrant A | 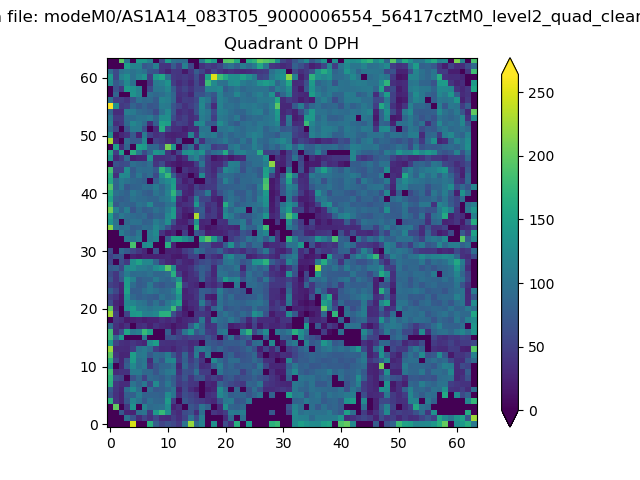 |
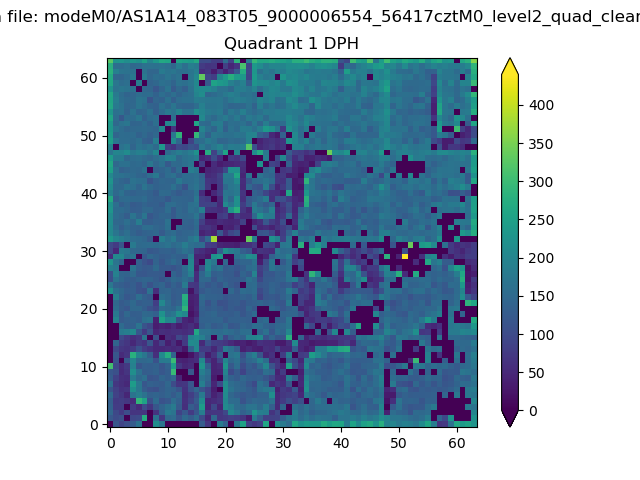 |
Quadrant B |
|---|---|---|---|
| Quadrant D | 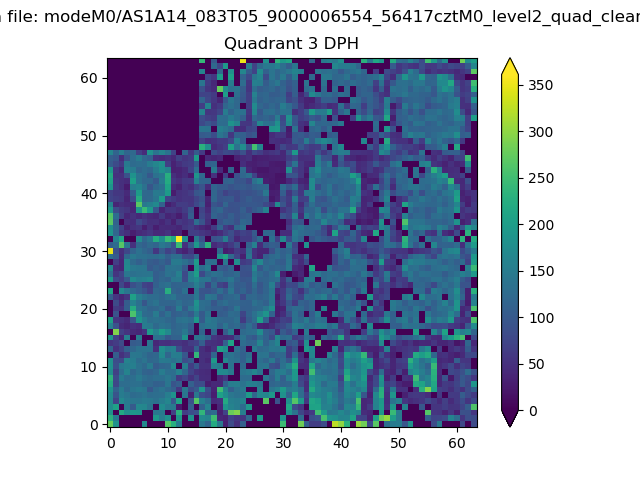 |
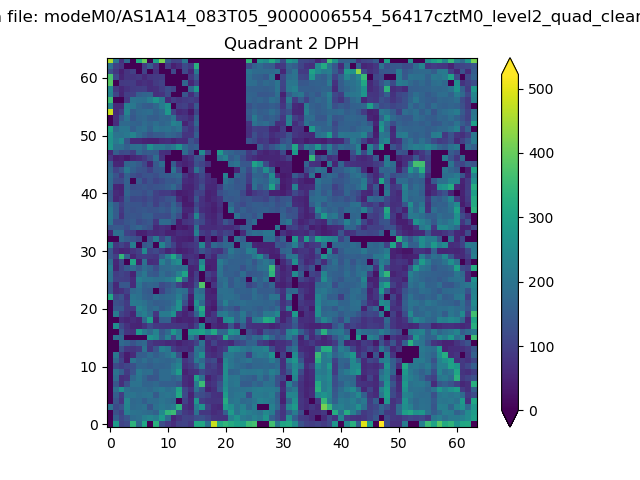 |
Quadrant C |
| Plot type | Count rate plots | Images |
|---|---|---|
| Comparison with Poisson distribution Blue bars denote a histogram of data divided into 1 sec bins. Red curve is a Poisson curve with rate = median count rate of data. |
 |
 |
| Quadrant-wise count rates Data is divided into 100 sec bins |
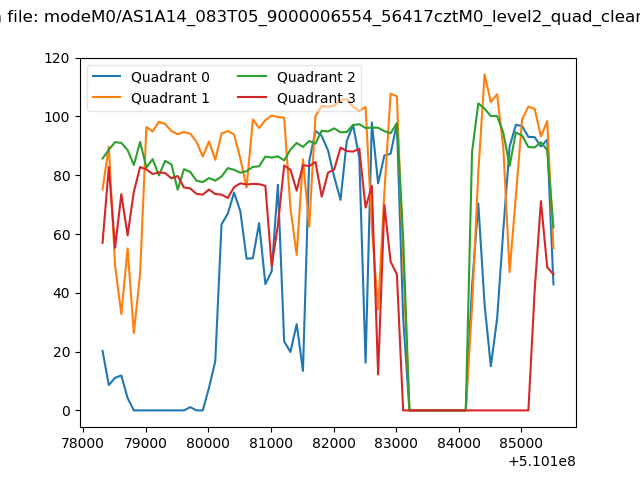 |
|
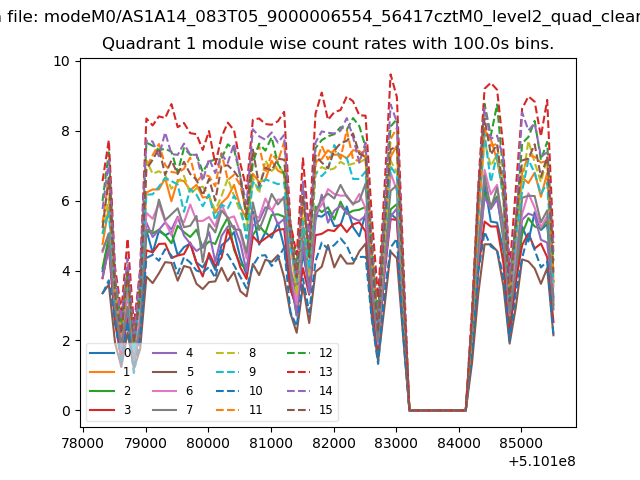
| Module-wise count rates for Quadrant A Data is divided into 100 sec bins |
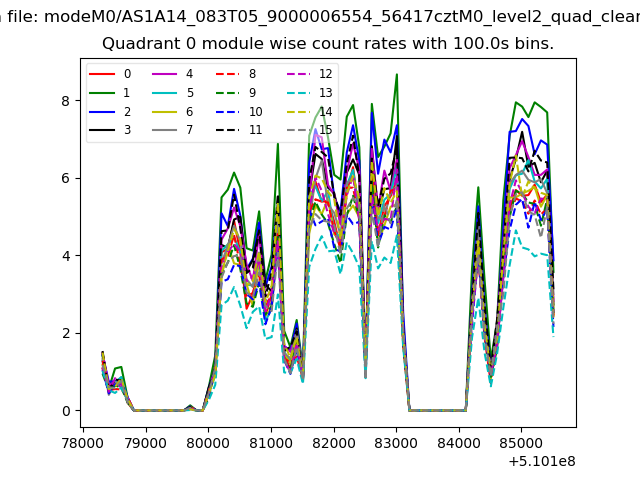 |
 |
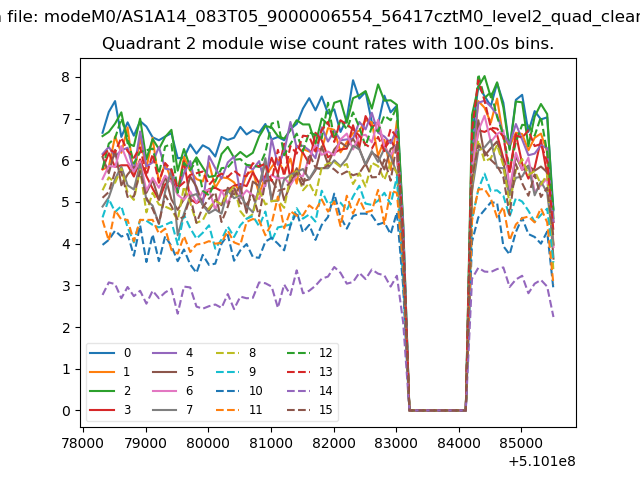
| Module-wise count rates for Quadrant B Data is divided into 100 sec bins |
 |
 |
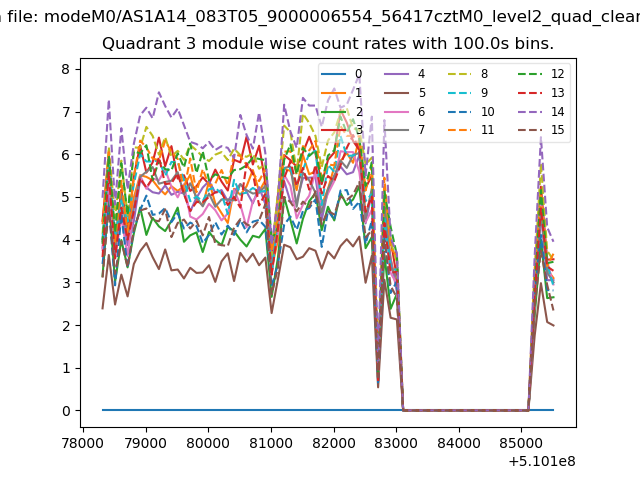
| Module-wise count rates for Quadrant C Data is divided into 100 sec bins |
 |
 |
| Module-wise count rates for Quadrant D Data is divided into 100 sec bins |
 |
 |
| Parameter | Plot |
|---|---|
| CZT HV Monitor |  |
| D_VDD | 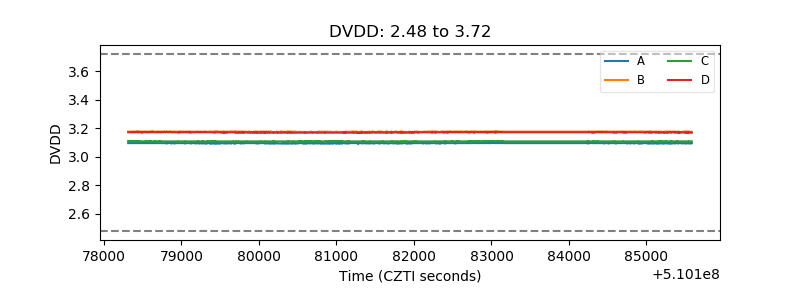 |
| Temperature 1 | 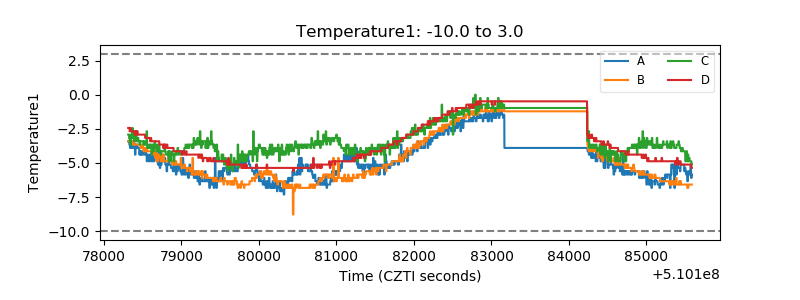 |
| Veto HV Monitor | 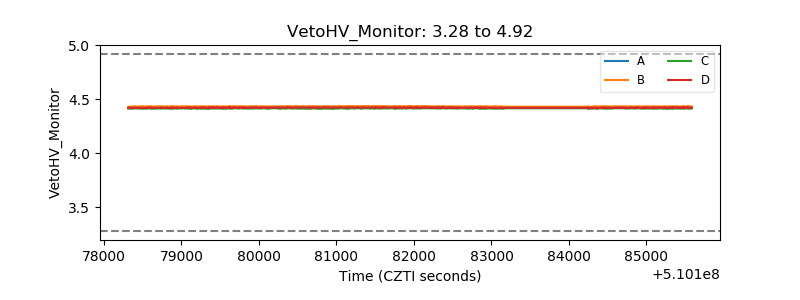 |
| Veto LLD | 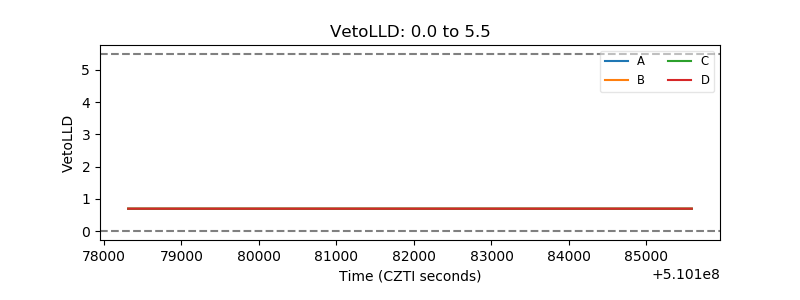 |
| Alpha Counter |  |
| _CPM_Rate |  |
| CZT Counter | 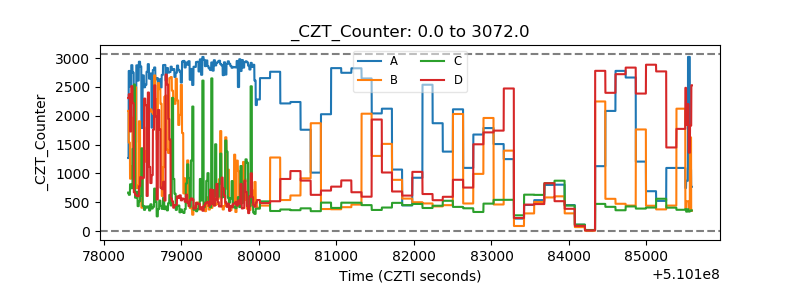 |
| +2.5 Volts monitor | 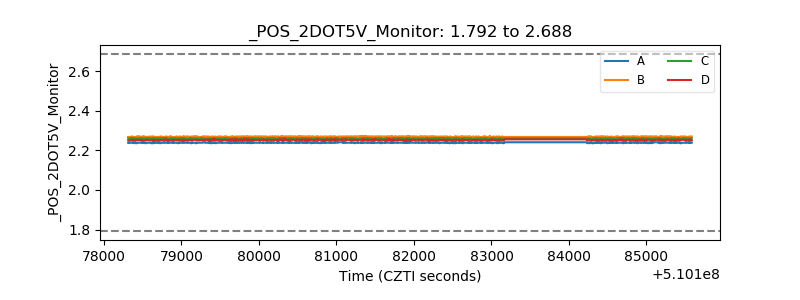 |
| +5 Volts monitor |  |
| _ROLL_ROT | 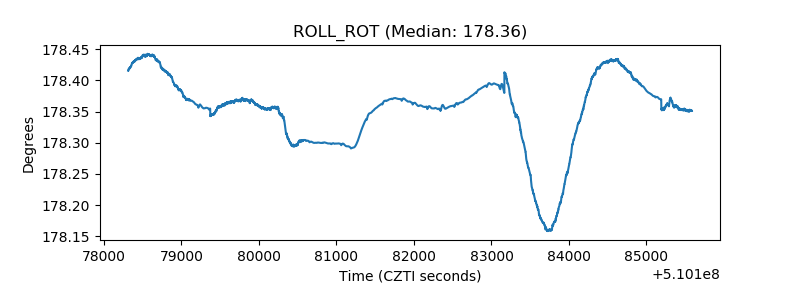 |
| _Roll_DEC | 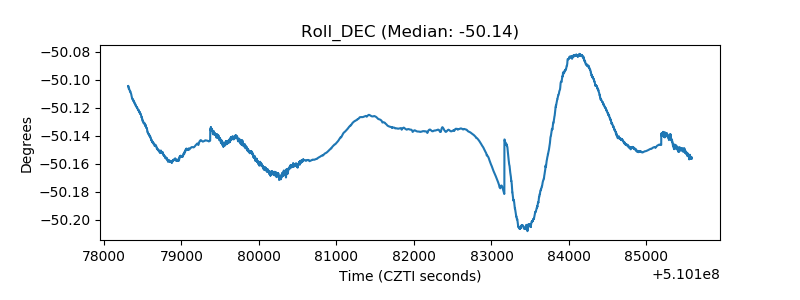 |
| _Roll_RA |  |
| Veto Counter | 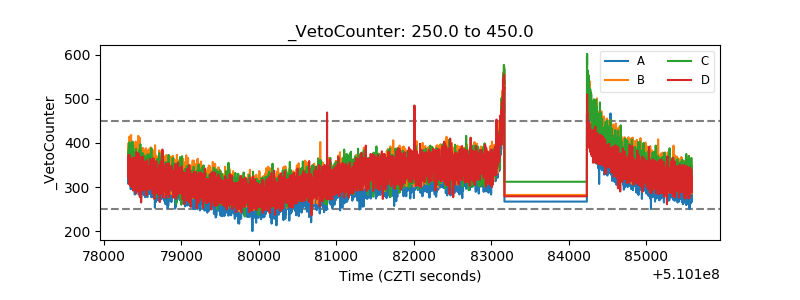 |