| Param | Original file | Final file |
|---|---|---|
| Filename | modeM0/AS1A14_083T05_9000006554_56418cztM0_level2.fits | modeM0/AS1A14_083T05_9000006554_56418cztM0_level2_quad_clean.evt |
| Size (bytes) | 821,318,400 | 75,199,680 |
| Size | 783.3 MB | 71.7 MB |
| Events in quadrant A | 12,034,734 | 320,941 |
| Events in quadrant B | 5,004,567 | 571,478 |
| Events in quadrant C | 3,295,981 | 552,295 |
| Events in quadrant D | 9,567,713 | 381,048 |
| Mode M9 | |||
|---|---|---|---|
| Quadrant | BADHDUFLAG | Total packets | Discarded packets |
| A | 0 | 13 | 0 |
| B | 0 | 13 | 0 |
| C | 0 | 14 | 0 |
| D | 0 | 14 | 0 |
| Mode SS | |||
|---|---|---|---|
| Quadrant | BADHDUFLAG | Total packets | Discarded packets |
| A | 0 | 132 | 0 |
| B | 0 | 132 | 0 |
| C | 0 | 132 | 0 |
| D | 0 | 132 | 0 |
| Mode M0 | |||
|---|---|---|---|
| Quadrant | BADHDUFLAG | Total packets | Discarded packets |
| A | 0 | 40134 | 2 |
| B | 0 | 19278 | 2 |
| C | 0 | 14580 | 2 |
| D | 0 | 32969 | 5 |
| Quadrant | Total seconds | Saturated seconds | Saturation percentage |
|---|---|---|---|
| A | 6459 | 3323 | 51.447593% |
| B | 6459 | 779 | 12.060691% |
| C | 6459 | 115 | 1.780461% |
| D | 6458 | 1925 | 29.807990% |
Noise dominated data is calculated using 1-second bins in cleaned event files. If a bin has >2000 counts, and if more than 50% of those come from <1% of pixels, then it is considered to be noise-dominated and hence unusable.
| Quadrant | # 1 sec bins | Bins with >0 counts | Bins with >2000 counts | High rate bins dominated by noise | Noise dominated (total time) | Noise dominated (detector-on time) | Marked lightcurve |
|---|---|---|---|---|---|---|---|
| A | 7871 | 6734 | 3076 | 3076 | 39.08% | 45.68% |  |
| B | 7870 | 6741 | 432 | 432 | 5.49% | 6.41% |  |
| C | 7871 | 6742 | 83 | 83 | 1.05% | 1.23% | 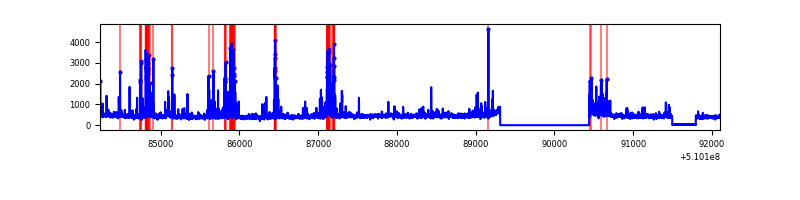 |
| D | 7870 | 6741 | 1800 | 1800 | 22.87% | 26.70% |  |
Top three noisy pixels from each quadrant. If the there are fewer than three noisy pixels in the level2.evt file, extra rows are filled as -1
| Pixel properties | Quadrant properties | ||||||
|---|---|---|---|---|---|---|---|
| Quadrant | DetID | PixID | Counts | Sigma | Mean | Median | Sigma |
| A | 12 | 3 | 5638964 | 42993.09 | 520 | 507 | 131.1 |
| A | 4 | 95 | 2070054 | 15780.24 | 520 | 507 | 131.1 |
| A | 7 | 64 | 1082895 | 8253.18 | 520 | 507 | 131.1 |
| B | 4 | 206 | 1963380 | 13986.98 | 658 | 635 | 140.3 |
| B | 8 | 128 | 69213 | 488.7 | 658 | 635 | 140.3 |
| B | 10 | 247 | 63496 | 447.96 | 658 | 635 | 140.3 |
| C | 15 | 230 | 358206 | 1935.26 | 672 | 666 | 184.8 |
| C | 12 | 254 | 153046 | 824.79 | 672 | 666 | 184.8 |
| C | 6 | 223 | 66798 | 357.95 | 672 | 666 | 184.8 |
| D | 8 | 129 | 5267512 | 33668.41 | 544 | 519 | 156.4 |
| D | 2 | 120 | 511943 | 3269.2 | 544 | 519 | 156.4 |
| D | 2 | 249 | 486205 | 3104.67 | 544 | 519 | 156.4 |
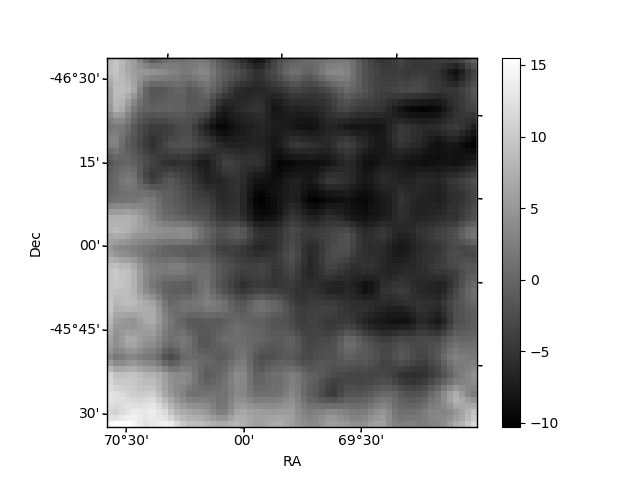
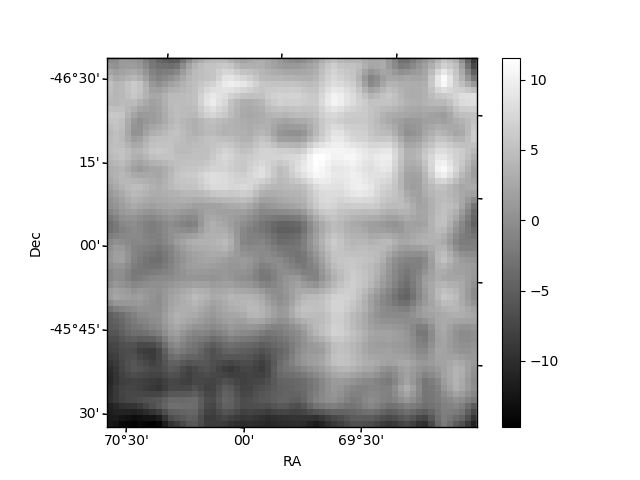
Histogram calculated using DETX and DETY for each event in the final _common_clean file
| Quadrant A | 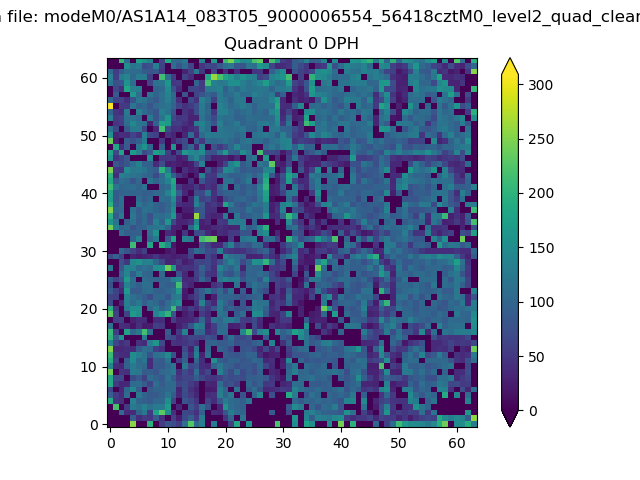 |
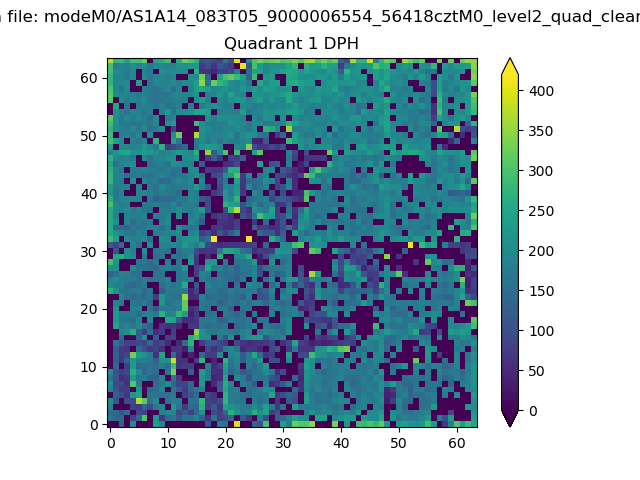 |
Quadrant B |
|---|---|---|---|
| Quadrant D | 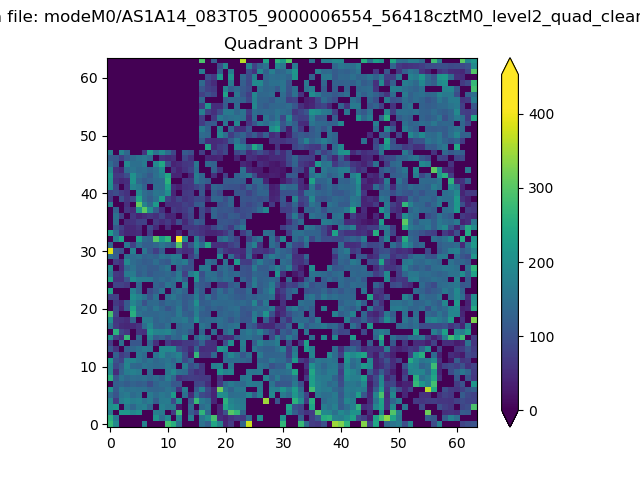 |
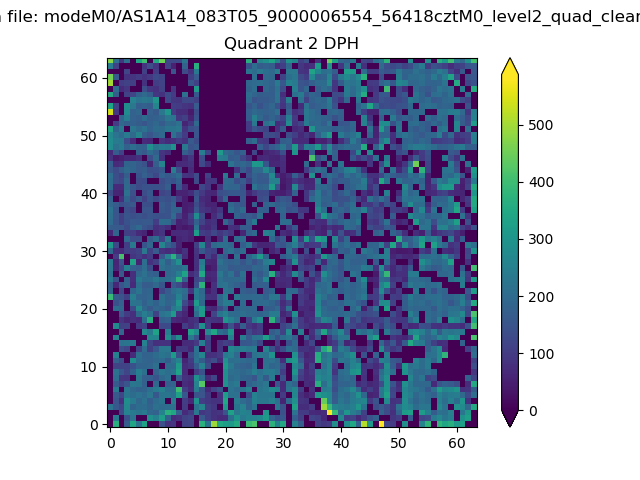 |
Quadrant C |
| Plot type | Count rate plots | Images |
|---|---|---|
| Comparison with Poisson distribution Blue bars denote a histogram of data divided into 1 sec bins. Red curve is a Poisson curve with rate = median count rate of data. |
 |
 |
| Quadrant-wise count rates Data is divided into 100 sec bins |
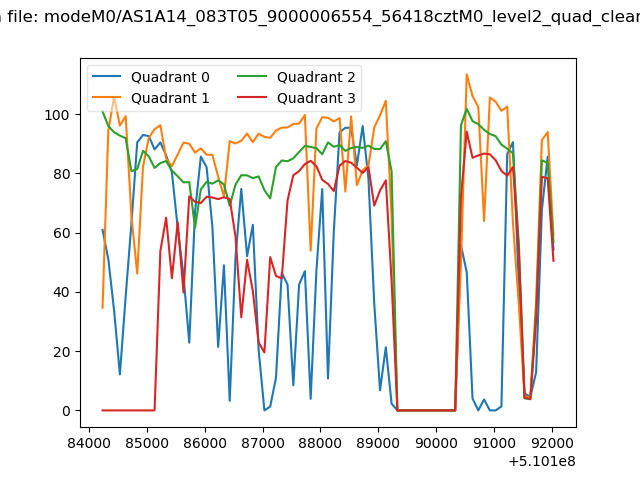 |
|
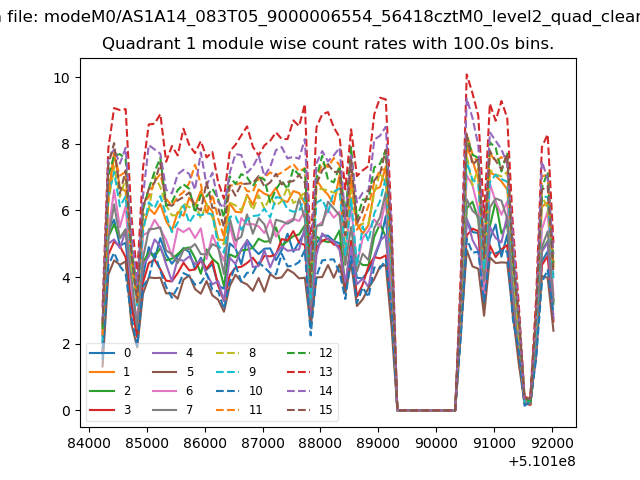
| Module-wise count rates for Quadrant A Data is divided into 100 sec bins |
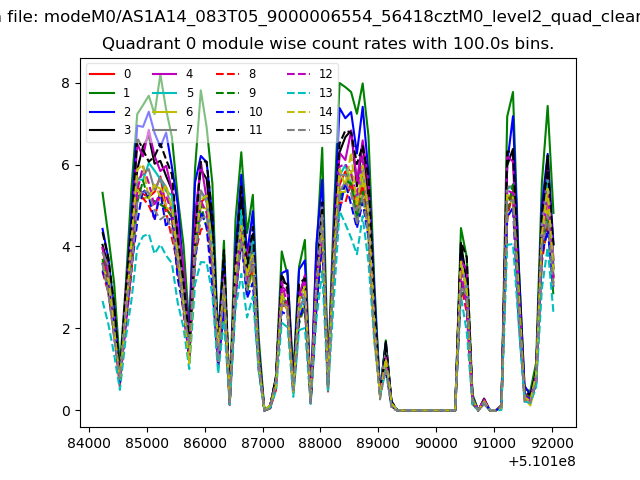 |
 |
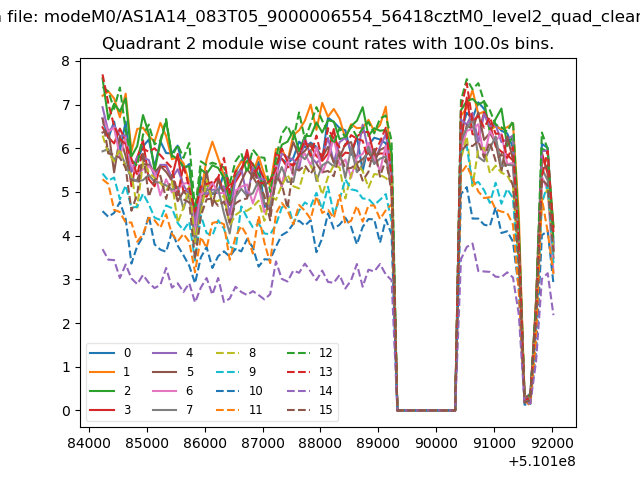
| Module-wise count rates for Quadrant B Data is divided into 100 sec bins |
 |
 |
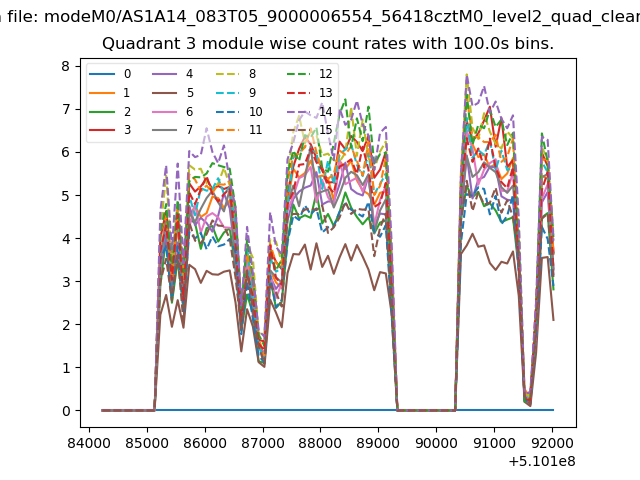
| Module-wise count rates for Quadrant C Data is divided into 100 sec bins |
 |
 |
| Module-wise count rates for Quadrant D Data is divided into 100 sec bins |
 |
 |
| Parameter | Plot |
|---|---|
| CZT HV Monitor |  |
| D_VDD | 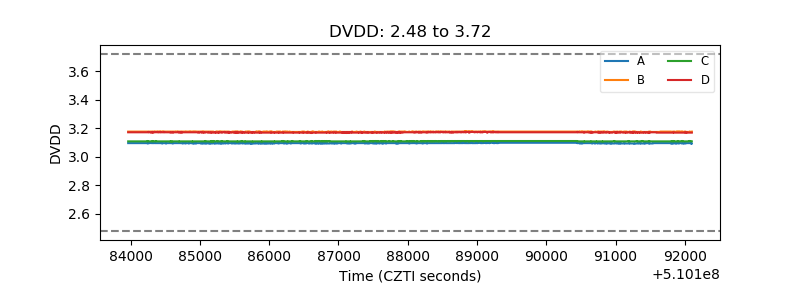 |
| Temperature 1 |  |
| Veto HV Monitor | 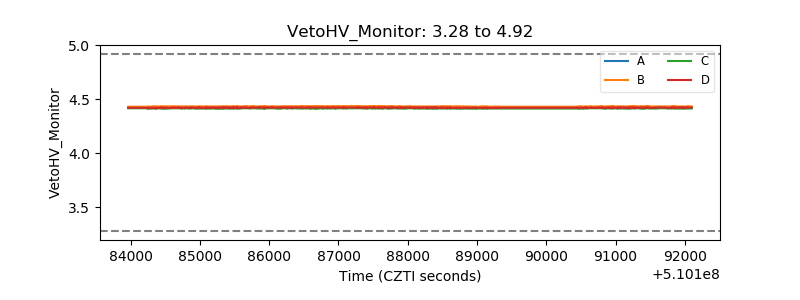 |
| Veto LLD | 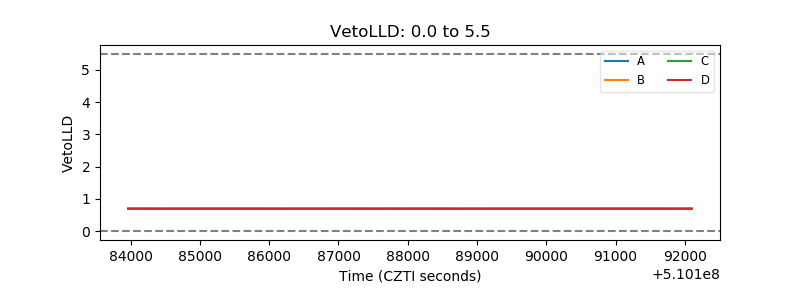 |
| Alpha Counter |  |
| _CPM_Rate |  |
| CZT Counter | 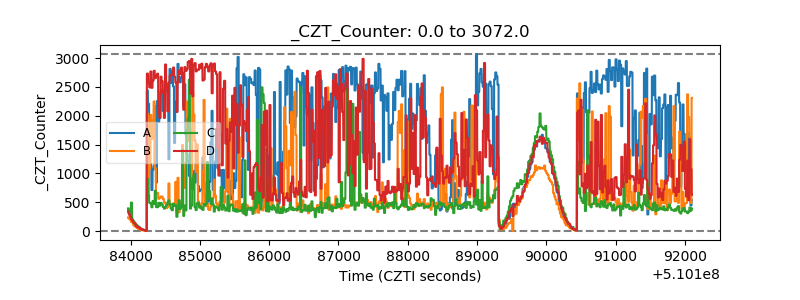 |
| +2.5 Volts monitor | 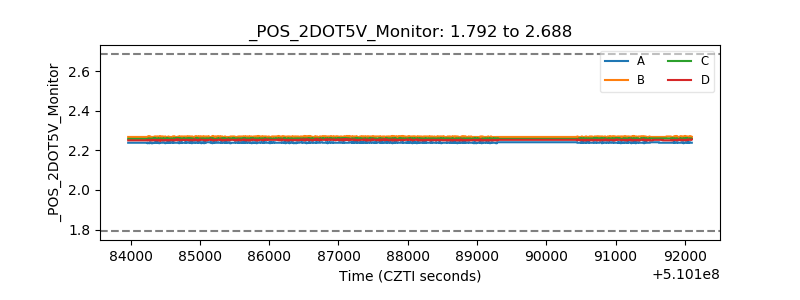 |
| +5 Volts monitor |  |
| _ROLL_ROT | 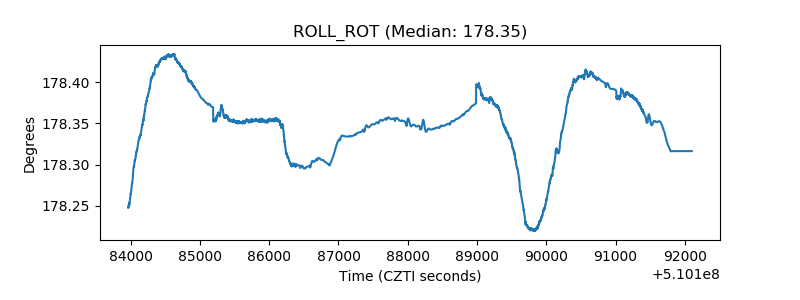 |
| _Roll_DEC | 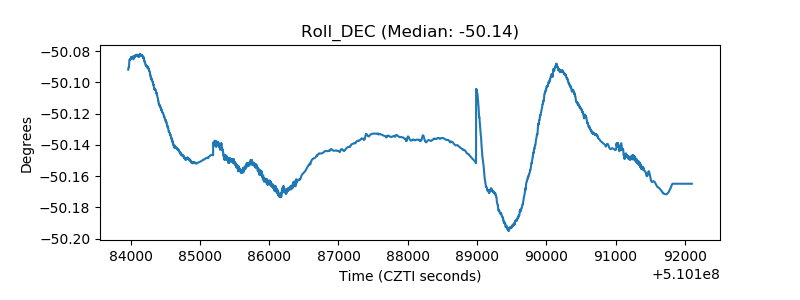 |
| _Roll_RA | 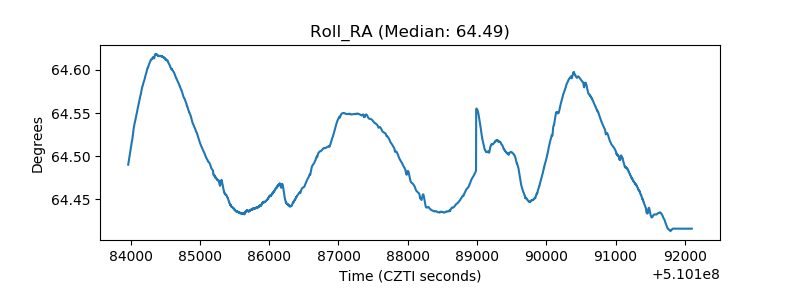 |
| Veto Counter | 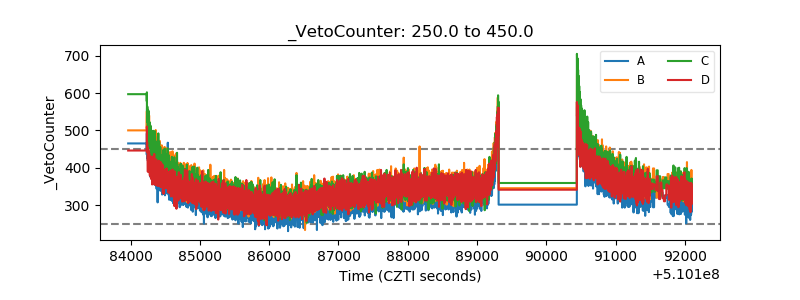 |