| Param | Original file | Final file |
|---|---|---|
| Filename | modeM0/AS1A14_083T05_9000006554_56420cztM0_level2.fits | modeM0/AS1A14_083T05_9000006554_56420cztM0_level2_quad_clean.evt |
| Size (bytes) | 825,897,600 | 80,533,440 |
| Size | 787.6 MB | 76.8 MB |
| Events in quadrant A | 12,172,426 | 331,854 |
| Events in quadrant B | 6,464,993 | 560,946 |
| Events in quadrant C | 3,166,767 | 600,237 |
| Events in quadrant D | 8,277,504 | 501,871 |
| Mode M9 | |||
|---|---|---|---|
| Quadrant | BADHDUFLAG | Total packets | Discarded packets |
| A | 0 | 11 | 0 |
| B | 0 | 11 | 0 |
| C | 0 | 11 | 0 |
| D | 0 | 11 | 0 |
| Mode SS | |||
|---|---|---|---|
| Quadrant | BADHDUFLAG | Total packets | Discarded packets |
| A | 0 | 130 | 0 |
| B | 0 | 130 | 0 |
| C | 0 | 130 | 0 |
| D | 0 | 130 | 0 |
| Mode M0 | |||
|---|---|---|---|
| Quadrant | BADHDUFLAG | Total packets | Discarded packets |
| A | 0 | 40398 | 1 |
| B | 0 | 23528 | 1 |
| C | 0 | 13993 | 2 |
| D | 0 | 29014 | 1 |
| Quadrant | Total seconds | Saturated seconds | Saturation percentage |
|---|---|---|---|
| A | 6350 | 3325 | 52.362205% |
| B | 6350 | 1384 | 21.795276% |
| C | 6350 | 72 | 1.133858% |
| D | 6350 | 777 | 12.236220% |
Noise dominated data is calculated using 1-second bins in cleaned event files. If a bin has >2000 counts, and if more than 50% of those come from <1% of pixels, then it is considered to be noise-dominated and hence unusable.
| Quadrant | # 1 sec bins | Bins with >0 counts | Bins with >2000 counts | High rate bins dominated by noise | Noise dominated (total time) | Noise dominated (detector-on time) | Marked lightcurve |
|---|---|---|---|---|---|---|---|
| A | 7495 | 6350 | 3339 | 3339 | 44.55% | 52.58% | 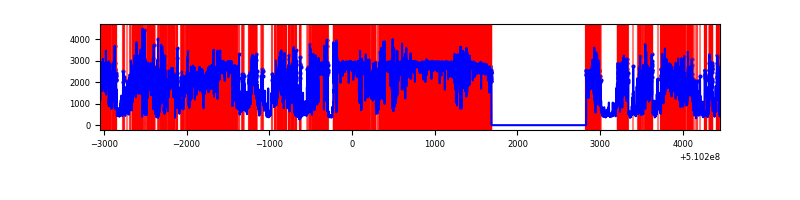 |
| B | 7495 | 6350 | 883 | 883 | 11.78% | 13.91% | 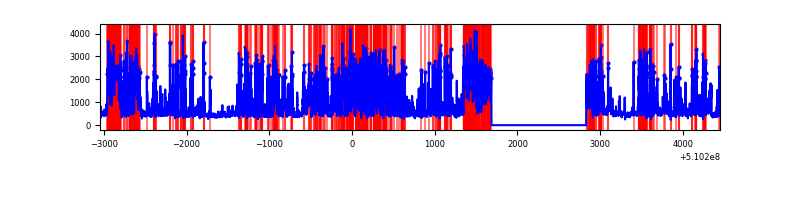 |
| C | 7495 | 6351 | 29 | 29 | 0.39% | 0.46% |  |
| D | 7495 | 6350 | 830 | 830 | 11.07% | 13.07% | 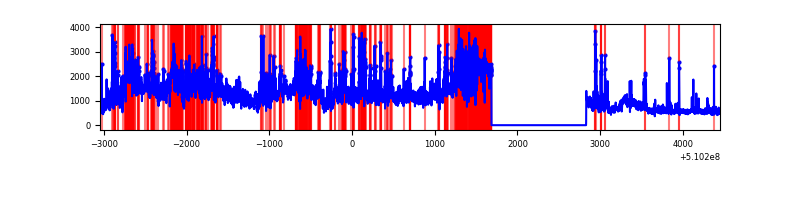 |
Top three noisy pixels from each quadrant. If the there are fewer than three noisy pixels in the level2.evt file, extra rows are filled as -1
| Pixel properties | Quadrant properties | ||||||
|---|---|---|---|---|---|---|---|
| Quadrant | DetID | PixID | Counts | Sigma | Mean | Median | Sigma |
| A | 12 | 3 | 5253546 | 42196.36 | 496 | 484 | 124.5 |
| A | 4 | 95 | 3595289 | 28876.05 | 496 | 484 | 124.5 |
| A | 12 | 194 | 667136 | 5355.03 | 496 | 484 | 124.5 |
| B | 4 | 206 | 3220736 | 24250.96 | 623 | 600 | 132.8 |
| B | 10 | 247 | 562002 | 4227.94 | 623 | 600 | 132.8 |
| B | 0 | 63 | 48205 | 358.51 | 623 | 600 | 132.8 |
| C | 15 | 147 | 194140 | 1034.53 | 686 | 680 | 187.0 |
| C | 12 | 254 | 144889 | 771.16 | 686 | 680 | 187.0 |
| C | 12 | 249 | 46784 | 246.54 | 686 | 680 | 187.0 |
| D | 8 | 129 | 4471916 | 24976.0 | 634 | 606 | 179.0 |
| D | 5 | 113 | 420520 | 2345.57 | 634 | 606 | 179.0 |
| D | 5 | 32 | 308524 | 1719.98 | 634 | 606 | 179.0 |
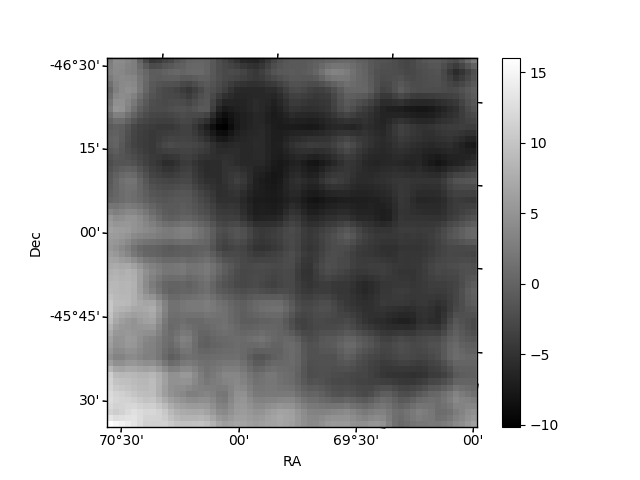
Histogram calculated using DETX and DETY for each event in the final _common_clean file
| Quadrant A | 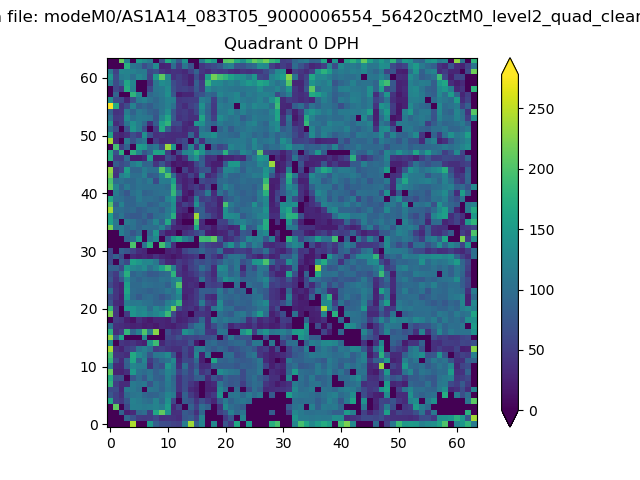 |
 |
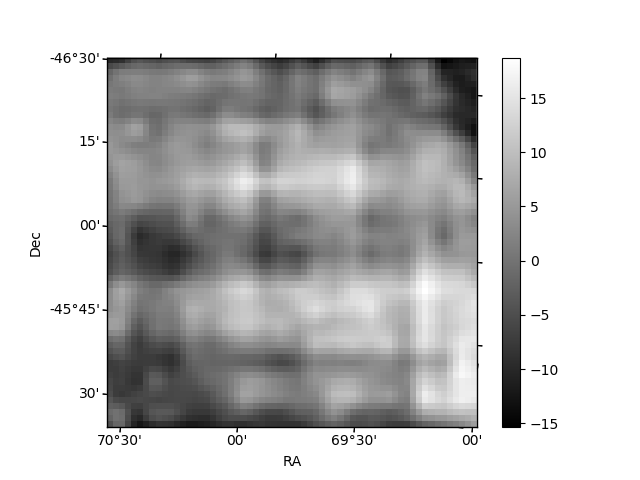
Quadrant B |
|---|---|---|---|
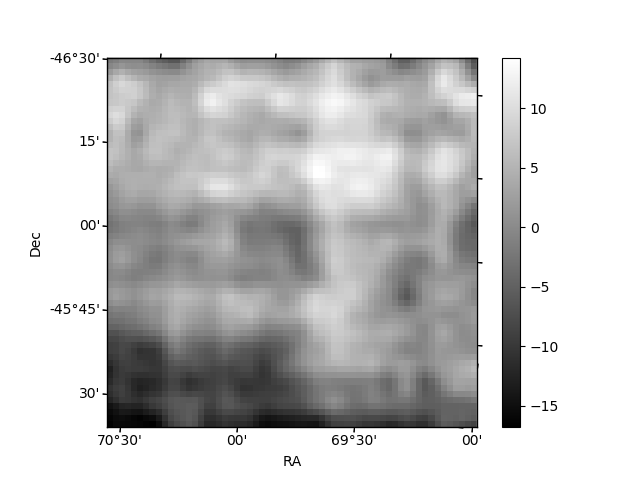
| Quadrant D | 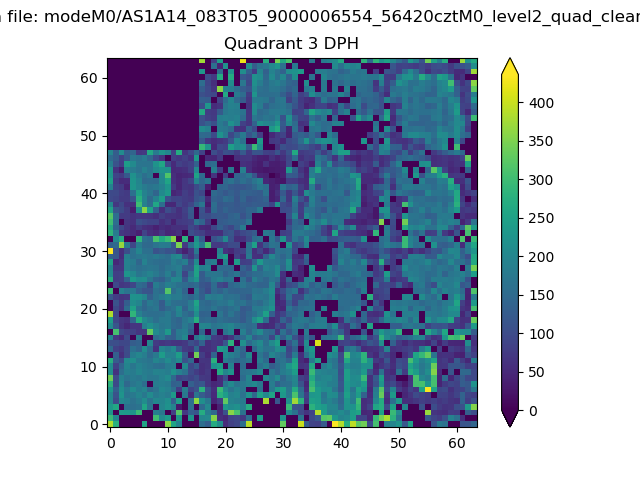 |
 |
Quadrant C |
| Plot type | Count rate plots | Images |
|---|---|---|
| Comparison with Poisson distribution Blue bars denote a histogram of data divided into 1 sec bins. Red curve is a Poisson curve with rate = median count rate of data. |
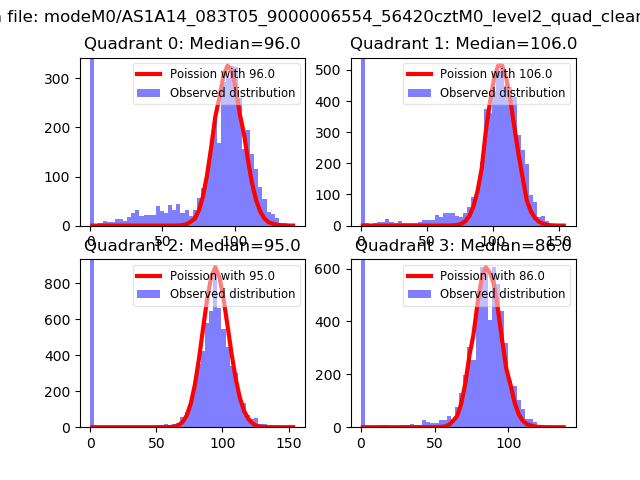 |
 |
| Quadrant-wise count rates Data is divided into 100 sec bins |
 |
|
| Module-wise count rates for Quadrant A Data is divided into 100 sec bins |
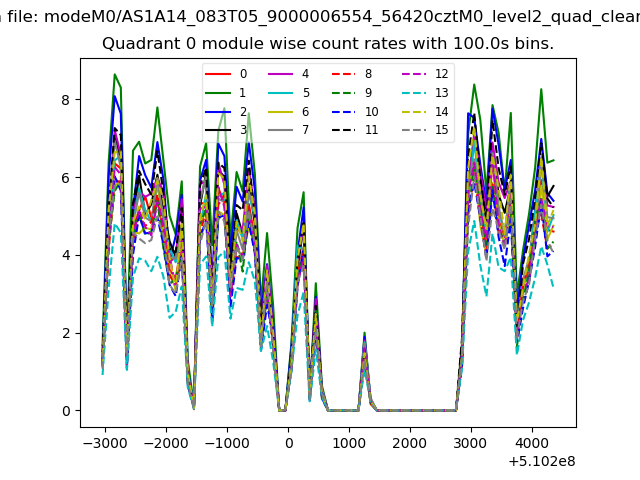 |
 |
| Module-wise count rates for Quadrant B Data is divided into 100 sec bins |
 |
 |
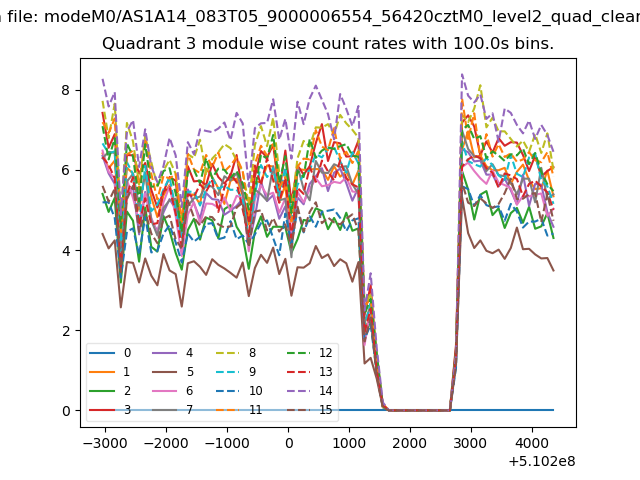
| Module-wise count rates for Quadrant C Data is divided into 100 sec bins |
 |
 |
| Module-wise count rates for Quadrant D Data is divided into 100 sec bins |
 |
 |
| Parameter | Plot |
|---|---|
| CZT HV Monitor | 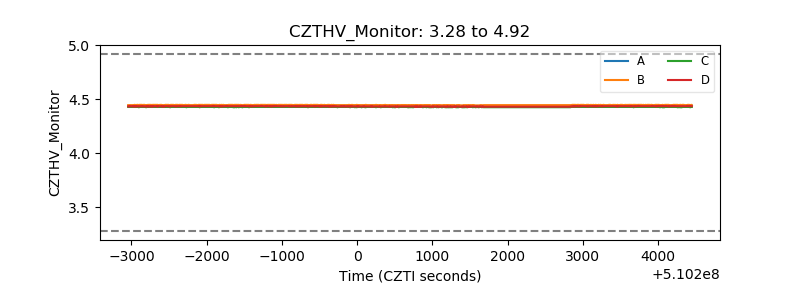 |
| D_VDD |  |
| Temperature 1 | 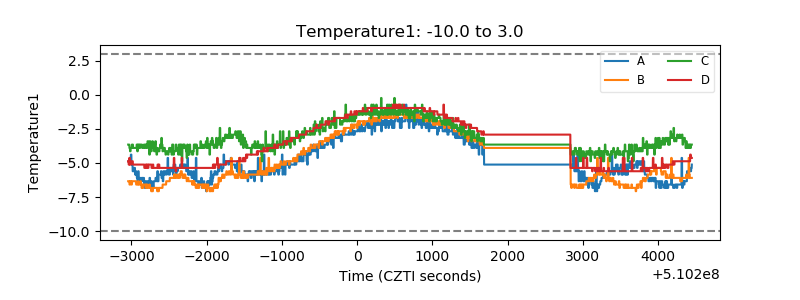 |
| Veto HV Monitor | 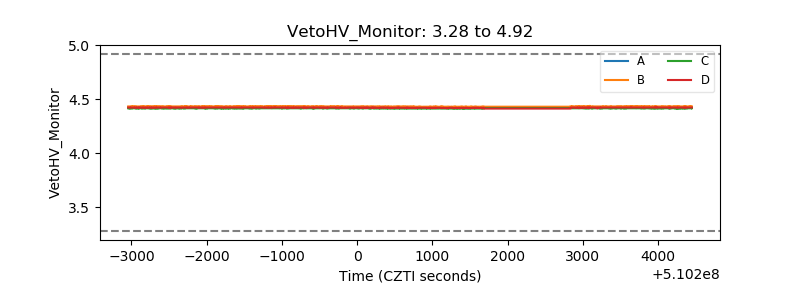 |
| Veto LLD |  |
| Alpha Counter |  |
| _CPM_Rate |  |
| CZT Counter | 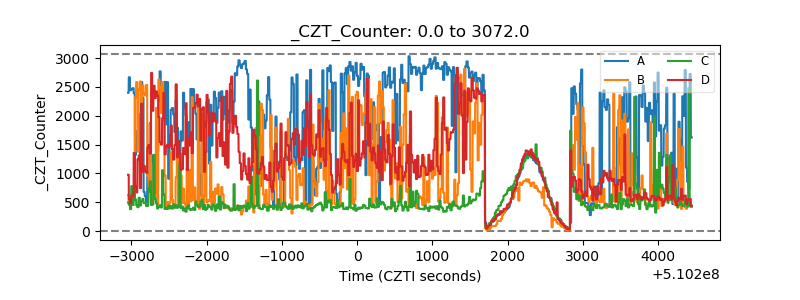 |
| +2.5 Volts monitor | 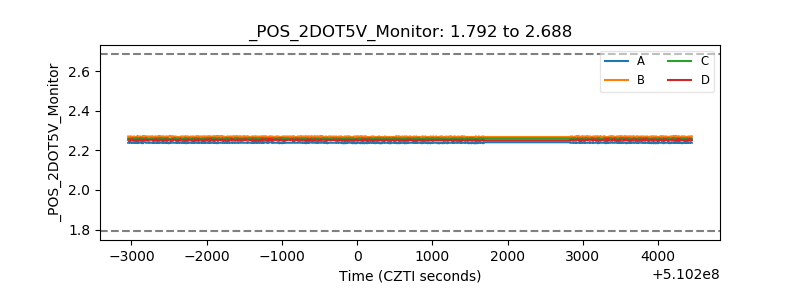 |
| +5 Volts monitor | 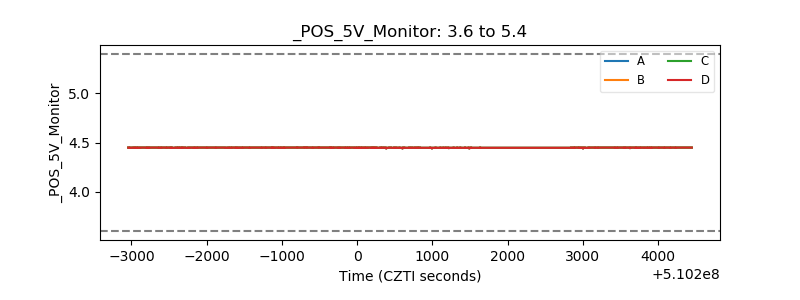 |
| _ROLL_ROT | 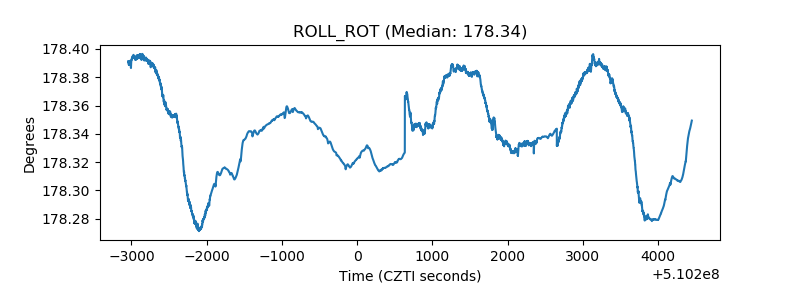 |
| _Roll_DEC | 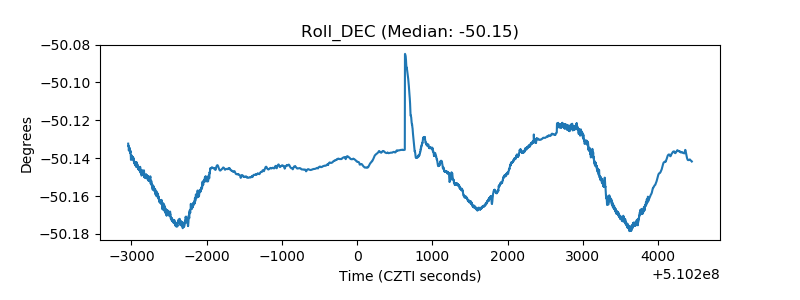 |
| _Roll_RA | 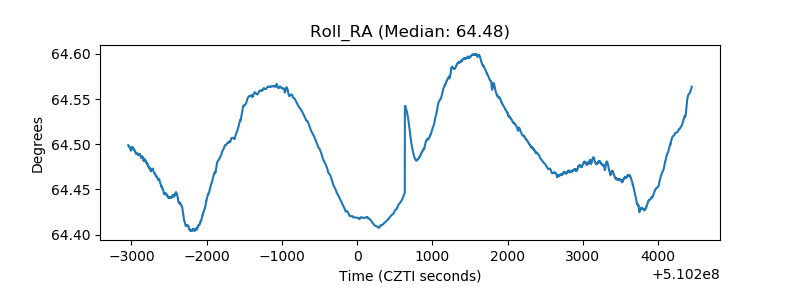 |
| Veto Counter | 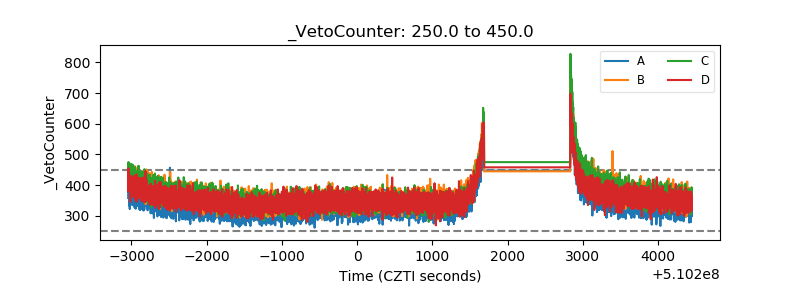 |