| Param | Original file | Final file |
|---|---|---|
| Filename | modeM0/AS1A14_083T05_9000006554_56421cztM0_level2.fits | modeM0/AS1A14_083T05_9000006554_56421cztM0_level2_quad_clean.evt |
| Size (bytes) | 711,740,160 | 72,218,880 |
| Size | 678.8 MB | 68.9 MB |
| Events in quadrant A | 10,787,591 | 305,912 |
| Events in quadrant B | 4,837,398 | 539,229 |
| Events in quadrant C | 4,921,887 | 468,486 |
| Events in quadrant D | 5,323,922 | 443,648 |
| Mode M9 | |||
|---|---|---|---|
| Quadrant | BADHDUFLAG | Total packets | Discarded packets |
| A | 0 | 10 | 0 |
| B | 0 | 10 | 0 |
| C | 0 | 10 | 0 |
| D | 0 | 10 | 0 |
| Mode SS | |||
|---|---|---|---|
| Quadrant | BADHDUFLAG | Total packets | Discarded packets |
| A | 0 | 126 | 0 |
| B | 0 | 126 | 0 |
| C | 0 | 126 | 0 |
| D | 0 | 126 | 0 |
| Mode M0 | |||
|---|---|---|---|
| Quadrant | BADHDUFLAG | Total packets | Discarded packets |
| A | 0 | 36236 | 1 |
| B | 0 | 18636 | 1 |
| C | 0 | 18884 | 3 |
| D | 0 | 20044 | 1 |
| Quadrant | Total seconds | Saturated seconds | Saturation percentage |
|---|---|---|---|
| A | 6141 | 3025 | 49.259078% |
| B | 6141 | 673 | 10.959127% |
| C | 6141 | 658 | 10.714867% |
| D | 6141 | 456 | 7.425501% |
Noise dominated data is calculated using 1-second bins in cleaned event files. If a bin has >2000 counts, and if more than 50% of those come from <1% of pixels, then it is considered to be noise-dominated and hence unusable.
| Quadrant | # 1 sec bins | Bins with >0 counts | Bins with >2000 counts | High rate bins dominated by noise | Noise dominated (total time) | Noise dominated (detector-on time) | Marked lightcurve |
|---|---|---|---|---|---|---|---|
| A | 7447 | 6232 | 2733 | 2733 | 36.70% | 43.85% |  |
| B | 7448 | 6425 | 310 | 310 | 4.16% | 4.82% |  |
| C | 7448 | 6419 | 491 | 491 | 6.59% | 7.65% |  |
| D | 7448 | 6425 | 348 | 348 | 4.67% | 5.42% |  |
Top three noisy pixels from each quadrant. If the there are fewer than three noisy pixels in the level2.evt file, extra rows are filled as -1
| Pixel properties | Quadrant properties | ||||||
|---|---|---|---|---|---|---|---|
| Quadrant | DetID | PixID | Counts | Sigma | Mean | Median | Sigma |
| A | 12 | 3 | 4015096 | 29963.91 | 537 | 524 | 134.0 |
| A | 4 | 95 | 3208058 | 23940.35 | 537 | 524 | 134.0 |
| A | 3 | 62 | 581745 | 4338.11 | 537 | 524 | 134.0 |
| B | 4 | 206 | 1924550 | 13819.99 | 651 | 628 | 139.2 |
| B | 15 | 33 | 95880 | 684.22 | 651 | 628 | 139.2 |
| B | 10 | 247 | 72152 | 513.77 | 651 | 628 | 139.2 |
| C | 15 | 147 | 1246427 | 7161.26 | 638 | 634 | 174.0 |
| C | 12 | 254 | 441860 | 2536.32 | 638 | 634 | 174.0 |
| C | 15 | 230 | 441070 | 2531.78 | 638 | 634 | 174.0 |
| D | 8 | 129 | 1347786 | 7540.2 | 637 | 609 | 178.7 |
| D | 5 | 113 | 746095 | 4172.51 | 637 | 609 | 178.7 |
| D | 2 | 249 | 211689 | 1181.42 | 637 | 609 | 178.7 |
Histogram calculated using DETX and DETY for each event in the final _common_clean file
| Quadrant A |  |
 |
Quadrant B |
|---|---|---|---|
| Quadrant D |  |
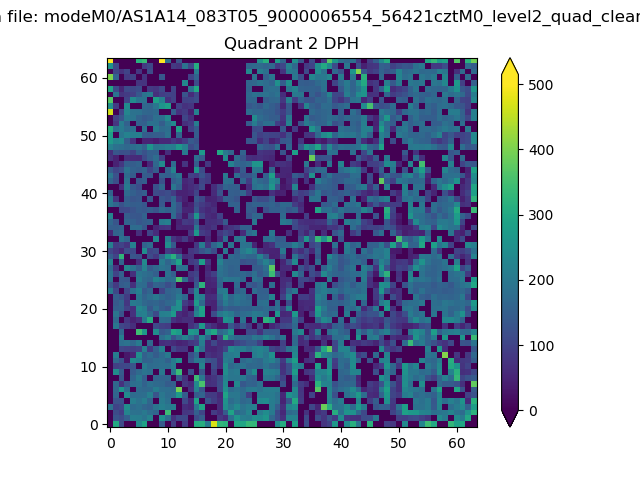 |
Quadrant C |
| Plot type | Count rate plots | Images |
|---|---|---|
| Comparison with Poisson distribution Blue bars denote a histogram of data divided into 1 sec bins. Red curve is a Poisson curve with rate = median count rate of data. |
 |
 |
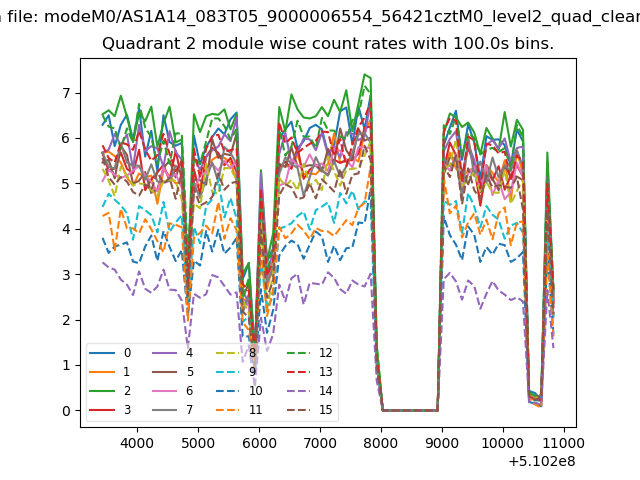
| Quadrant-wise count rates Data is divided into 100 sec bins |
 |
|
| Module-wise count rates for Quadrant A Data is divided into 100 sec bins |
 |
 |
| Module-wise count rates for Quadrant B Data is divided into 100 sec bins |
 |
 |
| Module-wise count rates for Quadrant C Data is divided into 100 sec bins |
 |
 |
| Module-wise count rates for Quadrant D Data is divided into 100 sec bins |
 |
 |
| Parameter | Plot |
|---|---|
| CZT HV Monitor | 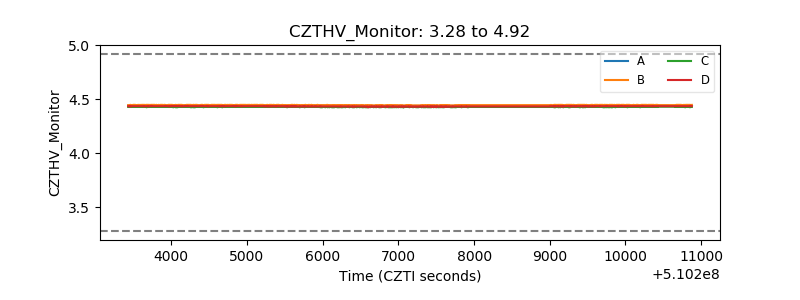 |
| D_VDD |  |
| Temperature 1 |  |
| Veto HV Monitor |  |
| Veto LLD |  |
| Alpha Counter | 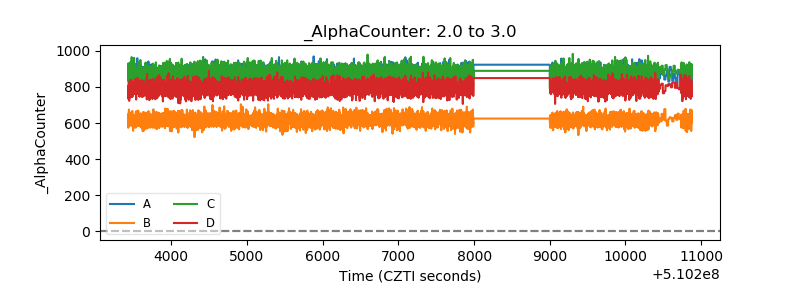 |
| _CPM_Rate |  |
| CZT Counter |  |
| +2.5 Volts monitor |  |
| +5 Volts monitor |  |
| _ROLL_ROT |  |
| _Roll_DEC |  |
| _Roll_RA |  |
| Veto Counter |  |