| Param | Original file | Final file |
|---|---|---|
| Filename | modeM0/AS1A14_083T05_9000006554_56422cztM0_level2.fits | modeM0/AS1A14_083T05_9000006554_56422cztM0_level2_quad_clean.evt |
| Size (bytes) | 925,326,720 | 72,889,920 |
| Size | 882.5 MB | 69.5 MB |
| Events in quadrant A | 11,476,611 | 336,309 |
| Events in quadrant B | 6,233,796 | 532,233 |
| Events in quadrant C | 5,255,358 | 511,696 |
| Events in quadrant D | 10,757,042 | 348,559 |
| Mode M9 | |||
|---|---|---|---|
| Quadrant | BADHDUFLAG | Total packets | Discarded packets |
| A | 0 | 7 | 0 |
| B | 0 | 7 | 0 |
| C | 0 | 7 | 0 |
| D | 0 | 7 | 0 |
| Mode SS | |||
|---|---|---|---|
| Quadrant | BADHDUFLAG | Total packets | Discarded packets |
| A | 0 | 140 | 0 |
| B | 0 | 140 | 0 |
| C | 0 | 140 | 0 |
| D | 0 | 140 | 0 |
| Mode M0 | |||
|---|---|---|---|
| Quadrant | BADHDUFLAG | Total packets | Discarded packets |
| A | 0 | 38738 | 1 |
| B | 0 | 23279 | 1 |
| C | 0 | 20362 | 1 |
| D | 0 | 36678 | 3 |
| Quadrant | Total seconds | Saturated seconds | Saturation percentage |
|---|---|---|---|
| A | 6852 | 3087 | 45.052539% |
| B | 6852 | 1294 | 18.884997% |
| C | 6853 | 600 | 8.755290% |
| D | 6852 | 2666 | 38.908348% |
Noise dominated data is calculated using 1-second bins in cleaned event files. If a bin has >2000 counts, and if more than 50% of those come from <1% of pixels, then it is considered to be noise-dominated and hence unusable.
| Quadrant | # 1 sec bins | Bins with >0 counts | Bins with >2000 counts | High rate bins dominated by noise | Noise dominated (total time) | Noise dominated (detector-on time) | Marked lightcurve |
|---|---|---|---|---|---|---|---|
| A | 7898 | 6943 | 2682 | 2682 | 33.96% | 38.63% |  |
| B | 7899 | 7134 | 687 | 687 | 8.70% | 9.63% |  |
| C | 7900 | 7129 | 442 | 442 | 5.59% | 6.20% | 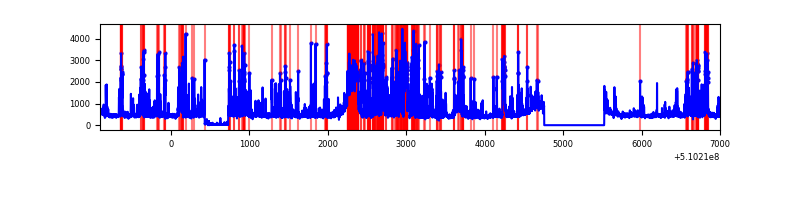 |
| D | 7899 | 7134 | 2546 | 2546 | 32.23% | 35.69% |  |
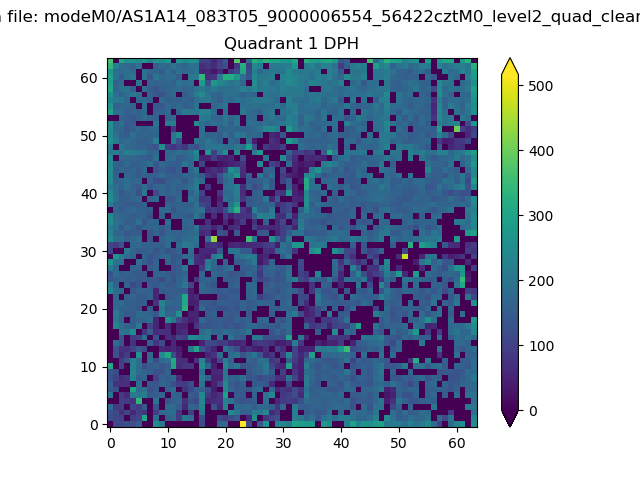
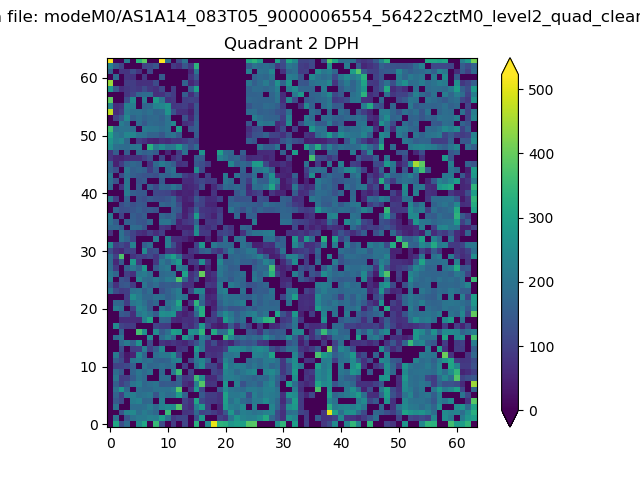
Top three noisy pixels from each quadrant. If the there are fewer than three noisy pixels in the level2.evt file, extra rows are filled as -1
| Pixel properties | Quadrant properties | ||||||
|---|---|---|---|---|---|---|---|
| Quadrant | DetID | PixID | Counts | Sigma | Mean | Median | Sigma |
| A | 12 | 3 | 5097918 | 34429.38 | 596 | 580 | 148.1 |
| A | 4 | 95 | 2123010 | 14335.71 | 596 | 580 | 148.1 |
| A | 3 | 62 | 875996 | 5912.9 | 596 | 580 | 148.1 |
| B | 4 | 206 | 3049864 | 20560.81 | 689 | 664 | 148.3 |
| B | 10 | 247 | 165561 | 1111.9 | 689 | 664 | 148.3 |
| B | 0 | 63 | 66011 | 440.64 | 689 | 664 | 148.3 |
| C | 12 | 254 | 1000180 | 5124.41 | 715 | 709 | 195.0 |
| C | 15 | 147 | 990509 | 5074.83 | 715 | 709 | 195.0 |
| C | 15 | 230 | 160647 | 820.02 | 715 | 709 | 195.0 |
| D | 8 | 129 | 5642840 | 33646.99 | 594 | 567 | 167.7 |
| D | 5 | 113 | 913741 | 5445.6 | 594 | 567 | 167.7 |
| D | 3 | 12 | 546024 | 3252.76 | 594 | 567 | 167.7 |
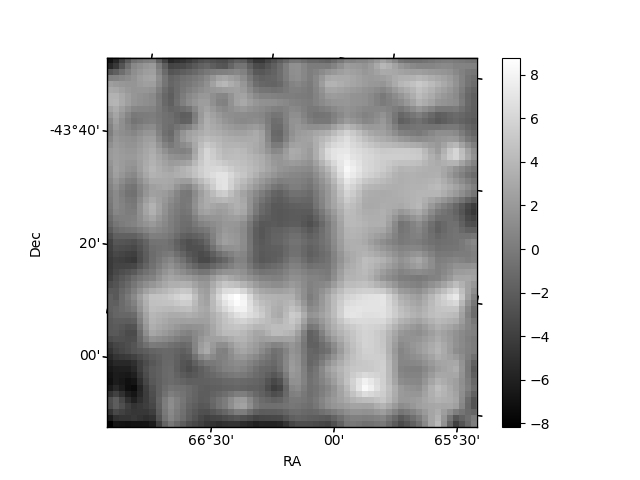
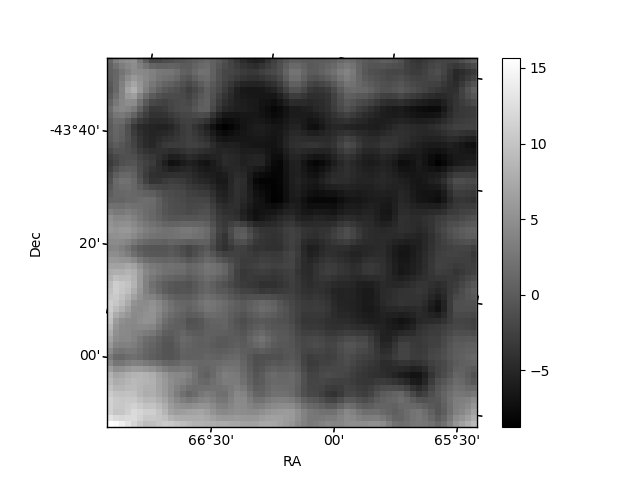
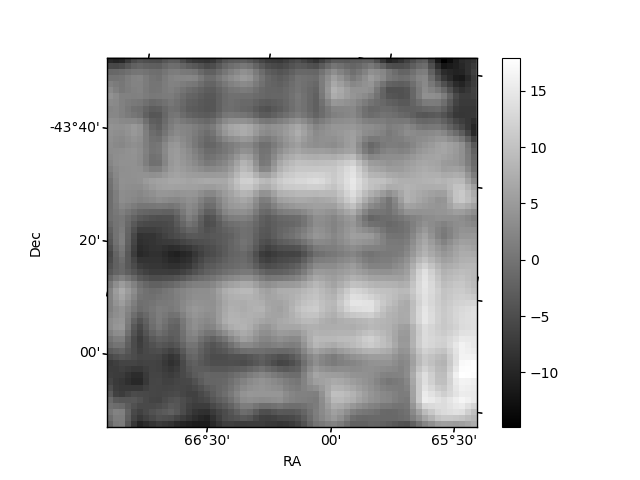
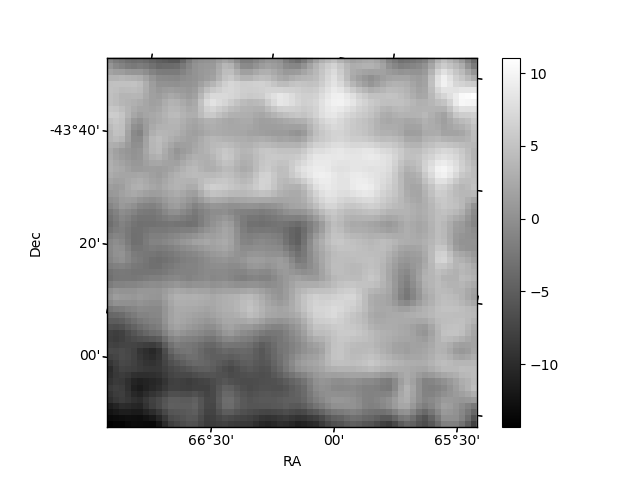
Histogram calculated using DETX and DETY for each event in the final _common_clean file
| Quadrant A | 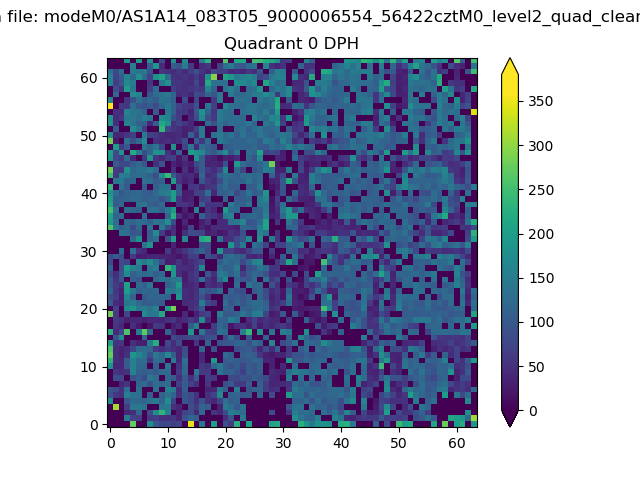 |
 |
Quadrant B |
|---|---|---|---|
| Quadrant D |  |
 |
Quadrant C |
| Plot type | Count rate plots | Images |
|---|---|---|
| Comparison with Poisson distribution Blue bars denote a histogram of data divided into 1 sec bins. Red curve is a Poisson curve with rate = median count rate of data. |
 |
 |
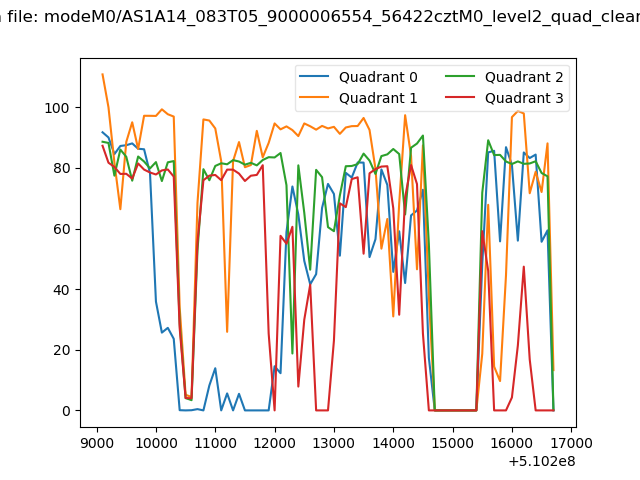
| Quadrant-wise count rates Data is divided into 100 sec bins |
 |
|
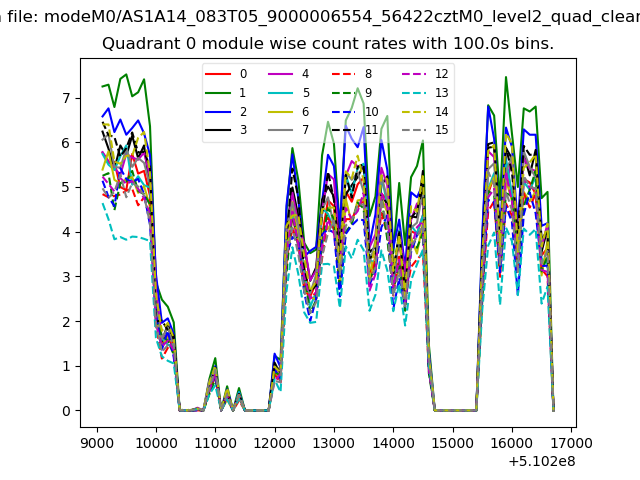
| Module-wise count rates for Quadrant A Data is divided into 100 sec bins |
 |
 |
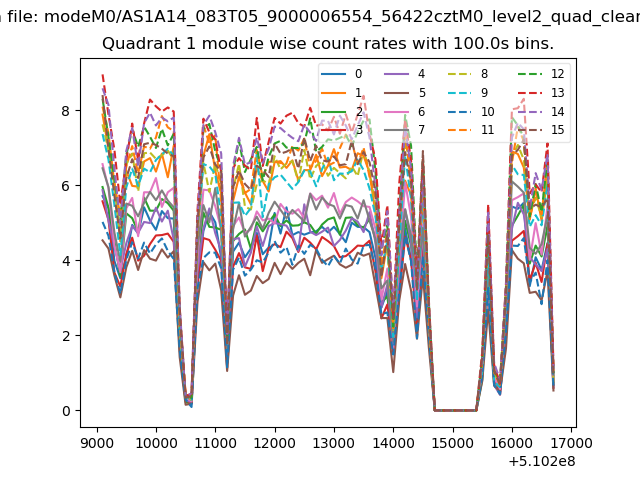
| Module-wise count rates for Quadrant B Data is divided into 100 sec bins |
 |
 |
| Module-wise count rates for Quadrant C Data is divided into 100 sec bins |
 |
 |
| Module-wise count rates for Quadrant D Data is divided into 100 sec bins |
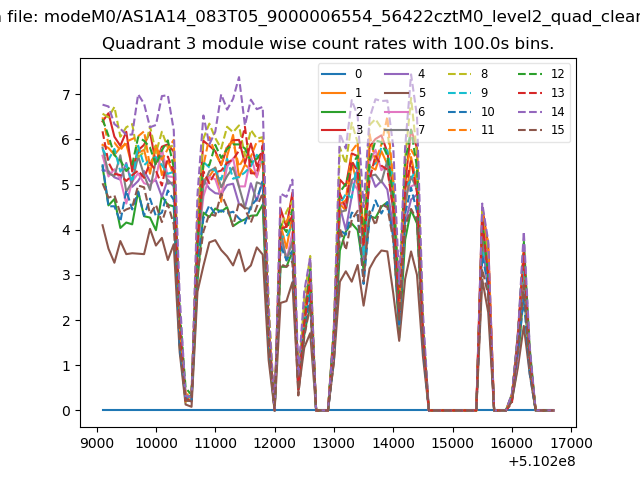 |
 |
| Parameter | Plot |
|---|---|
| CZT HV Monitor | 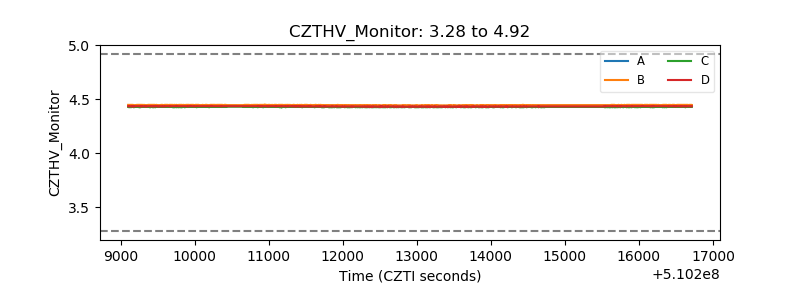 |
| D_VDD | 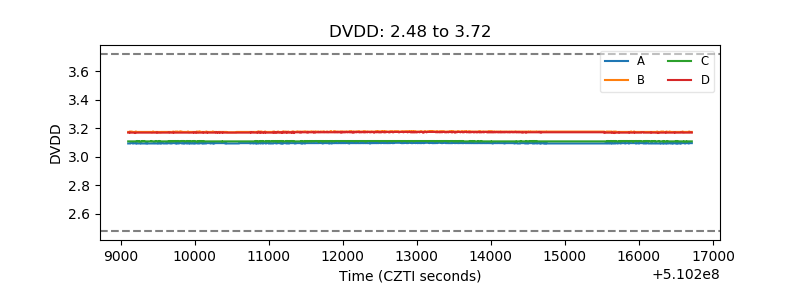 |
| Temperature 1 | 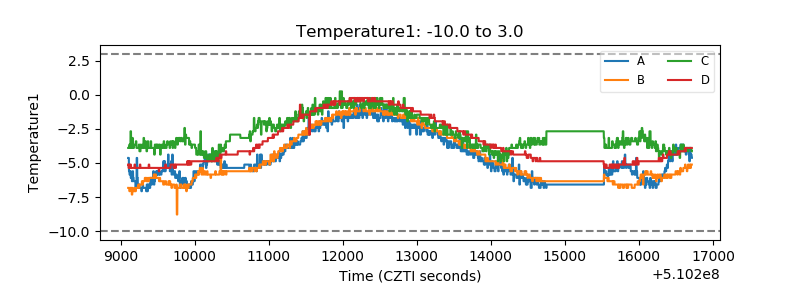 |
| Veto HV Monitor | 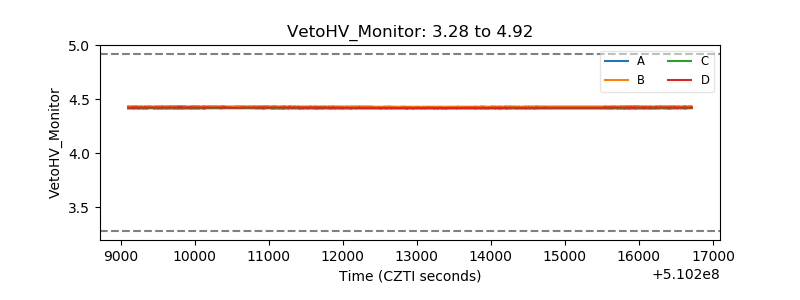 |
| Veto LLD | 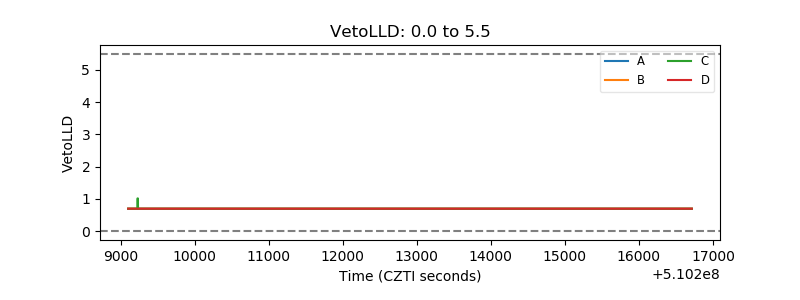 |
| Alpha Counter |  |
| _CPM_Rate |  |
| CZT Counter | 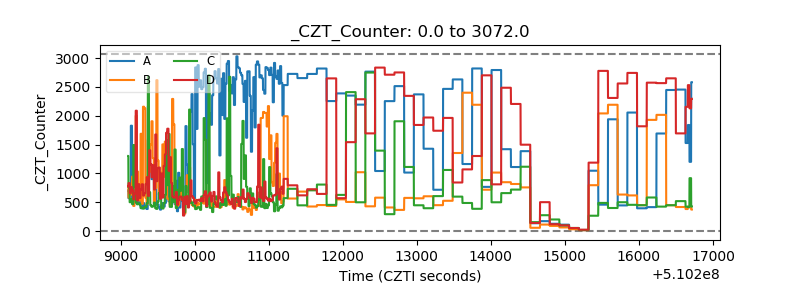 |
| +2.5 Volts monitor | 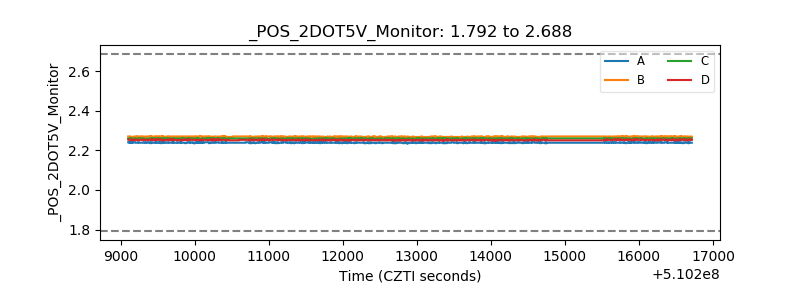 |
| +5 Volts monitor |  |
| _ROLL_ROT | 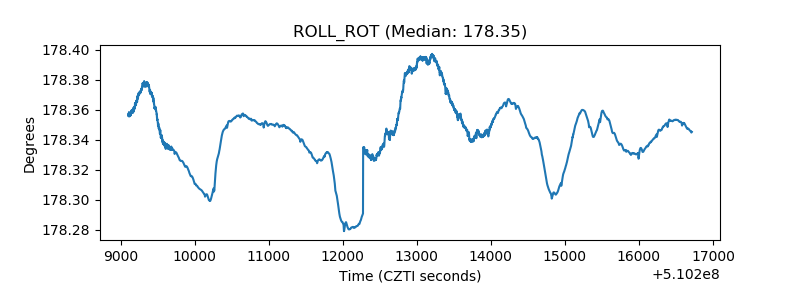 |
| _Roll_DEC | 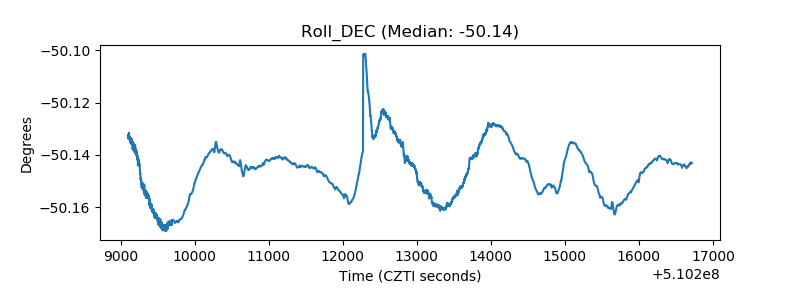 |
| _Roll_RA |  |
| Veto Counter | 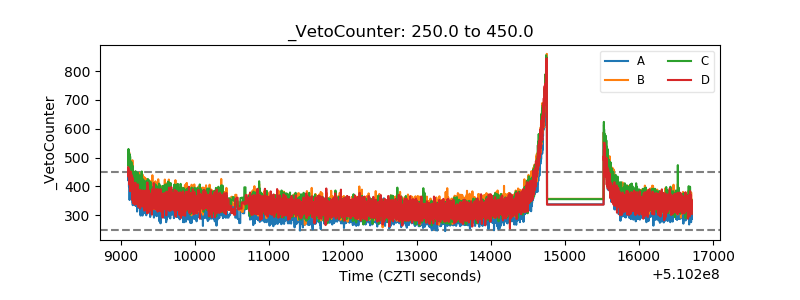 |