| Param | Original file | Final file |
|---|---|---|
| Filename | modeM0/AS1A14_083T05_9000006554_56425cztM0_level2.fits | modeM0/AS1A14_083T05_9000006554_56425cztM0_level2_quad_clean.evt |
| Size (bytes) | 817,574,400 | 88,277,760 |
| Size | 779.7 MB | 84.2 MB |
| Events in quadrant A | 10,784,911 | 429,537 |
| Events in quadrant B | 6,126,511 | 651,711 |
| Events in quadrant C | 5,496,408 | 594,871 |
| Events in quadrant D | 7,307,024 | 502,354 |
| Mode SS | |||
|---|---|---|---|
| Quadrant | BADHDUFLAG | Total packets | Discarded packets |
| A | 0 | 142 | 0 |
| B | 0 | 142 | 0 |
| C | 0 | 142 | 0 |
| D | 0 | 142 | 0 |
| Mode M0 | |||
|---|---|---|---|
| Quadrant | BADHDUFLAG | Total packets | Discarded packets |
| A | 0 | 36982 | 0 |
| B | 0 | 23078 | 0 |
| C | 0 | 21317 | 0 |
| D | 0 | 26515 | 0 |
| Quadrant | Total seconds | Saturated seconds | Saturation percentage |
|---|---|---|---|
| A | 7093 | 2691 | 37.938813% |
| B | 7093 | 924 | 13.026928% |
| C | 7094 | 635 | 8.951226% |
| D | 7093 | 1263 | 17.806288% |
Noise dominated data is calculated using 1-second bins in cleaned event files. If a bin has >2000 counts, and if more than 50% of those come from <1% of pixels, then it is considered to be noise-dominated and hence unusable.
| Quadrant | # 1 sec bins | Bins with >0 counts | Bins with >2000 counts | High rate bins dominated by noise | Noise dominated (total time) | Noise dominated (detector-on time) | Marked lightcurve |
|---|---|---|---|---|---|---|---|
| A | 7093 | 7093 | 2403 | 2403 | 33.88% | 33.88% |  |
| B | 7093 | 7093 | 556 | 556 | 7.84% | 7.84% |  |
| C | 7094 | 7094 | 476 | 476 | 6.71% | 6.71% |  |
| D | 7093 | 7093 | 1118 | 1118 | 15.76% | 15.76% | 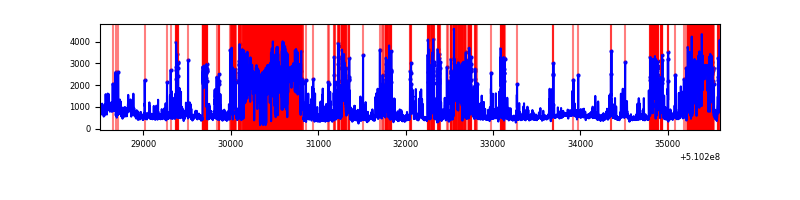 |
Top three noisy pixels from each quadrant. If the there are fewer than three noisy pixels in the level2.evt file, extra rows are filled as -1
| Pixel properties | Quadrant properties | ||||||
|---|---|---|---|---|---|---|---|
| Quadrant | DetID | PixID | Counts | Sigma | Mean | Median | Sigma |
| A | 12 | 3 | 5379275 | 34547.92 | 616 | 600 | 155.7 |
| A | 4 | 249 | 1008641 | 6474.78 | 616 | 600 | 155.7 |
| A | 12 | 194 | 687609 | 4412.75 | 616 | 600 | 155.7 |
| B | 4 | 206 | 2598945 | 16705.87 | 724 | 697 | 155.5 |
| B | 4 | 171 | 150710 | 964.53 | 724 | 697 | 155.5 |
| B | 10 | 247 | 118828 | 759.54 | 724 | 697 | 155.5 |
| C | 12 | 254 | 1172317 | 6000.81 | 711 | 703 | 195.2 |
| C | 15 | 147 | 549761 | 2812.18 | 711 | 703 | 195.2 |
| C | 15 | 215 | 457360 | 2338.92 | 711 | 703 | 195.2 |
| D | 8 | 129 | 3459830 | 18116.01 | 666 | 635 | 190.9 |
| D | 11 | 176 | 477460 | 2497.16 | 666 | 635 | 190.9 |
| D | 11 | 247 | 139318 | 726.29 | 666 | 635 | 190.9 |
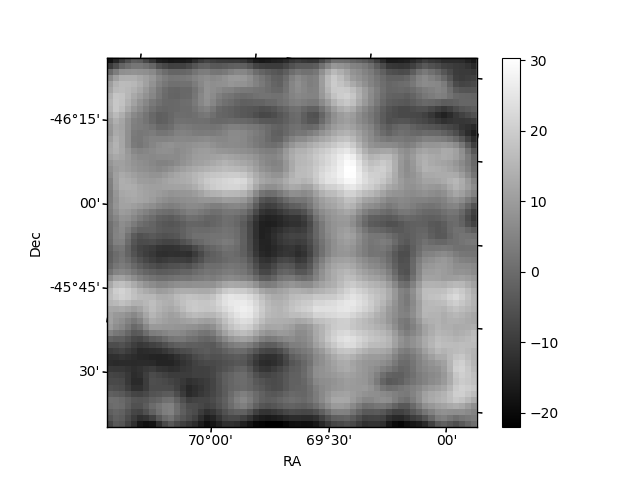
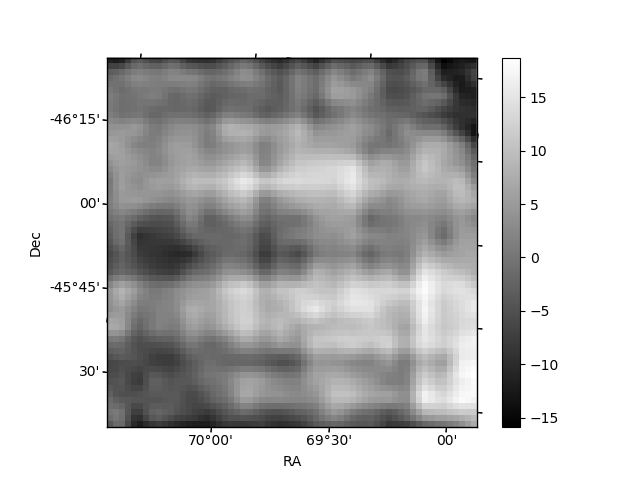
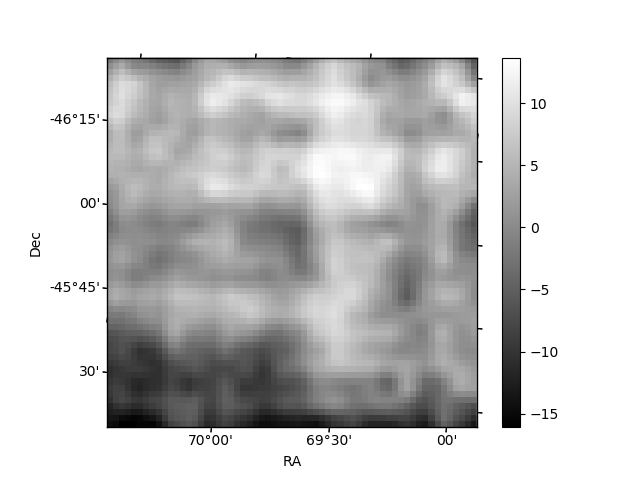
Histogram calculated using DETX and DETY for each event in the final _common_clean file
| Quadrant A |  |
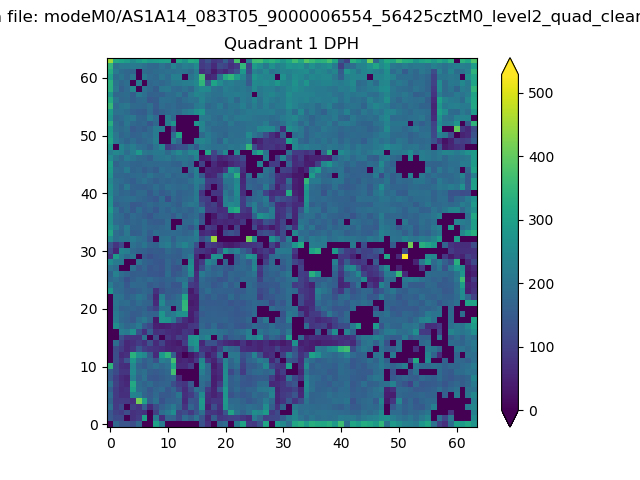 |
Quadrant B |
|---|---|---|---|
| Quadrant D |  |
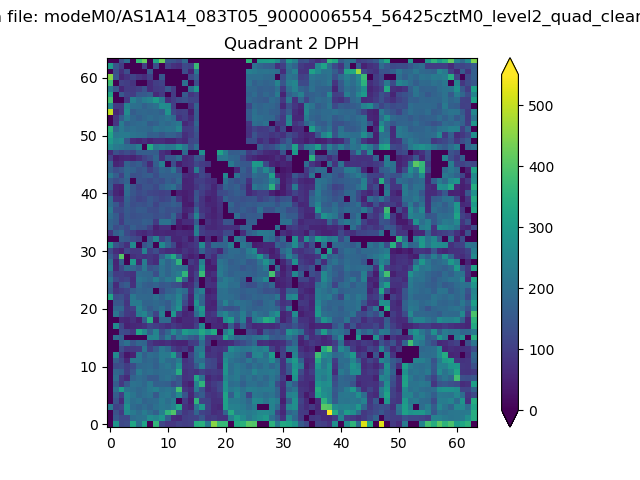 |
Quadrant C |
| Plot type | Count rate plots | Images |
|---|---|---|
| Comparison with Poisson distribution Blue bars denote a histogram of data divided into 1 sec bins. Red curve is a Poisson curve with rate = median count rate of data. |
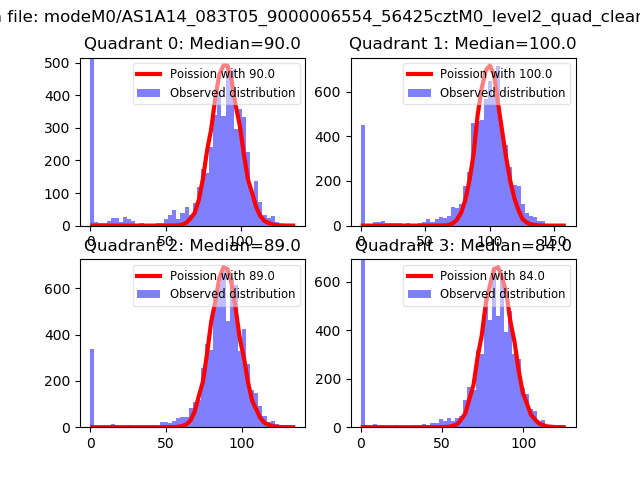 |
 |
| Quadrant-wise count rates Data is divided into 100 sec bins |
 |
|
| Module-wise count rates for Quadrant A Data is divided into 100 sec bins |
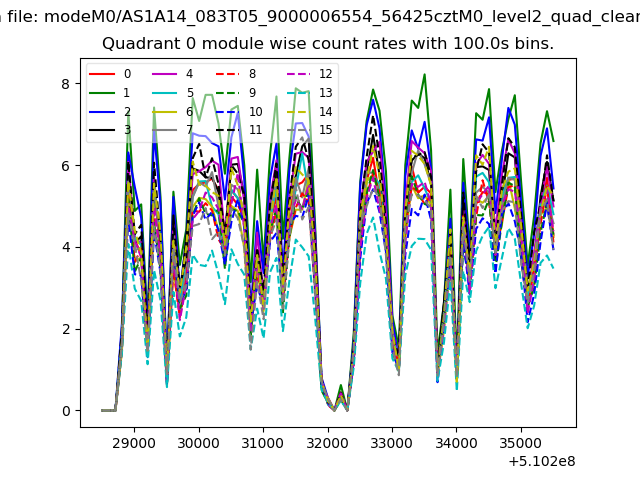 |
 |
| Module-wise count rates for Quadrant B Data is divided into 100 sec bins |
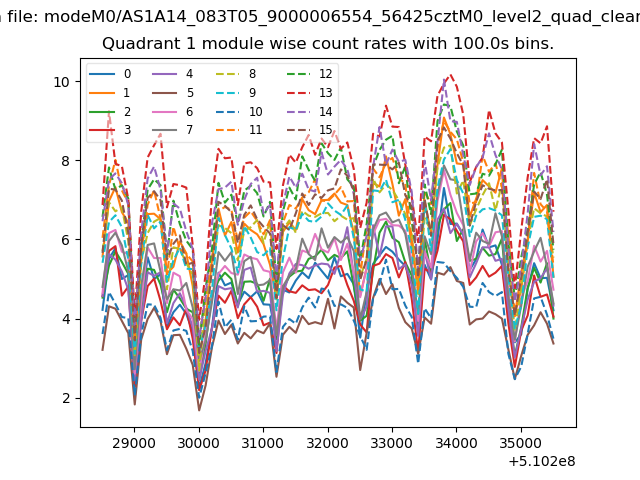 |
 |
| Module-wise count rates for Quadrant C Data is divided into 100 sec bins |
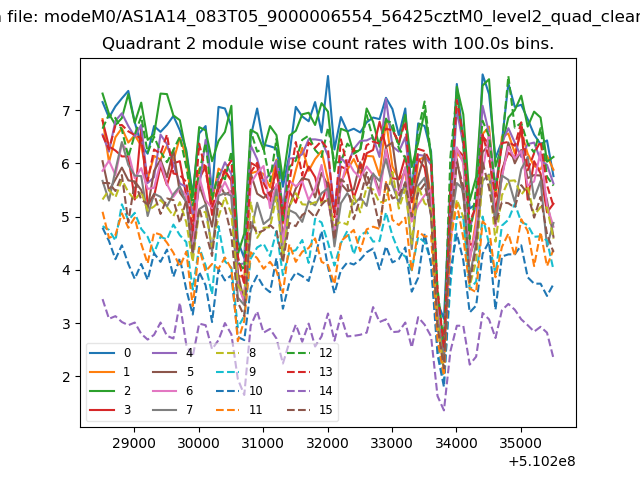 |
 |
| Module-wise count rates for Quadrant D Data is divided into 100 sec bins |
 |
 |
| Parameter | Plot |
|---|---|
| CZT HV Monitor | 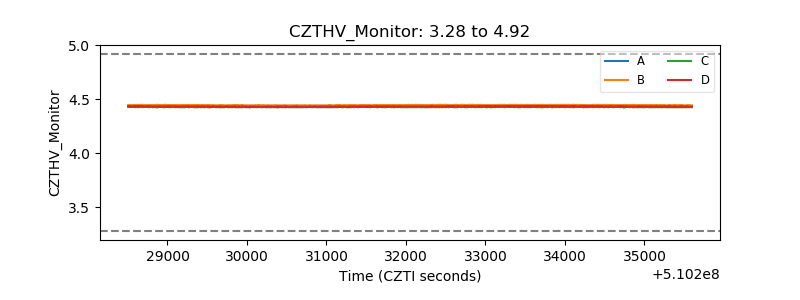 |
| D_VDD |  |
| Temperature 1 | 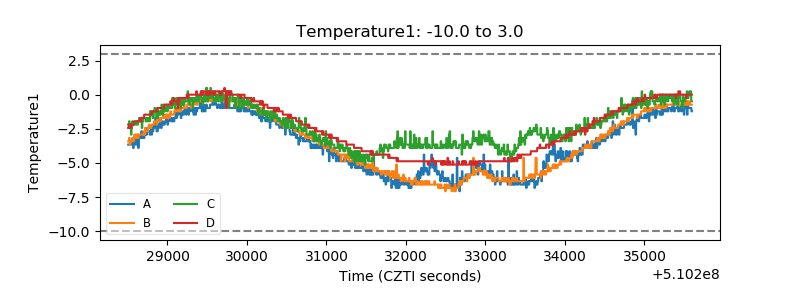 |
| Veto HV Monitor | 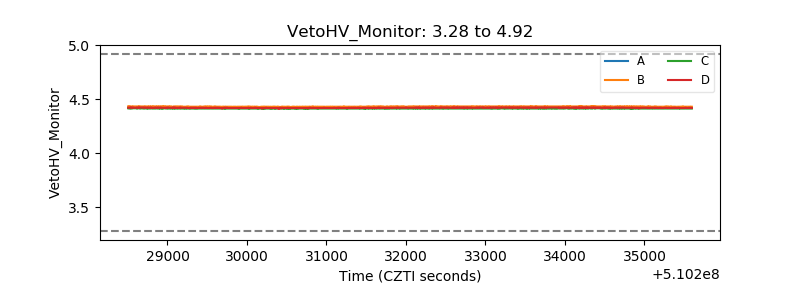 |
| Veto LLD |  |
| Alpha Counter |  |
| _CPM_Rate | 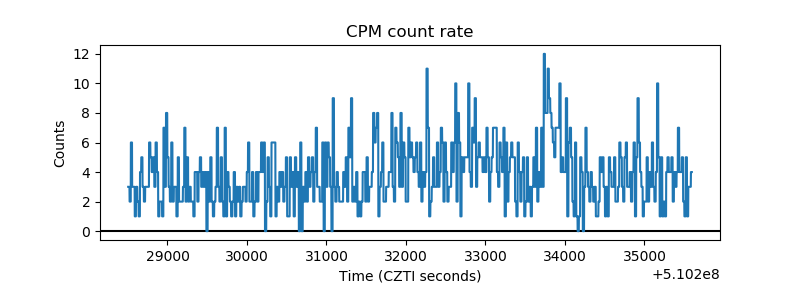 |
| CZT Counter | 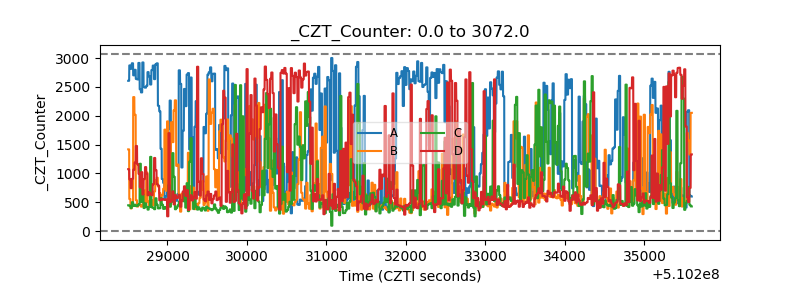 |
| +2.5 Volts monitor | 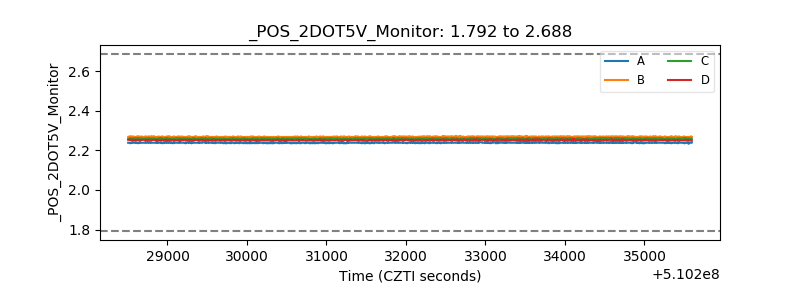 |
| +5 Volts monitor | 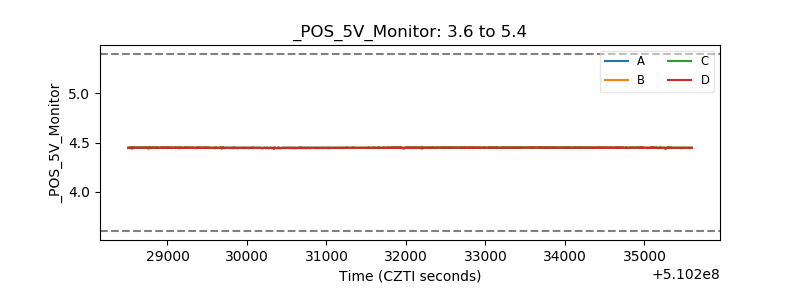 |
| _ROLL_ROT |  |
| _Roll_DEC | 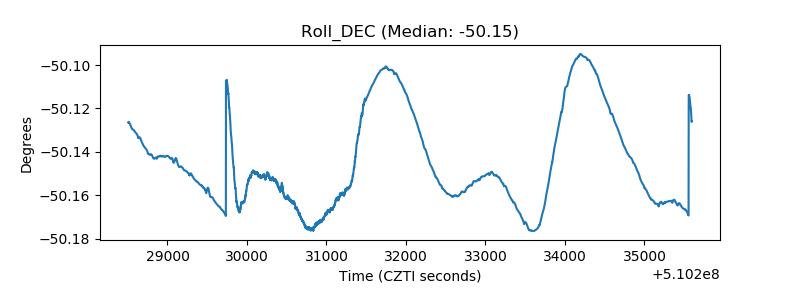 |
| _Roll_RA |  |
| Veto Counter | 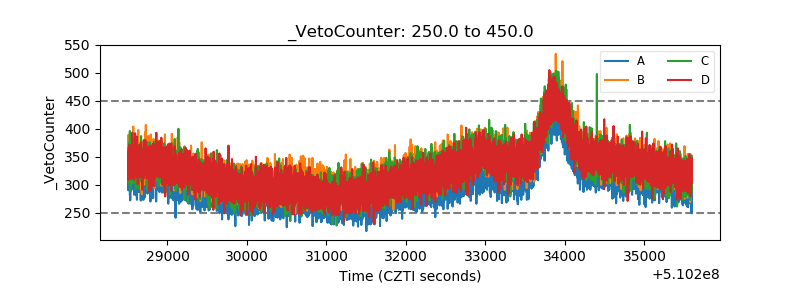 |