| Param | Original file | Final file |
|---|---|---|
| Filename | modeM0/AS1A14_083T05_9000006554_56428cztM0_level2.fits | modeM0/AS1A14_083T05_9000006554_56428cztM0_level2_quad_clean.evt |
| Size (bytes) | 1,937,151,360 | 227,465,280 |
| Size | 1.8 GB | 216.9 MB |
| Events in quadrant A | 22,480,205 | 1,281,622 |
| Events in quadrant B | 16,361,606 | 1,552,273 |
| Events in quadrant C | 12,933,843 | 1,562,246 |
| Events in quadrant D | 18,505,209 | 1,215,735 |
| Mode M9 | |||
|---|---|---|---|
| Quadrant | BADHDUFLAG | Total packets | Discarded packets |
| A | 0 | 10 | 0 |
| B | 0 | 10 | 0 |
| C | 0 | 10 | 0 |
| D | 0 | 10 | 0 |
| Mode SS | |||
|---|---|---|---|
| Quadrant | BADHDUFLAG | Total packets | Discarded packets |
| A | 0 | 376 | 0 |
| B | 0 | 376 | 0 |
| C | 0 | 376 | 0 |
| D | 0 | 376 | 0 |
| Mode M0 | |||
|---|---|---|---|
| Quadrant | BADHDUFLAG | Total packets | Discarded packets |
| A | 0 | 79508 | 2 |
| B | 0 | 61440 | 2 |
| C | 0 | 51344 | 2 |
| D | 0 | 67787 | 2 |
| Quadrant | Total seconds | Saturated seconds | Saturation percentage |
|---|---|---|---|
| A | 18476 | 4784 | 25.893050% |
| B | 18477 | 3021 | 16.350057% |
| C | 18477 | 1057 | 5.720626% |
| D | 18477 | 3615 | 19.564864% |
Noise dominated data is calculated using 1-second bins in cleaned event files. If a bin has >2000 counts, and if more than 50% of those come from <1% of pixels, then it is considered to be noise-dominated and hence unusable.
| Quadrant | # 1 sec bins | Bins with >0 counts | Bins with >2000 counts | High rate bins dominated by noise | Noise dominated (total time) | Noise dominated (detector-on time) | Marked lightcurve |
|---|---|---|---|---|---|---|---|
| A | 19571 | 18478 | 4370 | 4370 | 22.33% | 23.65% |  |
| B | 19572 | 18478 | 1874 | 1874 | 9.57% | 10.14% |  |
| C | 19572 | 18479 | 846 | 846 | 4.32% | 4.58% | 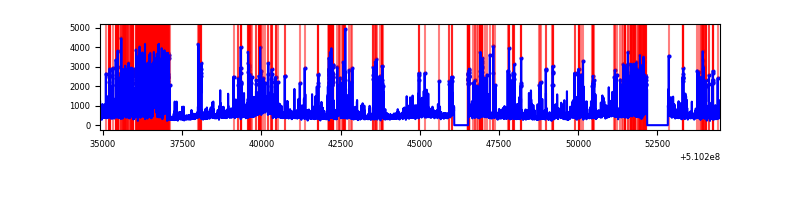 |
| D | 19572 | 18479 | 2902 | 2902 | 14.83% | 15.70% |  |
Top three noisy pixels from each quadrant. If the there are fewer than three noisy pixels in the level2.evt file, extra rows are filled as -1
| Pixel properties | Quadrant properties | ||||||
|---|---|---|---|---|---|---|---|
| Quadrant | DetID | PixID | Counts | Sigma | Mean | Median | Sigma |
| A | 12 | 3 | 10297545 | 23782.96 | 1748 | 1701 | 432.9 |
| A | 12 | 194 | 1303639 | 3007.42 | 1748 | 1701 | 432.9 |
| A | 4 | 249 | 1130079 | 2606.5 | 1748 | 1701 | 432.9 |
| B | 4 | 206 | 6076765 | 15410.41 | 1848 | 1782 | 394.2 |
| B | 4 | 171 | 902526 | 2284.92 | 1848 | 1782 | 394.2 |
| B | 10 | 247 | 445612 | 1125.86 | 1848 | 1782 | 394.2 |
| C | 12 | 254 | 3385368 | 6653.52 | 1875 | 1860 | 508.5 |
| C | 13 | 3 | 388561 | 760.43 | 1875 | 1860 | 508.5 |
| C | 1 | 16 | 387939 | 759.21 | 1875 | 1860 | 508.5 |
| D | 8 | 129 | 8252344 | 17083.9 | 1705 | 1625 | 483.0 |
| D | 3 | 12 | 706072 | 1458.62 | 1705 | 1625 | 483.0 |
| D | 2 | 249 | 610685 | 1261.12 | 1705 | 1625 | 483.0 |
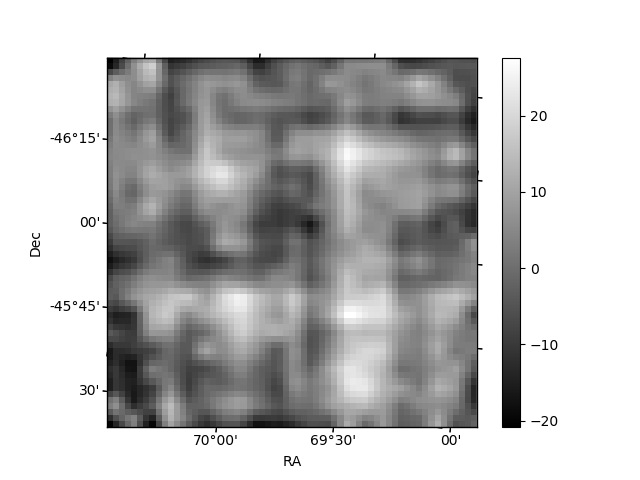
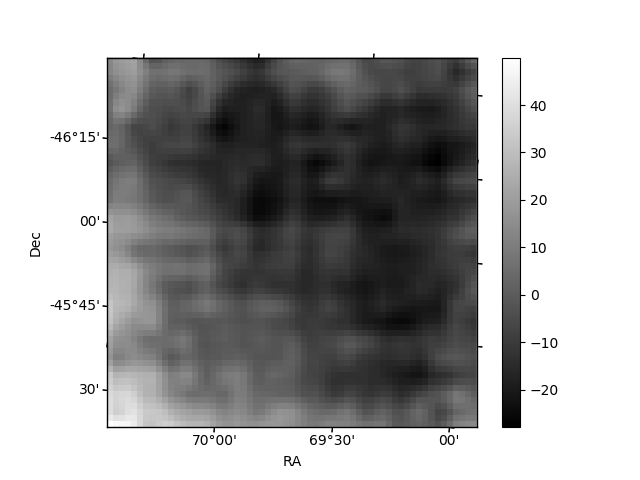
Histogram calculated using DETX and DETY for each event in the final _common_clean file
| Quadrant A | 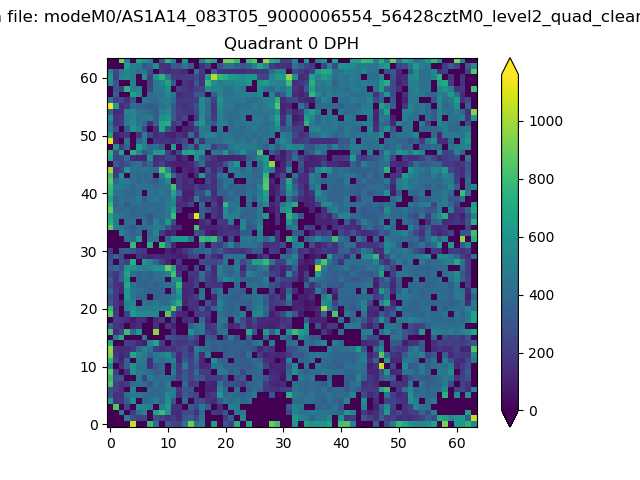 |
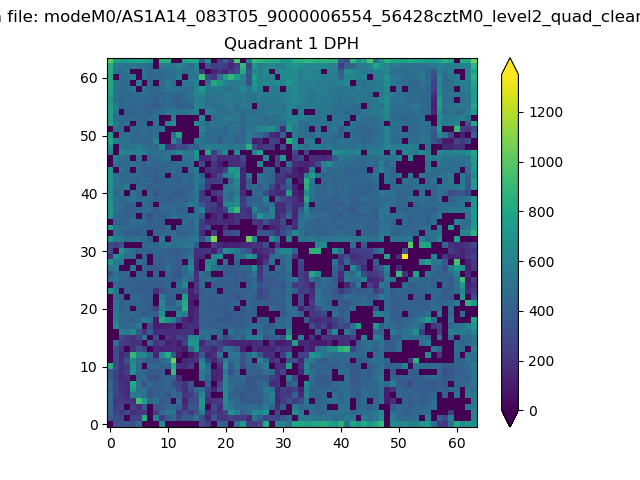 |
Quadrant B |
|---|---|---|---|
| Quadrant D |  |
 |
Quadrant C |
| Plot type | Count rate plots | Images |
|---|---|---|
| Comparison with Poisson distribution Blue bars denote a histogram of data divided into 1 sec bins. Red curve is a Poisson curve with rate = median count rate of data. |
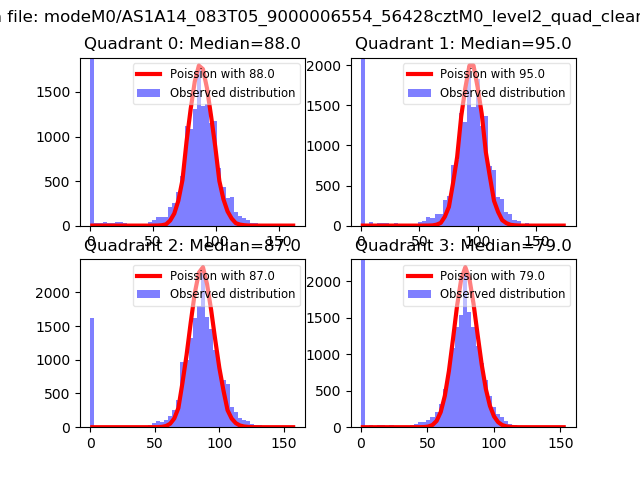 |
 |
| Quadrant-wise count rates Data is divided into 100 sec bins |
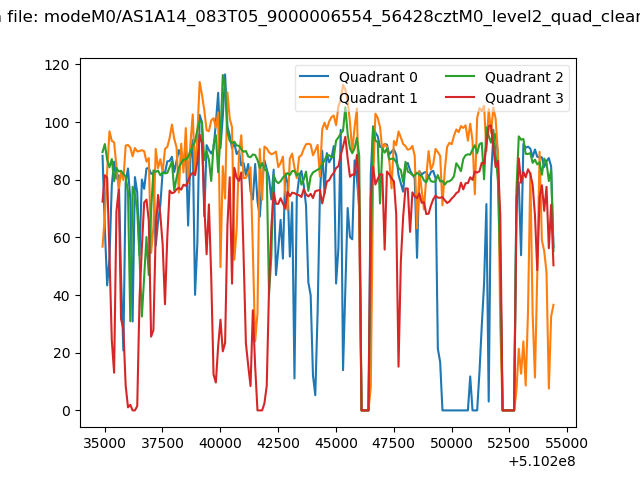 |
|
| Module-wise count rates for Quadrant A Data is divided into 100 sec bins |
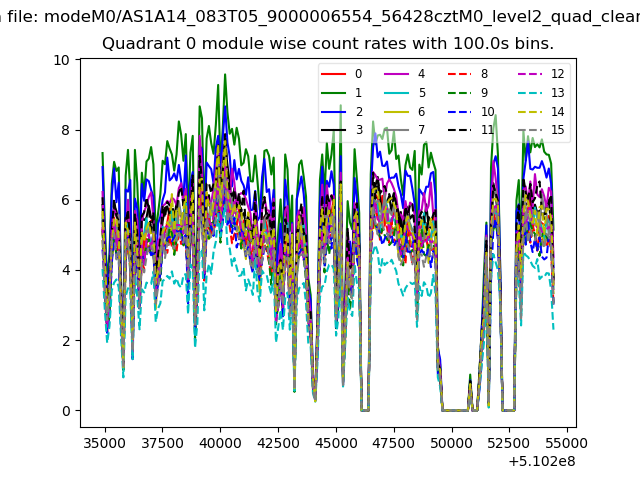 |
 |
| Module-wise count rates for Quadrant B Data is divided into 100 sec bins |
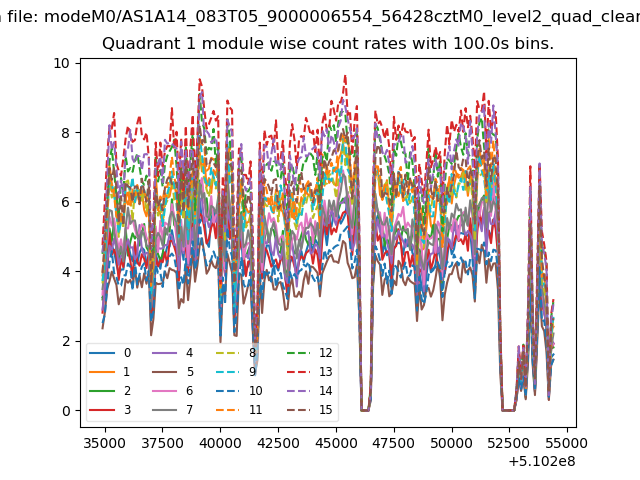 |
 |
| Module-wise count rates for Quadrant C Data is divided into 100 sec bins |
 |
 |
| Module-wise count rates for Quadrant D Data is divided into 100 sec bins |
 |
 |
| Parameter | Plot |
|---|---|
| CZT HV Monitor |  |
| D_VDD |  |
| Temperature 1 |  |
| Veto HV Monitor | 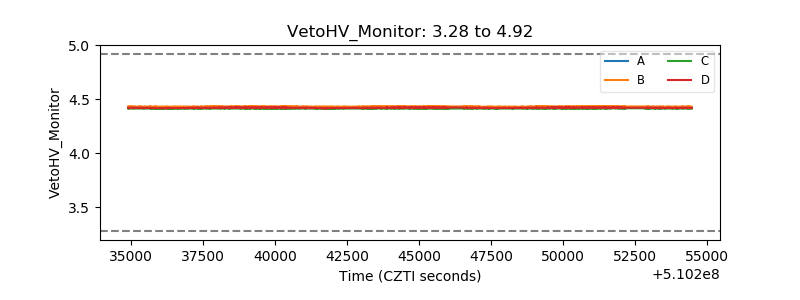 |
| Veto LLD | 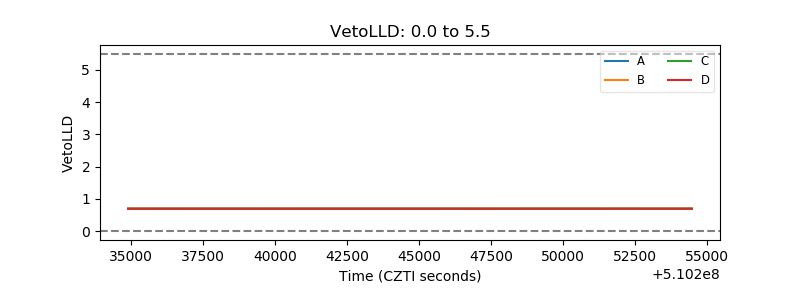 |
| Alpha Counter |  |
| _CPM_Rate | 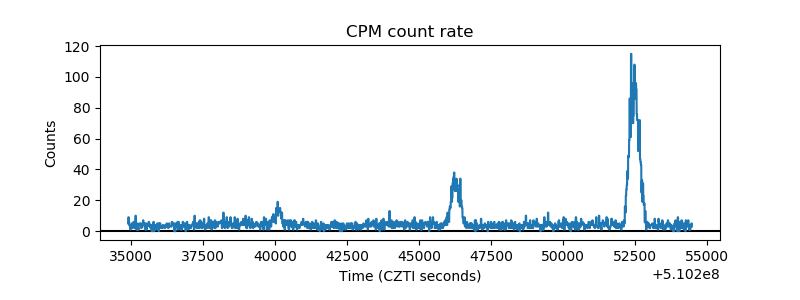 |
| CZT Counter |  |
| +2.5 Volts monitor |  |
| +5 Volts monitor |  |
| _ROLL_ROT | 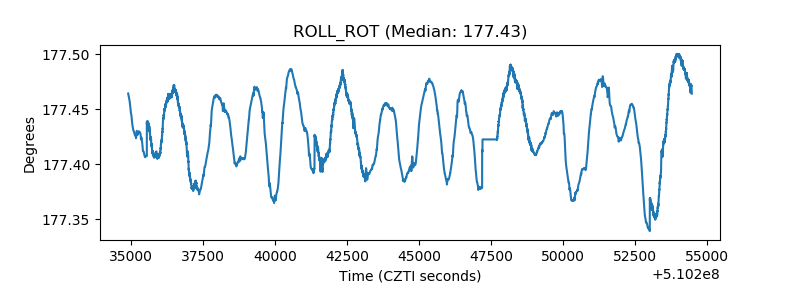 |
| _Roll_DEC | 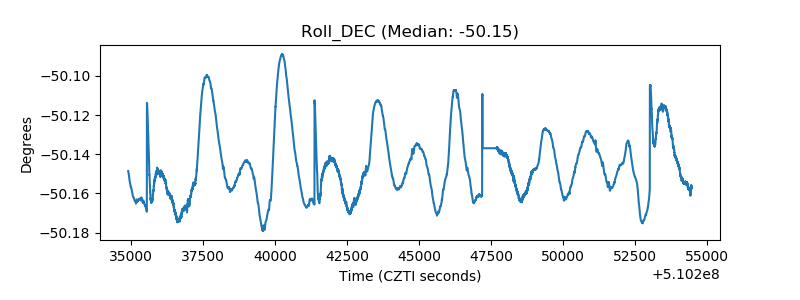 |
| _Roll_RA | 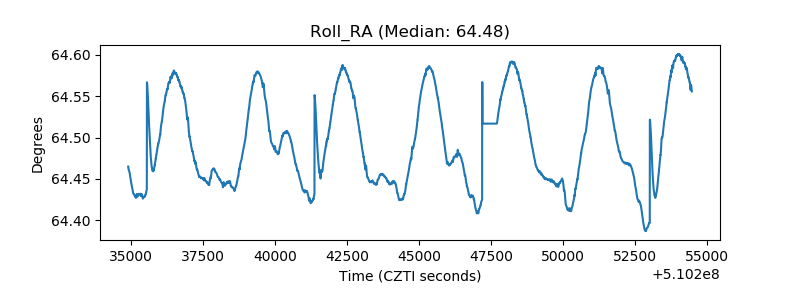 |
| Veto Counter | 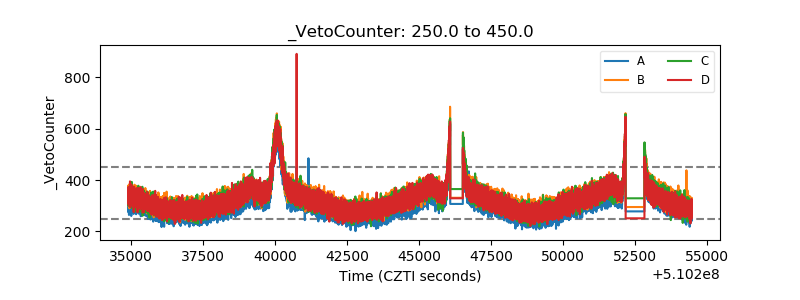 |