| Param | Original file | Final file |
|---|---|---|
| Filename | modeM0/AS1A14_083T05_9000006554_56429cztM0_level2.fits | modeM0/AS1A14_083T05_9000006554_56429cztM0_level2_quad_clean.evt |
| Size (bytes) | 661,705,920 | 86,103,360 |
| Size | 631.1 MB | 82.1 MB |
| Events in quadrant A | 5,296,947 | 579,435 |
| Events in quadrant B | 6,710,016 | 535,225 |
| Events in quadrant C | 5,547,804 | 532,577 |
| Events in quadrant D | 6,423,016 | 495,527 |
| Mode M9 | |||
|---|---|---|---|
| Quadrant | BADHDUFLAG | Total packets | Discarded packets |
| A | 0 | 8 | 0 |
| B | 0 | 8 | 0 |
| C | 0 | 8 | 0 |
| D | 0 | 8 | 0 |
| Mode SS | |||
|---|---|---|---|
| Quadrant | BADHDUFLAG | Total packets | Discarded packets |
| A | 0 | 134 | 0 |
| B | 0 | 134 | 0 |
| C | 0 | 134 | 0 |
| D | 0 | 134 | 0 |
| Mode M0 | |||
|---|---|---|---|
| Quadrant | BADHDUFLAG | Total packets | Discarded packets |
| A | 0 | 20541 | 2 |
| B | 0 | 24480 | 1 |
| C | 0 | 21232 | 1 |
| D | 0 | 23780 | 1 |
| Quadrant | Total seconds | Saturated seconds | Saturation percentage |
|---|---|---|---|
| A | 6658 | 609 | 9.146891% |
| B | 6658 | 1524 | 22.889757% |
| C | 6659 | 755 | 11.338039% |
| D | 6659 | 870 | 13.065025% |
Noise dominated data is calculated using 1-second bins in cleaned event files. If a bin has >2000 counts, and if more than 50% of those come from <1% of pixels, then it is considered to be noise-dominated and hence unusable.
| Quadrant | # 1 sec bins | Bins with >0 counts | Bins with >2000 counts | High rate bins dominated by noise | Noise dominated (total time) | Noise dominated (detector-on time) | Marked lightcurve |
|---|---|---|---|---|---|---|---|
| A | 7473 | 6659 | 518 | 518 | 6.93% | 7.78% |  |
| B | 7473 | 6659 | 1072 | 1072 | 14.34% | 16.10% |  |
| C | 7474 | 6660 | 606 | 606 | 8.11% | 9.10% | 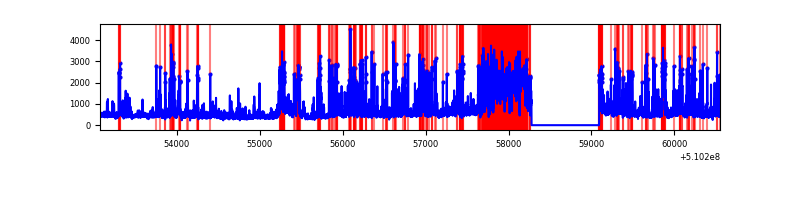 |
| D | 7474 | 6660 | 950 | 950 | 12.71% | 14.26% |  |
Top three noisy pixels from each quadrant. If the there are fewer than three noisy pixels in the level2.evt file, extra rows are filled as -1
| Pixel properties | Quadrant properties | ||||||
|---|---|---|---|---|---|---|---|
| Quadrant | DetID | PixID | Counts | Sigma | Mean | Median | Sigma |
| A | 3 | 62 | 1336161 | 7941.21 | 677 | 660 | 168.2 |
| A | 12 | 3 | 353996 | 2101.02 | 677 | 660 | 168.2 |
| A | 8 | 249 | 309849 | 1838.51 | 677 | 660 | 168.2 |
| B | 4 | 206 | 3524092 | 25882.93 | 632 | 610 | 136.1 |
| B | 5 | 185 | 317729 | 2329.5 | 632 | 610 | 136.1 |
| B | 4 | 171 | 76819 | 559.82 | 632 | 610 | 136.1 |
| C | 12 | 254 | 1710604 | 9757.96 | 632 | 627 | 175.2 |
| C | 15 | 230 | 395622 | 2254.03 | 632 | 627 | 175.2 |
| C | 15 | 147 | 229675 | 1307.06 | 632 | 627 | 175.2 |
| D | 8 | 160 | 1763485 | 9620.62 | 643 | 615 | 183.2 |
| D | 2 | 249 | 406592 | 2215.56 | 643 | 615 | 183.2 |
| D | 8 | 129 | 369497 | 2013.12 | 643 | 615 | 183.2 |
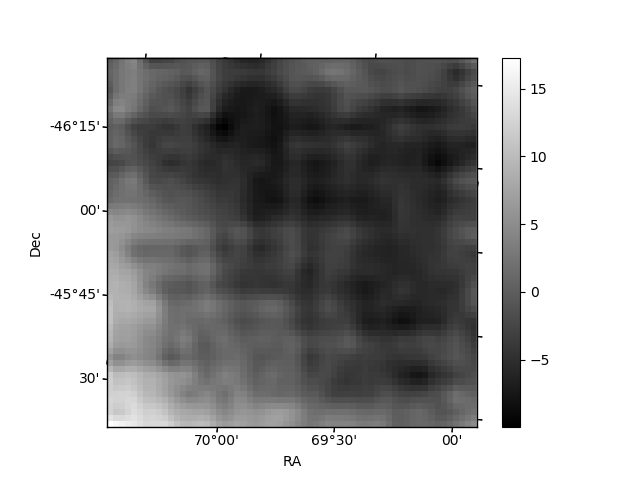
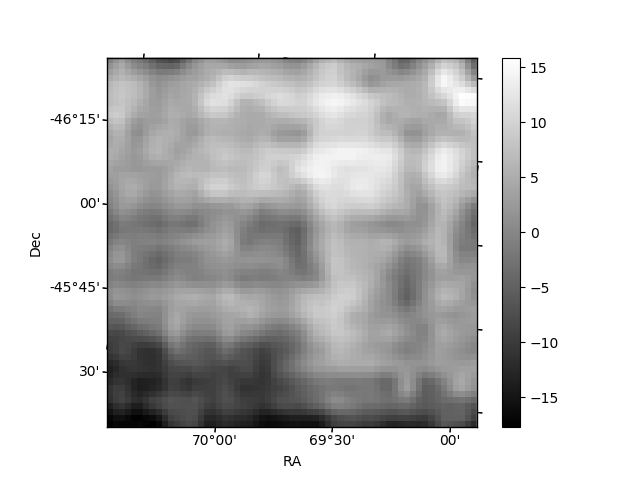
Histogram calculated using DETX and DETY for each event in the final _common_clean file
| Quadrant A | 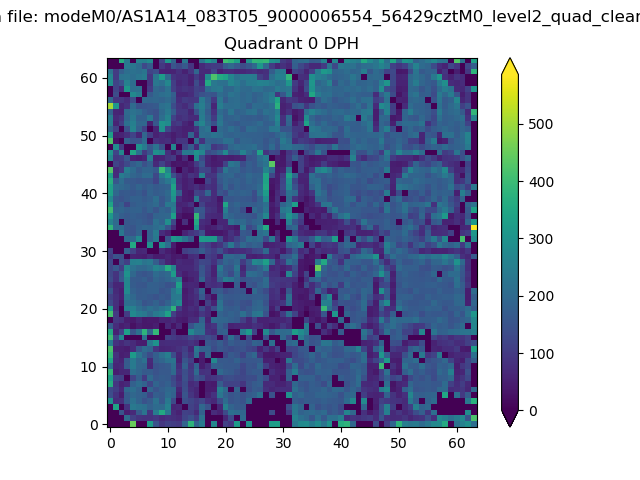 |
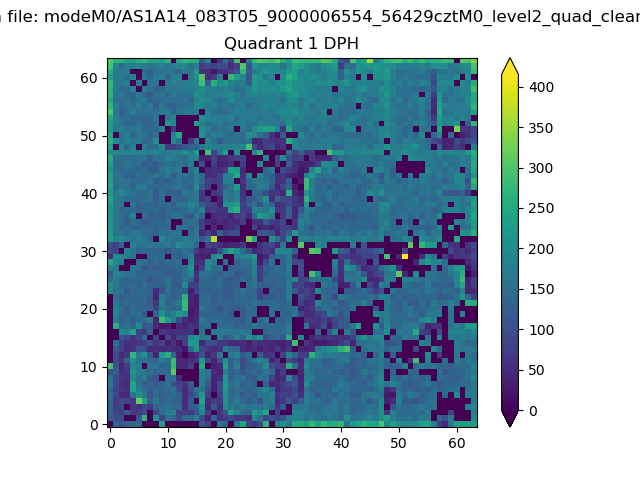 |
Quadrant B |
|---|---|---|---|
| Quadrant D |  |
 |
Quadrant C |
| Plot type | Count rate plots | Images |
|---|---|---|
| Comparison with Poisson distribution Blue bars denote a histogram of data divided into 1 sec bins. Red curve is a Poisson curve with rate = median count rate of data. |
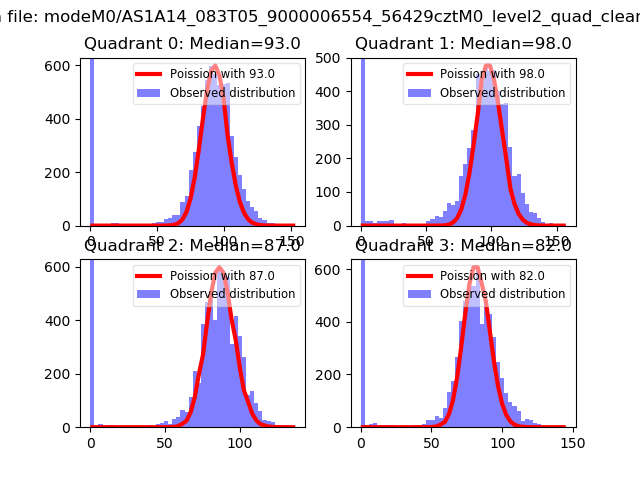 |
 |
| Quadrant-wise count rates Data is divided into 100 sec bins |
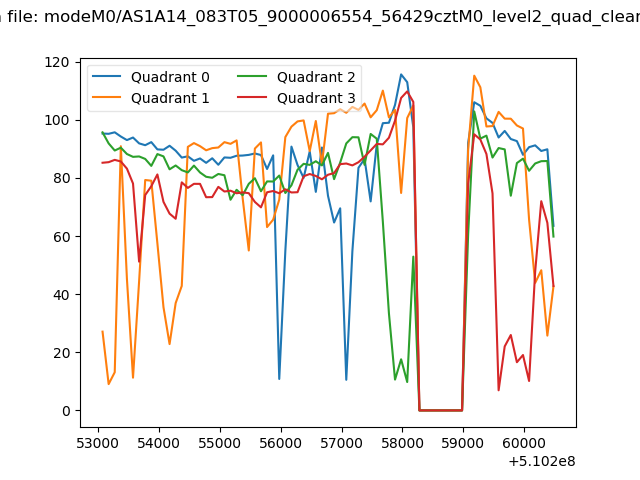 |
|
| Module-wise count rates for Quadrant A Data is divided into 100 sec bins |
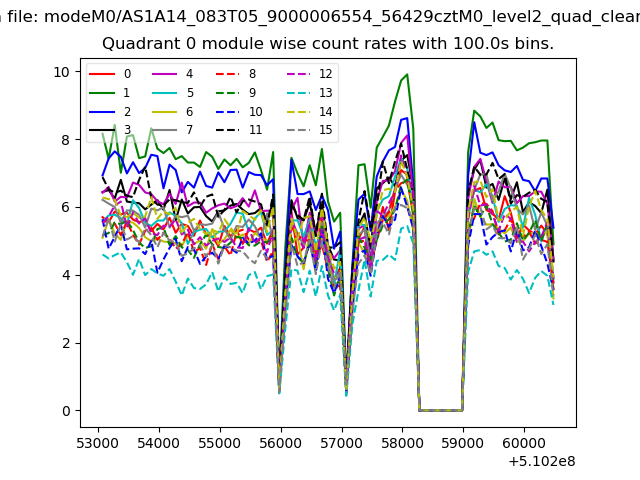 |
 |
| Module-wise count rates for Quadrant B Data is divided into 100 sec bins |
 |
 |
| Module-wise count rates for Quadrant C Data is divided into 100 sec bins |
 |
 |
| Module-wise count rates for Quadrant D Data is divided into 100 sec bins |
 |
 |
| Parameter | Plot |
|---|---|
| CZT HV Monitor | 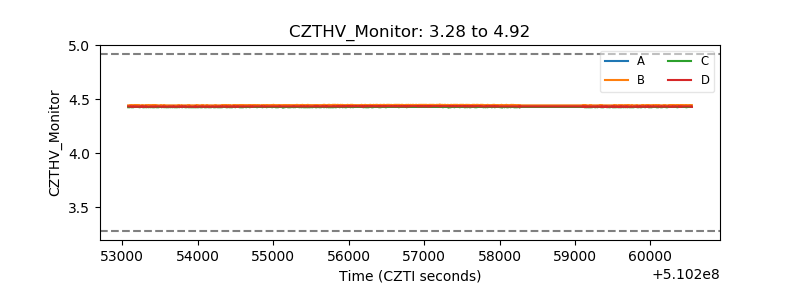 |
| D_VDD |  |
| Temperature 1 |  |
| Veto HV Monitor | 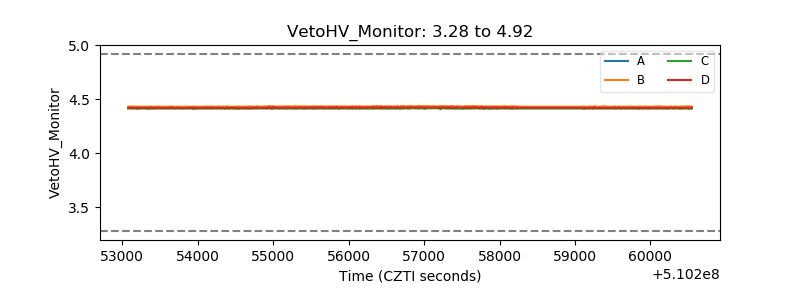 |
| Veto LLD | 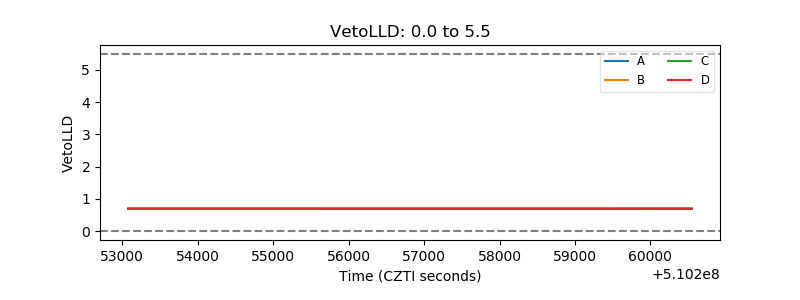 |
| Alpha Counter |  |
| _CPM_Rate | 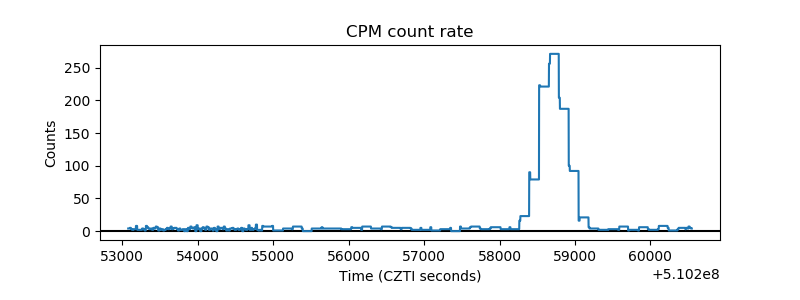 |
| CZT Counter | 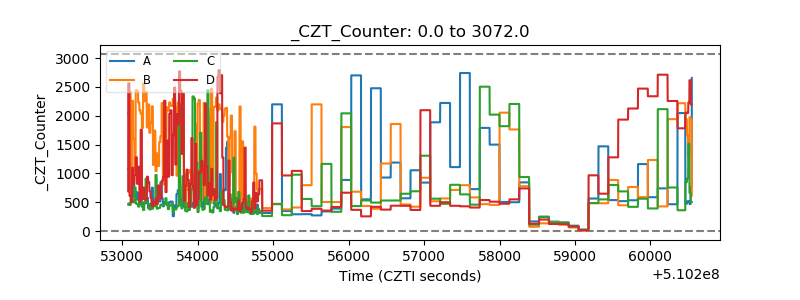 |
| +2.5 Volts monitor |  |
| +5 Volts monitor | 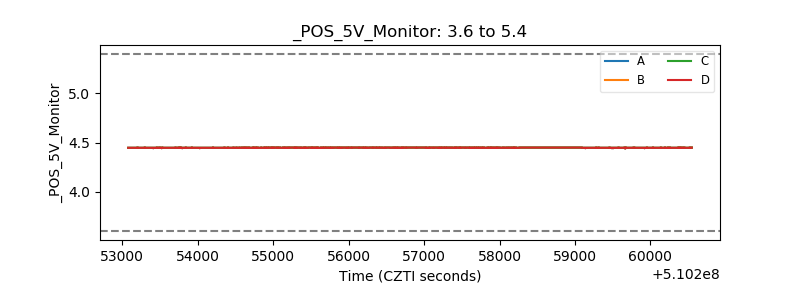 |
| _ROLL_ROT | 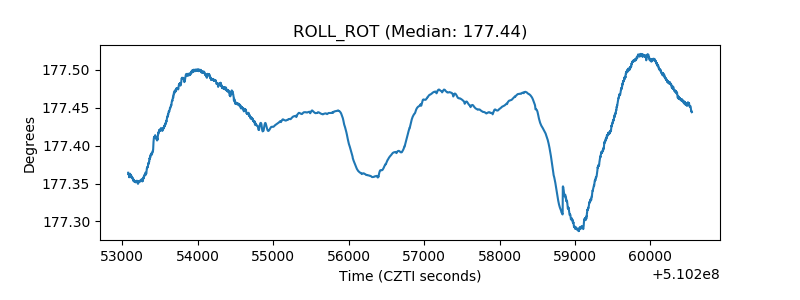 |
| _Roll_DEC | 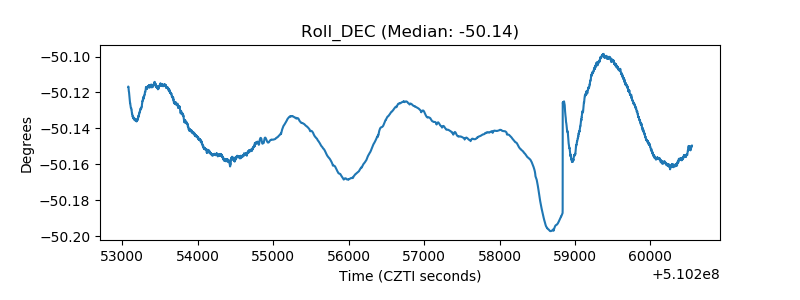 |
| _Roll_RA |  |
| Veto Counter | 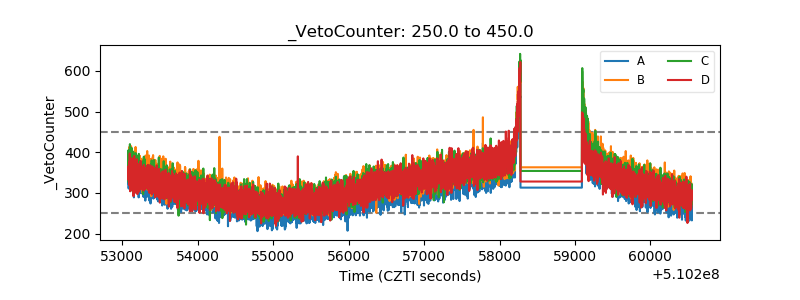 |