| Param | Original file | Final file |
|---|---|---|
| Filename | modeM0/AS1A14_083T05_9000006554_56430cztM0_level2.fits | modeM0/AS1A14_083T05_9000006554_56430cztM0_level2_quad_clean.evt |
| Size (bytes) | 718,752,960 | 87,076,800 |
| Size | 685.5 MB | 83.0 MB |
| Events in quadrant A | 7,362,338 | 569,283 |
| Events in quadrant B | 6,509,658 | 552,241 |
| Events in quadrant C | 6,264,549 | 542,552 |
| Events in quadrant D | 5,950,278 | 504,766 |
| Mode M9 | |||
|---|---|---|---|
| Quadrant | BADHDUFLAG | Total packets | Discarded packets |
| A | 0 | 10 | 0 |
| B | 0 | 11 | 0 |
| C | 0 | 11 | 0 |
| D | 0 | 11 | 0 |
| Mode SS | |||
|---|---|---|---|
| Quadrant | BADHDUFLAG | Total packets | Discarded packets |
| A | 0 | 136 | 0 |
| B | 0 | 136 | 0 |
| C | 0 | 136 | 0 |
| D | 0 | 136 | 0 |
| Mode M0 | |||
|---|---|---|---|
| Quadrant | BADHDUFLAG | Total packets | Discarded packets |
| A | 0 | 26521 | 2 |
| B | 0 | 24040 | 1 |
| C | 0 | 23281 | 1 |
| D | 0 | 22447 | 1 |
| Quadrant | Total seconds | Saturated seconds | Saturation percentage |
|---|---|---|---|
| A | 6702 | 900 | 13.428827% |
| B | 6702 | 1429 | 21.321993% |
| C | 6702 | 859 | 12.817070% |
| D | 6702 | 779 | 11.623396% |
Noise dominated data is calculated using 1-second bins in cleaned event files. If a bin has >2000 counts, and if more than 50% of those come from <1% of pixels, then it is considered to be noise-dominated and hence unusable.
| Quadrant | # 1 sec bins | Bins with >0 counts | Bins with >2000 counts | High rate bins dominated by noise | Noise dominated (total time) | Noise dominated (detector-on time) | Marked lightcurve |
|---|---|---|---|---|---|---|---|
| A | 7687 | 6703 | 820 | 820 | 10.67% | 12.23% |  |
| B | 7687 | 6703 | 1027 | 1027 | 13.36% | 15.32% |  |
| C | 7687 | 6702 | 805 | 805 | 10.47% | 12.01% | 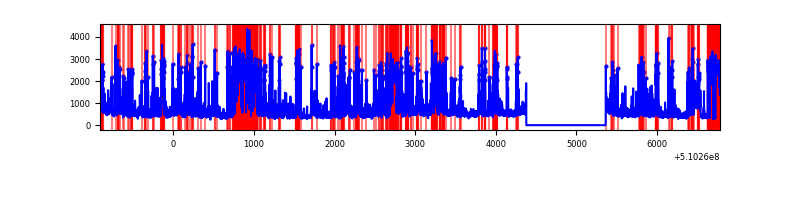 |
| D | 7687 | 6703 | 852 | 852 | 11.08% | 12.71% |  |
Top three noisy pixels from each quadrant. If the there are fewer than three noisy pixels in the level2.evt file, extra rows are filled as -1
| Pixel properties | Quadrant properties | ||||||
|---|---|---|---|---|---|---|---|
| Quadrant | DetID | PixID | Counts | Sigma | Mean | Median | Sigma |
| A | 4 | 95 | 2477769 | 14688.21 | 678 | 662 | 168.6 |
| A | 12 | 3 | 1013030 | 6002.92 | 678 | 662 | 168.6 |
| A | 8 | 249 | 707541 | 4191.49 | 678 | 662 | 168.6 |
| B | 4 | 206 | 3242426 | 23396.07 | 637 | 615 | 138.6 |
| B | 0 | 231 | 373482 | 2690.97 | 637 | 615 | 138.6 |
| B | 4 | 171 | 65664 | 469.46 | 637 | 615 | 138.6 |
| C | 12 | 254 | 1731610 | 9656.46 | 645 | 637 | 179.3 |
| C | 15 | 230 | 1045914 | 5831.21 | 645 | 637 | 179.3 |
| C | 13 | 3 | 289901 | 1613.7 | 645 | 637 | 179.3 |
| D | 8 | 160 | 1852401 | 9980.2 | 650 | 620 | 185.5 |
| D | 7 | 96 | 357191 | 1921.74 | 650 | 620 | 185.5 |
| D | 3 | 12 | 233601 | 1255.65 | 650 | 620 | 185.5 |
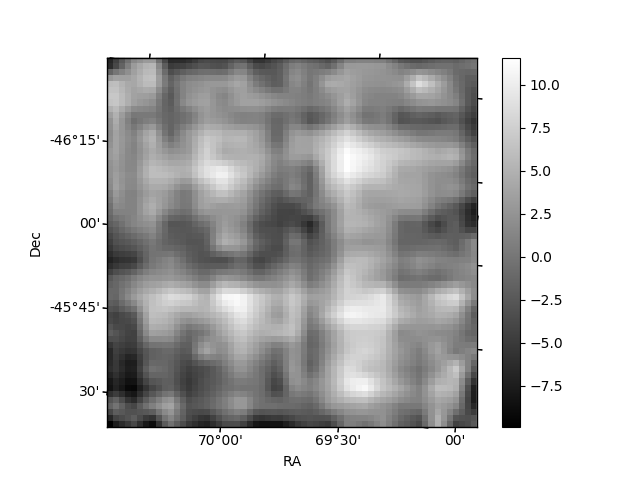
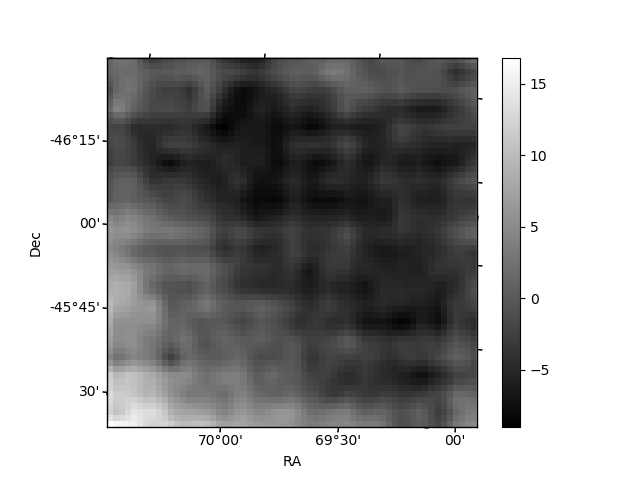
Histogram calculated using DETX and DETY for each event in the final _common_clean file
| Quadrant A | 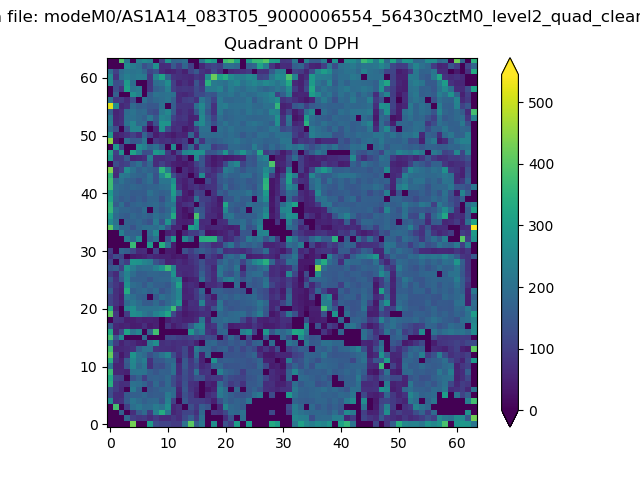 |
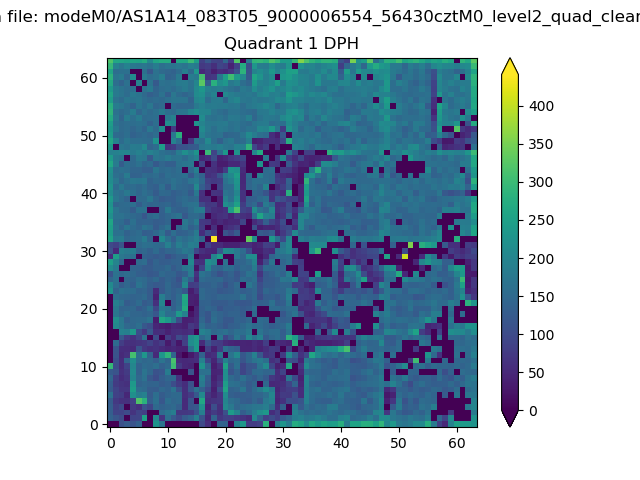 |
Quadrant B |
|---|---|---|---|
| Quadrant D | 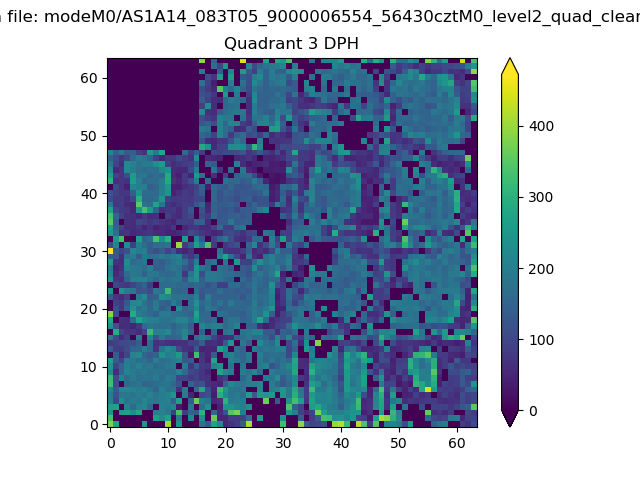 |
 |
Quadrant C |
| Plot type | Count rate plots | Images |
|---|---|---|
| Comparison with Poisson distribution Blue bars denote a histogram of data divided into 1 sec bins. Red curve is a Poisson curve with rate = median count rate of data. |
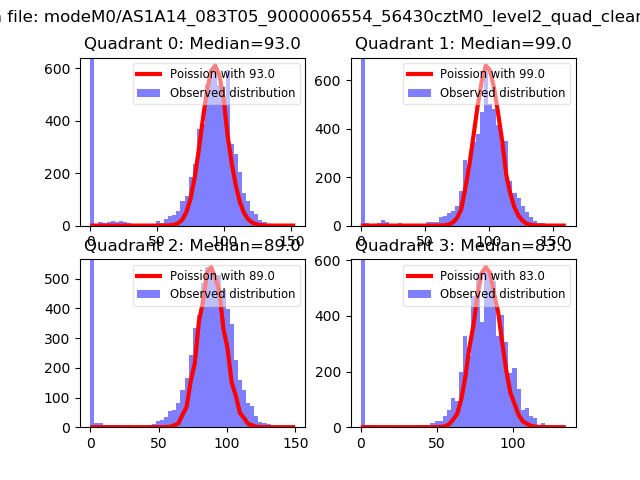 |
 |
| Quadrant-wise count rates Data is divided into 100 sec bins |
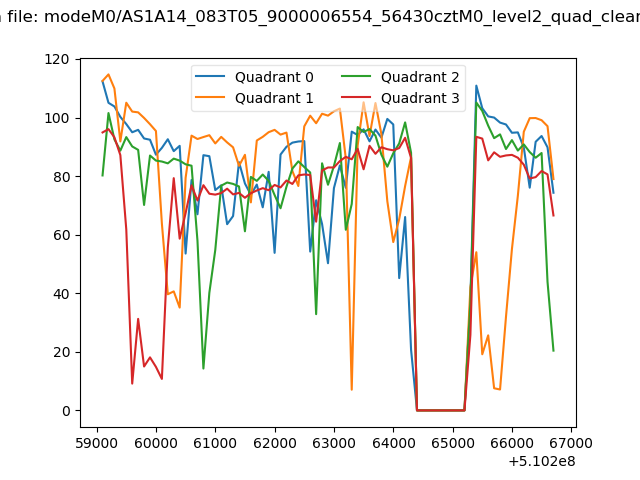 |
|
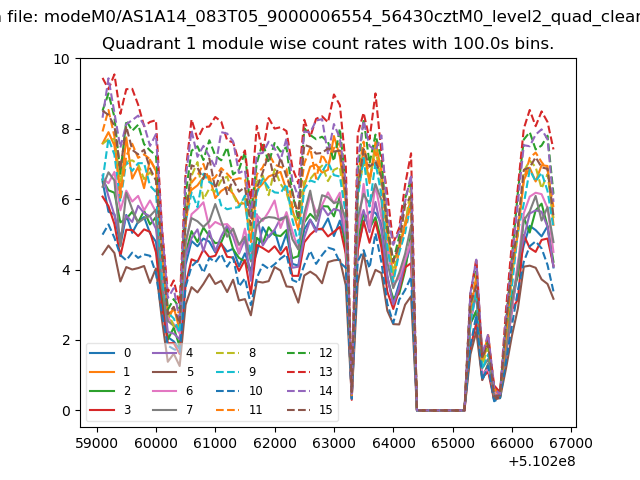
| Module-wise count rates for Quadrant A Data is divided into 100 sec bins |
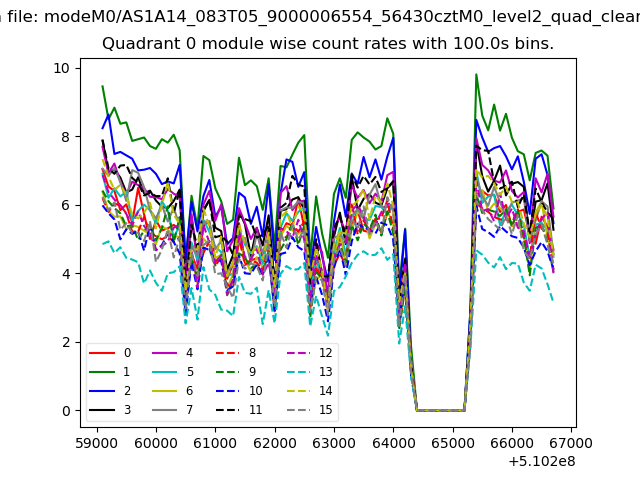 |
 |
| Module-wise count rates for Quadrant B Data is divided into 100 sec bins |
 |
 |
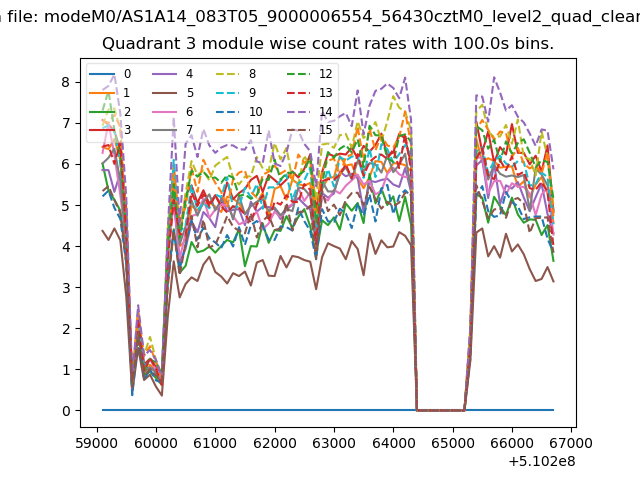
| Module-wise count rates for Quadrant C Data is divided into 100 sec bins |
 |
 |
| Module-wise count rates for Quadrant D Data is divided into 100 sec bins |
 |
 |
| Parameter | Plot |
|---|---|
| CZT HV Monitor |  |
| D_VDD |  |
| Temperature 1 | 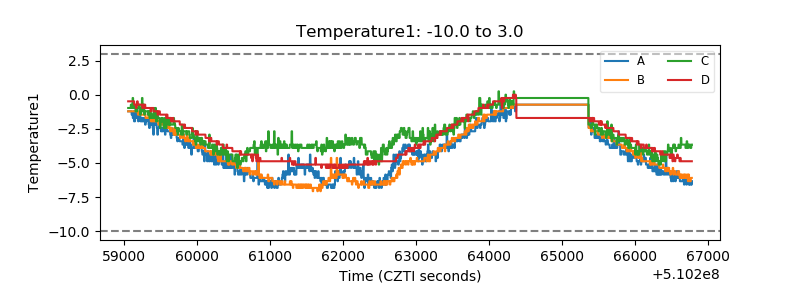 |
| Veto HV Monitor | 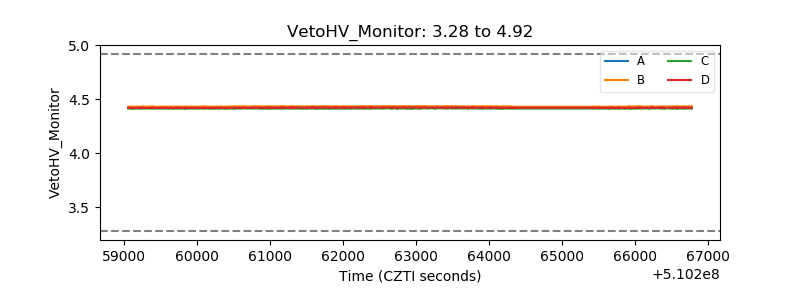 |
| Veto LLD | 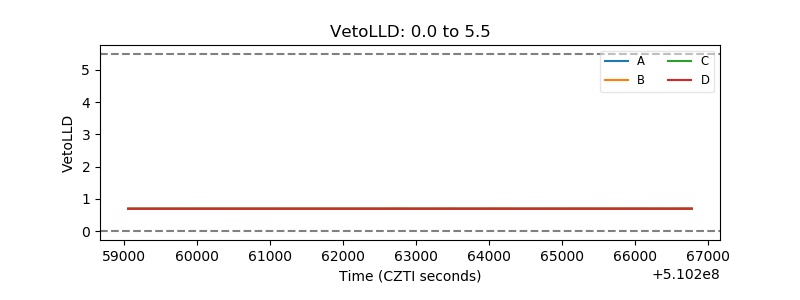 |
| Alpha Counter |  |
| _CPM_Rate | 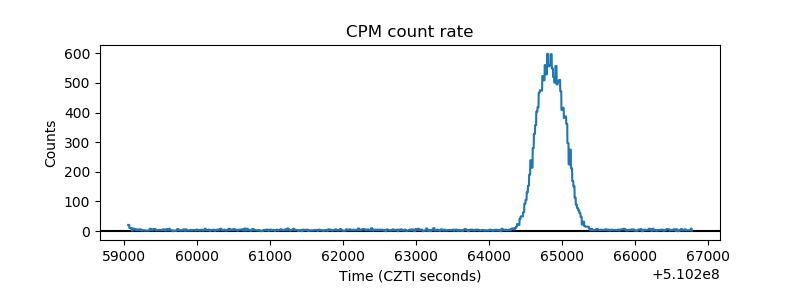 |
| CZT Counter | 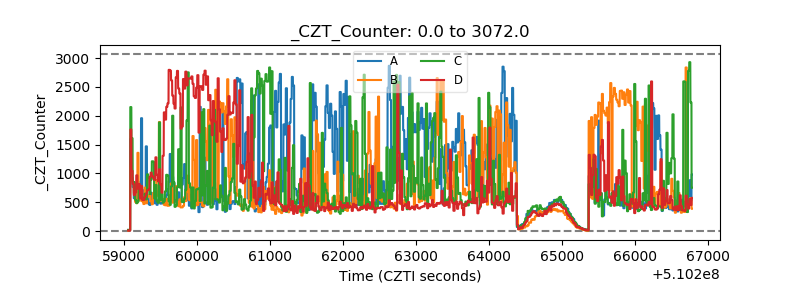 |
| +2.5 Volts monitor |  |
| +5 Volts monitor |  |
| _ROLL_ROT | 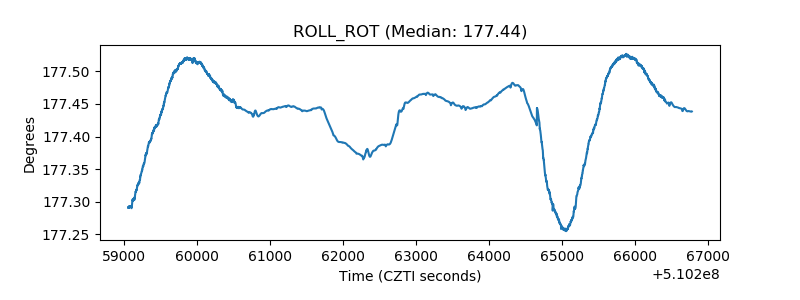 |
| _Roll_DEC | 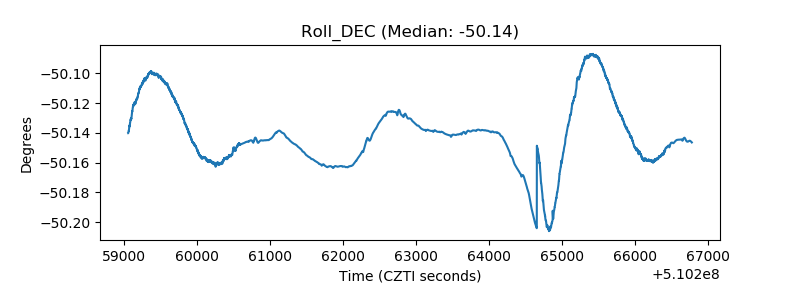 |
| _Roll_RA |  |
| Veto Counter | 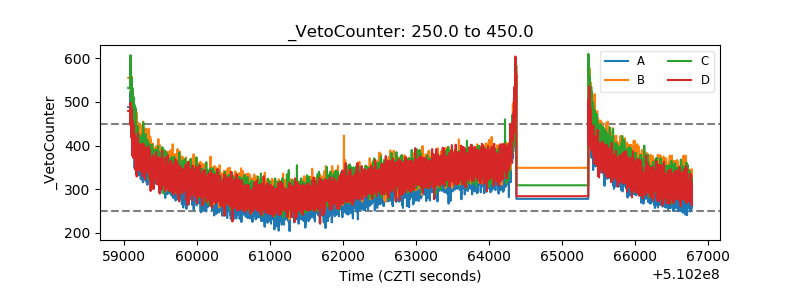 |