| Param | Original file | Final file |
|---|---|---|
| Filename | modeM0/AS1A14_083T05_9000006554_56433cztM0_level2.fits | modeM0/AS1A14_083T05_9000006554_56433cztM0_level2_quad_clean.evt |
| Size (bytes) | 502,444,800 | 94,291,200 |
| Size | 479.2 MB | 89.9 MB |
| Events in quadrant A | 5,758,916 | 589,773 |
| Events in quadrant B | 4,648,152 | 655,420 |
| Events in quadrant C | 3,680,890 | 606,967 |
| Events in quadrant D | 4,006,062 | 549,579 |
| Mode M9 | |||
|---|---|---|---|
| Quadrant | BADHDUFLAG | Total packets | Discarded packets |
| A | 0 | 18 | 0 |
| B | 0 | 18 | 0 |
| C | 0 | 19 | 0 |
| D | 0 | 19 | 0 |
| Mode SS | |||
|---|---|---|---|
| Quadrant | BADHDUFLAG | Total packets | Discarded packets |
| A | 0 | 130 | 0 |
| B | 0 | 130 | 0 |
| C | 0 | 130 | 0 |
| D | 0 | 130 | 0 |
| Mode M0 | |||
|---|---|---|---|
| Quadrant | BADHDUFLAG | Total packets | Discarded packets |
| A | 0 | 21643 | 2 |
| B | 0 | 18196 | 2 |
| C | 0 | 15576 | 2 |
| D | 0 | 16618 | 2 |
| Quadrant | Total seconds | Saturated seconds | Saturation percentage |
|---|---|---|---|
| A | 6498 | 698 | 10.741767% |
| B | 6498 | 526 | 8.094798% |
| C | 6498 | 144 | 2.216066% |
| D | 6498 | 279 | 4.293629% |
Noise dominated data is calculated using 1-second bins in cleaned event files. If a bin has >2000 counts, and if more than 50% of those come from <1% of pixels, then it is considered to be noise-dominated and hence unusable.
| Quadrant | # 1 sec bins | Bins with >0 counts | Bins with >2000 counts | High rate bins dominated by noise | Noise dominated (total time) | Noise dominated (detector-on time) | Marked lightcurve |
|---|---|---|---|---|---|---|---|
| A | 7658 | 6498 | 713 | 713 | 9.31% | 10.97% |  |
| B | 7658 | 6498 | 312 | 312 | 4.07% | 4.80% |  |
| C | 7658 | 6499 | 104 | 104 | 1.36% | 1.60% | 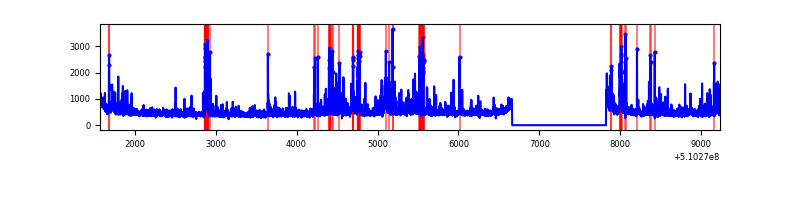 |
| D | 7658 | 6499 | 245 | 245 | 3.20% | 3.77% |  |
Top three noisy pixels from each quadrant. If the there are fewer than three noisy pixels in the level2.evt file, extra rows are filled as -1
| Pixel properties | Quadrant properties | ||||||
|---|---|---|---|---|---|---|---|
| Quadrant | DetID | PixID | Counts | Sigma | Mean | Median | Sigma |
| A | 12 | 3 | 1314737 | 7711.47 | 683 | 666 | 170.4 |
| A | 4 | 95 | 874210 | 5126.29 | 683 | 666 | 170.4 |
| A | 8 | 249 | 290058 | 1698.26 | 683 | 666 | 170.4 |
| B | 4 | 206 | 1466993 | 10118.67 | 684 | 660 | 144.9 |
| B | 5 | 185 | 230605 | 1586.77 | 684 | 660 | 144.9 |
| B | 0 | 171 | 42578 | 289.26 | 684 | 660 | 144.9 |
| C | 12 | 254 | 604701 | 3207.51 | 685 | 680 | 188.3 |
| C | 1 | 16 | 140368 | 741.78 | 685 | 680 | 188.3 |
| C | 12 | 252 | 98401 | 518.92 | 685 | 680 | 188.3 |
| D | 3 | 12 | 342609 | 1822.42 | 667 | 639 | 187.6 |
| D | 8 | 160 | 295520 | 1571.48 | 667 | 639 | 187.6 |
| D | 2 | 249 | 160463 | 851.73 | 667 | 639 | 187.6 |
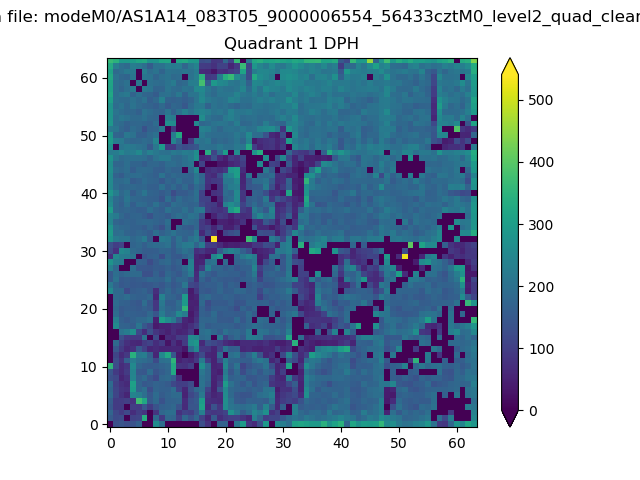
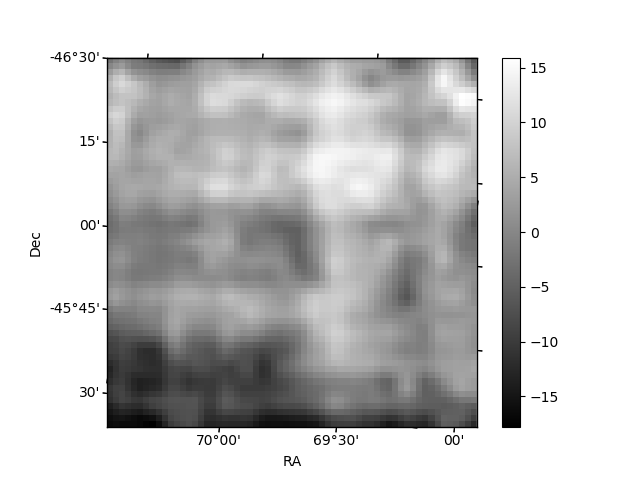
Histogram calculated using DETX and DETY for each event in the final _common_clean file
| Quadrant A |  |
 |
Quadrant B |
|---|---|---|---|
| Quadrant D | 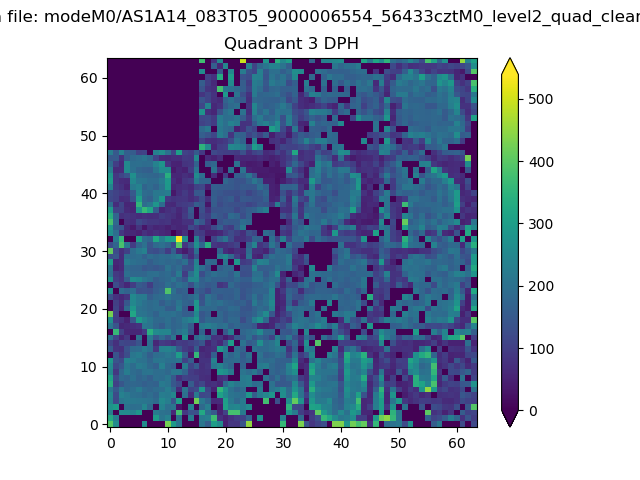 |
 |
Quadrant C |
| Plot type | Count rate plots | Images |
|---|---|---|
| Comparison with Poisson distribution Blue bars denote a histogram of data divided into 1 sec bins. Red curve is a Poisson curve with rate = median count rate of data. |
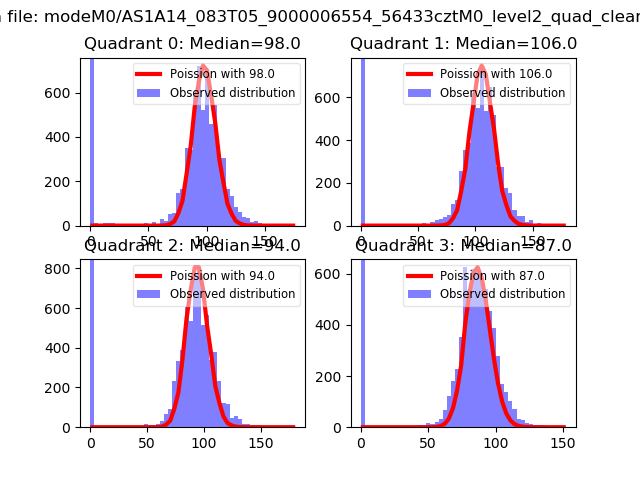 |
 |
| Quadrant-wise count rates Data is divided into 100 sec bins |
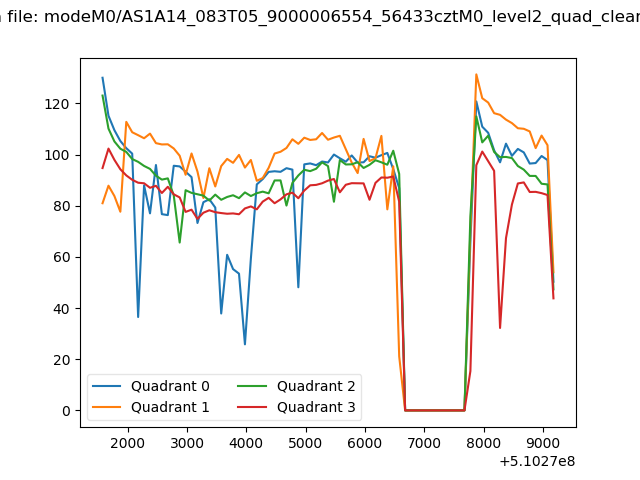 |
|
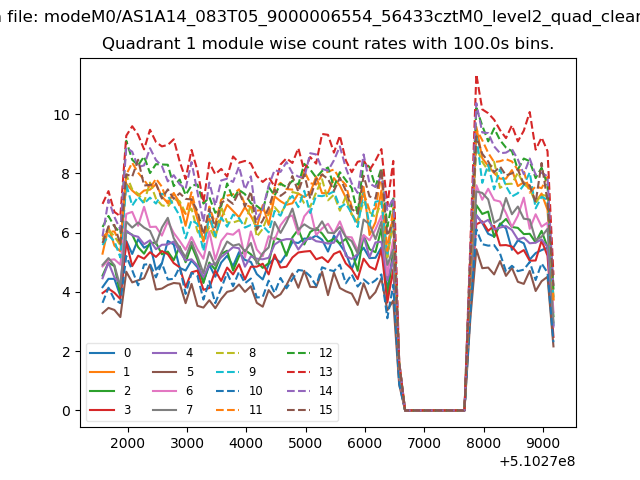
| Module-wise count rates for Quadrant A Data is divided into 100 sec bins |
 |
 |
| Module-wise count rates for Quadrant B Data is divided into 100 sec bins |
 |
 |
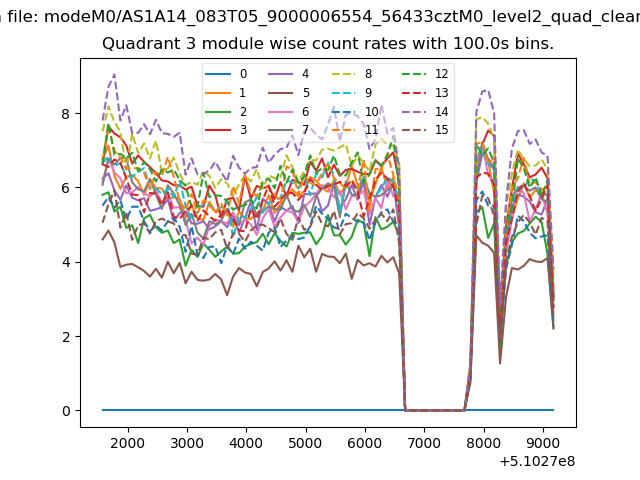
| Module-wise count rates for Quadrant C Data is divided into 100 sec bins |
 |
 |
| Module-wise count rates for Quadrant D Data is divided into 100 sec bins |
 |
 |
| Parameter | Plot |
|---|---|
| CZT HV Monitor | 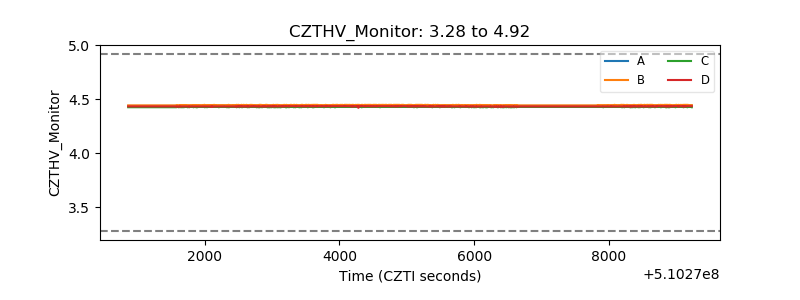 |
| D_VDD |  |
| Temperature 1 |  |
| Veto HV Monitor | 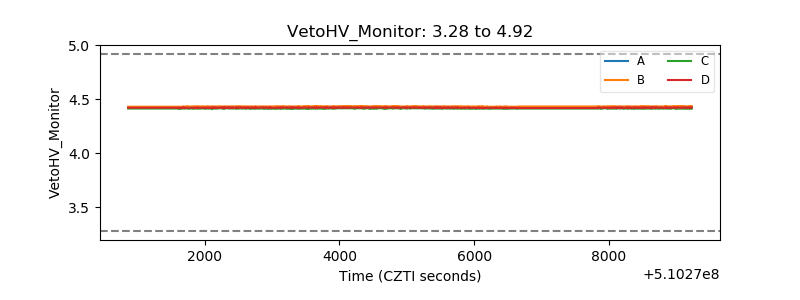 |
| Veto LLD | 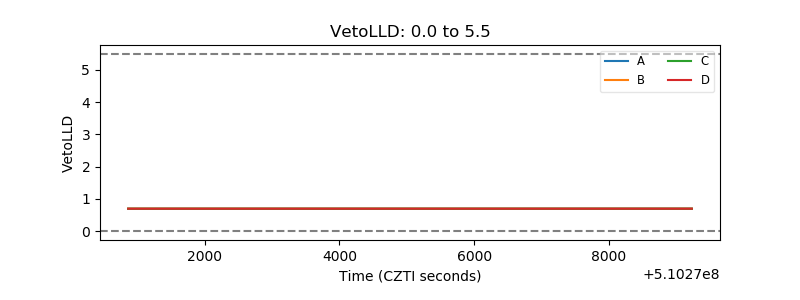 |
| Alpha Counter |  |
| _CPM_Rate | 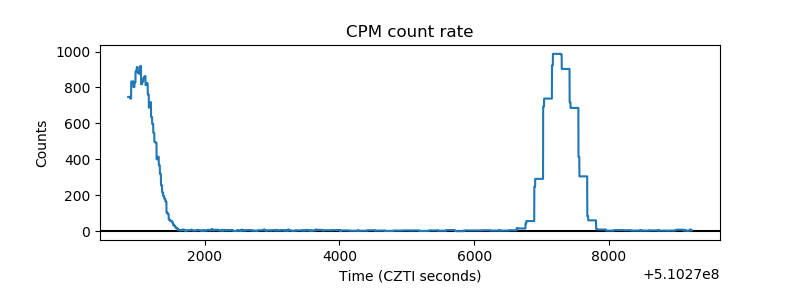 |
| CZT Counter |  |
| +2.5 Volts monitor |  |
| +5 Volts monitor | 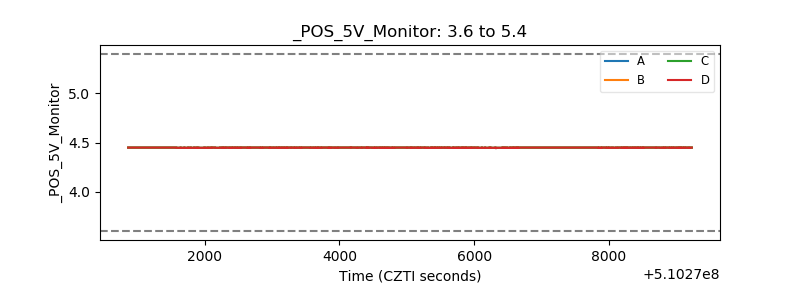 |
| _ROLL_ROT | 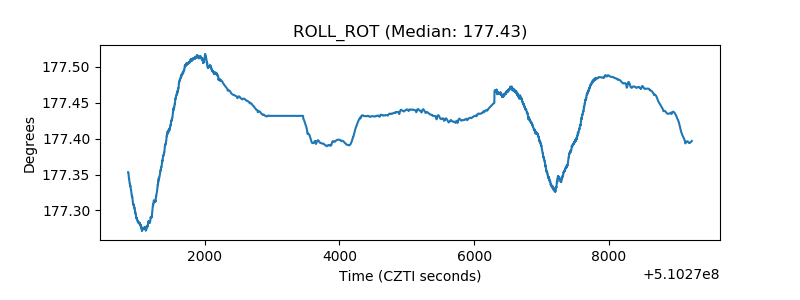 |
| _Roll_DEC |  |
| _Roll_RA |  |
| Veto Counter | 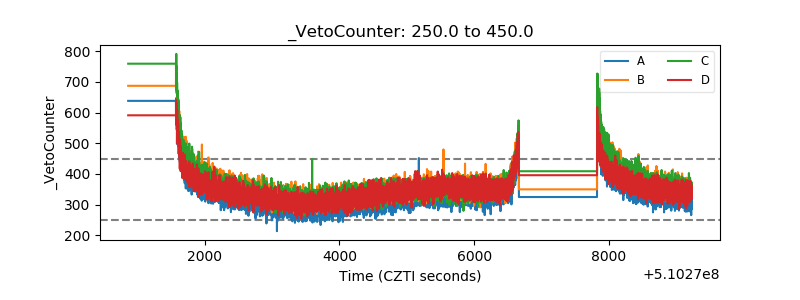 |