| Param | Original file | Final file |
|---|---|---|
| Filename | modeM0/AS1A14_083T05_9000006554_56434cztM0_level2.fits | modeM0/AS1A14_083T05_9000006554_56434cztM0_level2_quad_clean.evt |
| Size (bytes) | 599,880,960 | 82,252,800 |
| Size | 572.1 MB | 78.4 MB |
| Events in quadrant A | 8,491,614 | 436,454 |
| Events in quadrant B | 4,733,040 | 563,010 |
| Events in quadrant C | 4,011,493 | 544,908 |
| Events in quadrant D | 4,455,040 | 483,114 |
| Mode M9 | |||
|---|---|---|---|
| Quadrant | BADHDUFLAG | Total packets | Discarded packets |
| A | 0 | 15 | 0 |
| B | 0 | 15 | 0 |
| C | 0 | 16 | 0 |
| D | 0 | 16 | 0 |
| Mode SS | |||
|---|---|---|---|
| Quadrant | BADHDUFLAG | Total packets | Discarded packets |
| A | 0 | 136 | 0 |
| B | 0 | 136 | 0 |
| C | 0 | 136 | 0 |
| D | 0 | 136 | 0 |
| Mode M0 | |||
|---|---|---|---|
| Quadrant | BADHDUFLAG | Total packets | Discarded packets |
| A | 0 | 29846 | 2 |
| B | 0 | 18585 | 2 |
| C | 0 | 16506 | 2 |
| D | 0 | 17999 | 2 |
| Quadrant | Total seconds | Saturated seconds | Saturation percentage |
|---|---|---|---|
| A | 6632 | 1637 | 24.683353% |
| B | 6632 | 568 | 8.564536% |
| C | 6632 | 191 | 2.879976% |
| D | 6632 | 395 | 5.955971% |
Noise dominated data is calculated using 1-second bins in cleaned event files. If a bin has >2000 counts, and if more than 50% of those come from <1% of pixels, then it is considered to be noise-dominated and hence unusable.
| Quadrant | # 1 sec bins | Bins with >0 counts | Bins with >2000 counts | High rate bins dominated by noise | Noise dominated (total time) | Noise dominated (detector-on time) | Marked lightcurve |
|---|---|---|---|---|---|---|---|
| A | 8074 | 6878 | 1627 | 1627 | 20.15% | 23.66% |  |
| B | 8074 | 6886 | 303 | 303 | 3.75% | 4.40% |  |
| C | 8074 | 6915 | 136 | 136 | 1.68% | 1.97% | 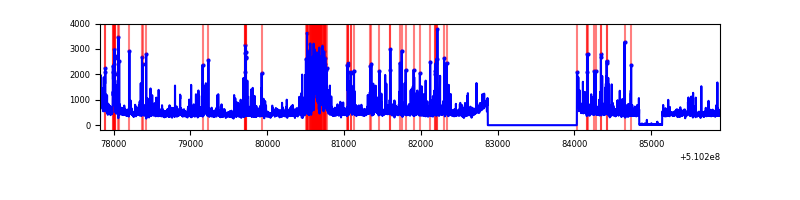 |
| D | 8074 | 6915 | 346 | 346 | 4.29% | 5.00% |  |
Top three noisy pixels from each quadrant. If the there are fewer than three noisy pixels in the level2.evt file, extra rows are filled as -1
| Pixel properties | Quadrant properties | ||||||
|---|---|---|---|---|---|---|---|
| Quadrant | DetID | PixID | Counts | Sigma | Mean | Median | Sigma |
| A | 4 | 95 | 2638835 | 16537.18 | 645 | 629 | 159.5 |
| A | 12 | 3 | 2607395 | 16340.11 | 645 | 629 | 159.5 |
| A | 12 | 194 | 340488 | 2130.35 | 645 | 629 | 159.5 |
| B | 4 | 206 | 1713985 | 11496.72 | 707 | 683 | 149.0 |
| B | 0 | 231 | 56143 | 372.15 | 707 | 683 | 149.0 |
| B | 10 | 247 | 29033 | 190.24 | 707 | 683 | 149.0 |
| C | 12 | 254 | 687207 | 3535.1 | 709 | 703 | 194.2 |
| C | 1 | 16 | 157564 | 807.74 | 709 | 703 | 194.2 |
| C | 1 | 12 | 141731 | 726.21 | 709 | 703 | 194.2 |
| D | 8 | 160 | 449345 | 2315.61 | 687 | 654 | 193.8 |
| D | 3 | 12 | 343923 | 1771.55 | 687 | 654 | 193.8 |
| D | 12 | 4 | 304670 | 1568.97 | 687 | 654 | 193.8 |
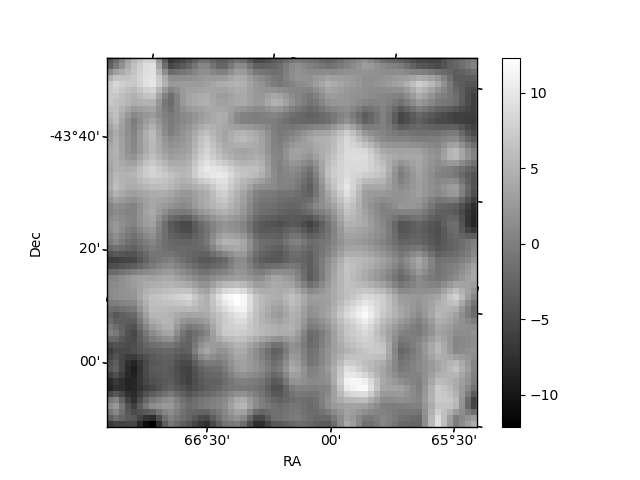
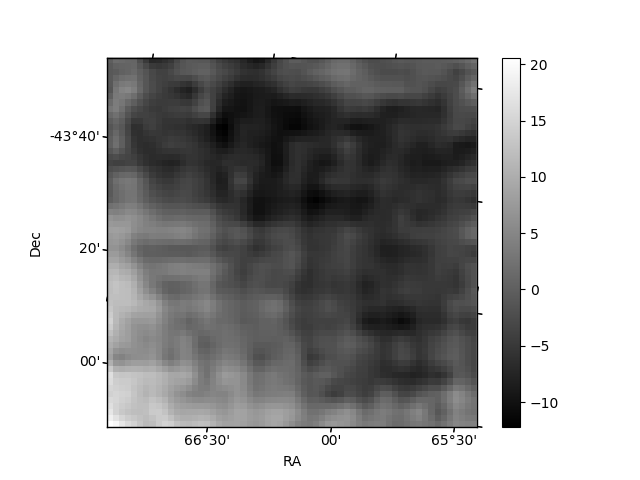
Histogram calculated using DETX and DETY for each event in the final _common_clean file
| Quadrant A | 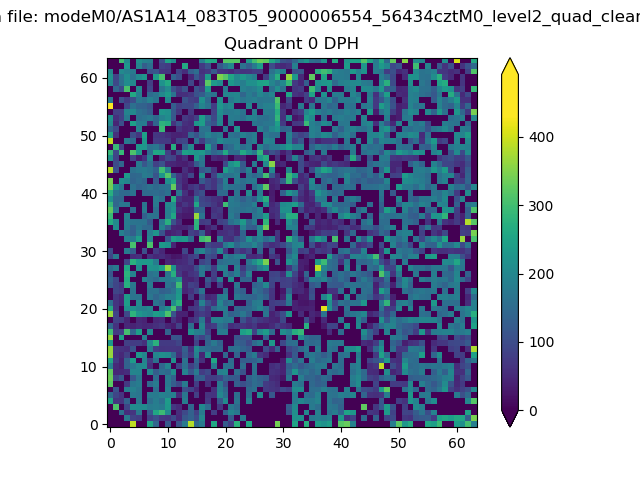 |
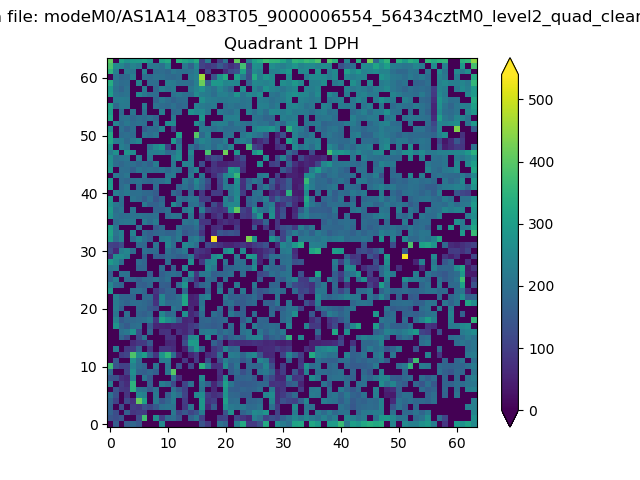 |
Quadrant B |
|---|---|---|---|
| Quadrant D |  |
 |
Quadrant C |
| Plot type | Count rate plots | Images |
|---|---|---|
| Comparison with Poisson distribution Blue bars denote a histogram of data divided into 1 sec bins. Red curve is a Poisson curve with rate = median count rate of data. |
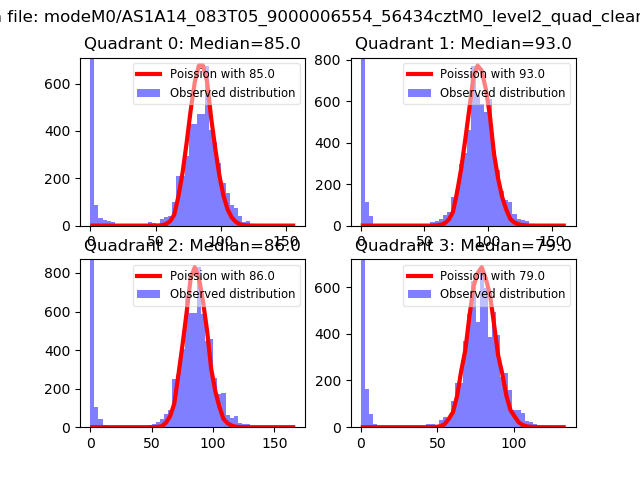 |
 |
| Quadrant-wise count rates Data is divided into 100 sec bins |
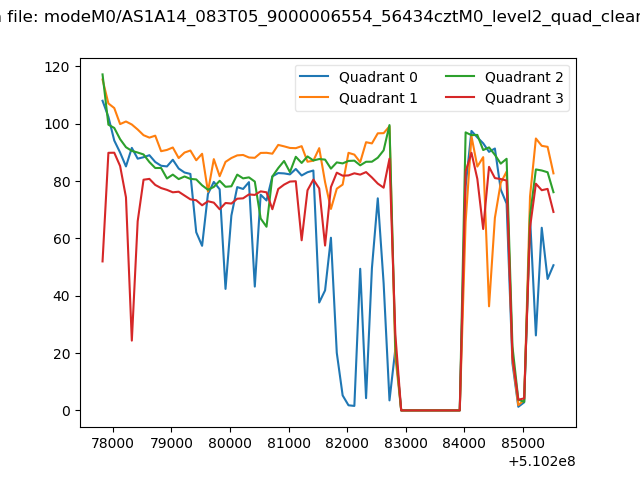 |
|
| Module-wise count rates for Quadrant A Data is divided into 100 sec bins |
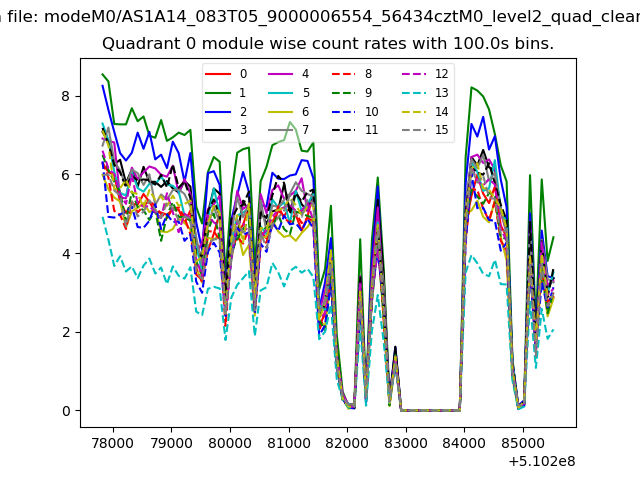 |
 |
| Module-wise count rates for Quadrant B Data is divided into 100 sec bins |
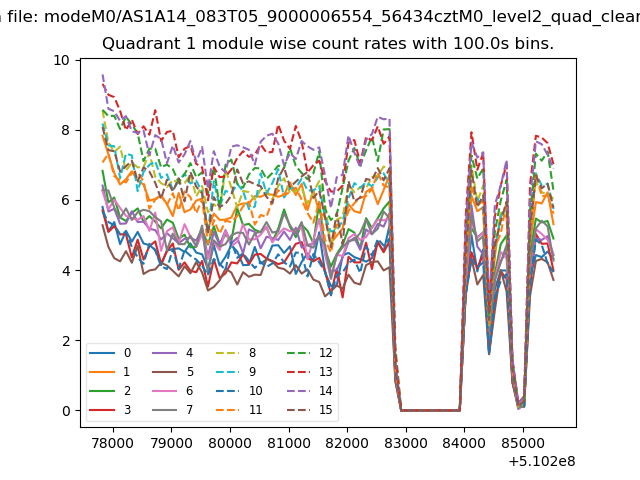 |
 |
| Module-wise count rates for Quadrant C Data is divided into 100 sec bins |
 |
 |
| Module-wise count rates for Quadrant D Data is divided into 100 sec bins |
 |
 |
| Parameter | Plot |
|---|---|
| CZT HV Monitor |  |
| D_VDD |  |
| Temperature 1 | 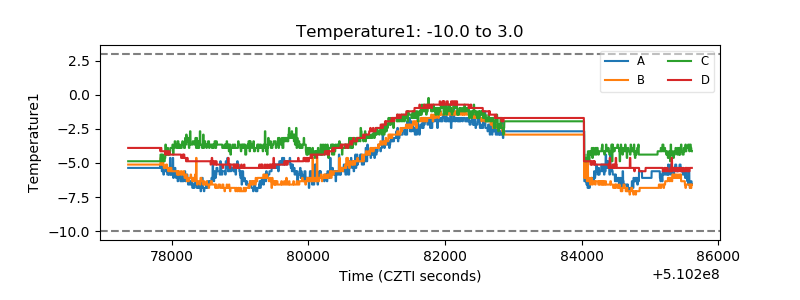 |
| Veto HV Monitor | 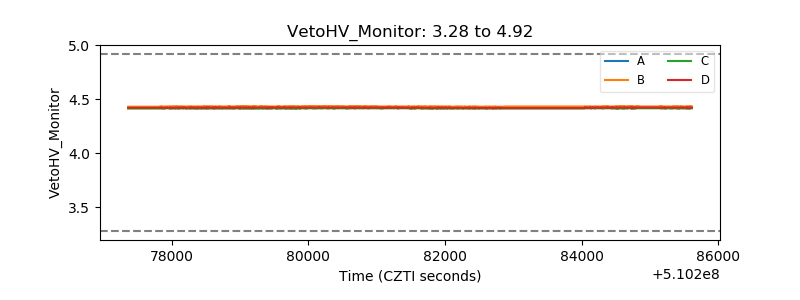 |
| Veto LLD | 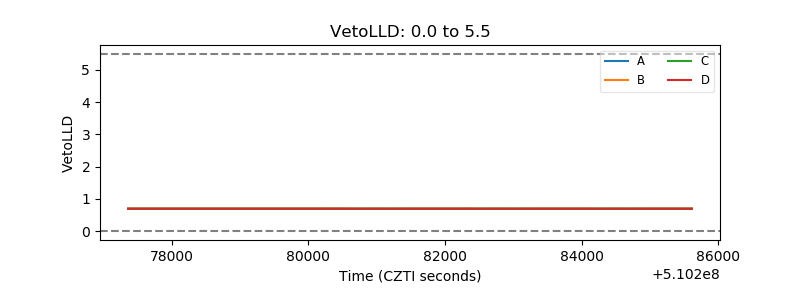 |
| Alpha Counter |  |
| _CPM_Rate | 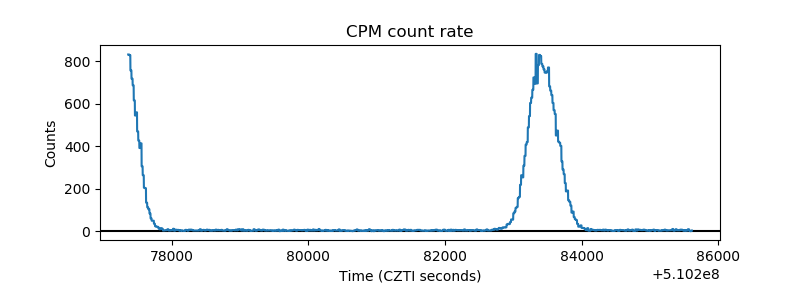 |
| CZT Counter | 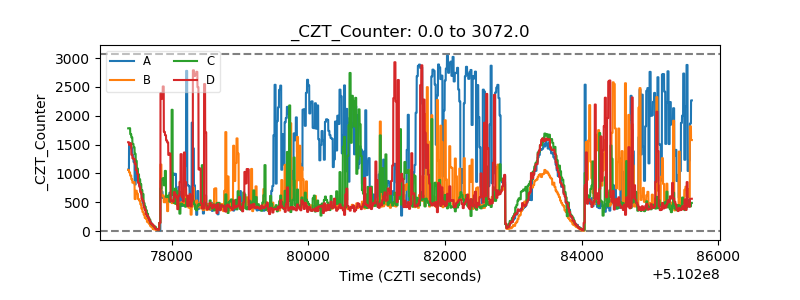 |
| +2.5 Volts monitor |  |
| +5 Volts monitor |  |
| _ROLL_ROT | 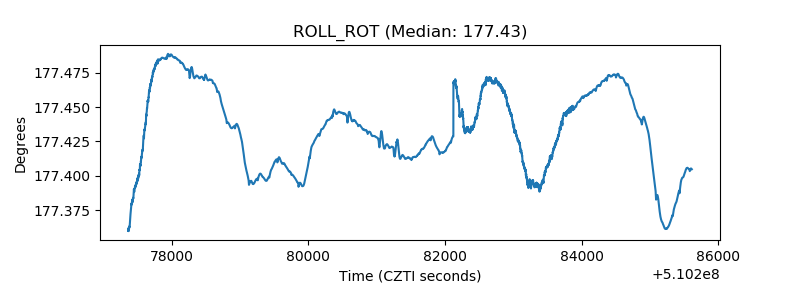 |
| _Roll_DEC | 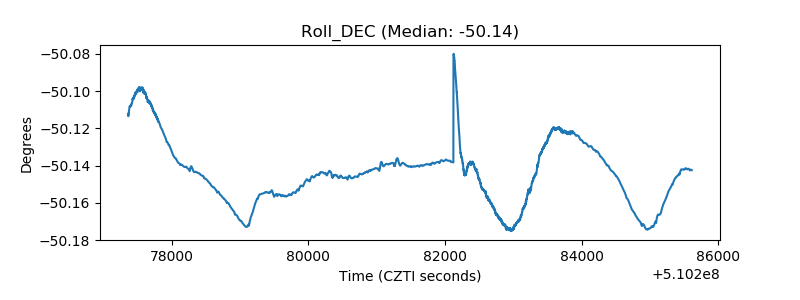 |
| _Roll_RA |  |
| Veto Counter | 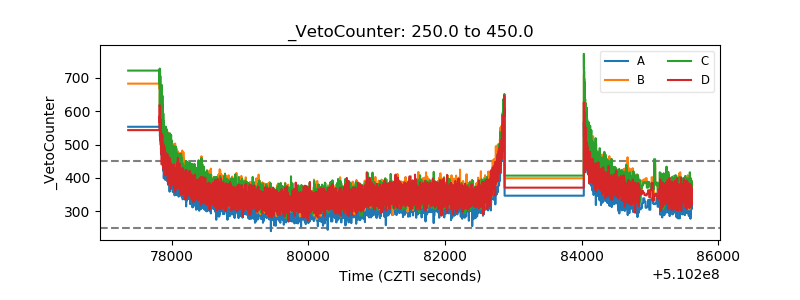 |