| Param | Original file | Final file |
|---|---|---|
| Filename | modeM0/AS1A14_083T05_9000006554_56435cztM0_level2.fits | modeM0/AS1A14_083T05_9000006554_56435cztM0_level2_quad_clean.evt |
| Size (bytes) | 582,022,080 | 80,746,560 |
| Size | 555.1 MB | 77.0 MB |
| Events in quadrant A | 7,465,415 | 438,546 |
| Events in quadrant B | 5,772,688 | 521,291 |
| Events in quadrant C | 4,019,656 | 526,122 |
| Events in quadrant D | 3,770,943 | 495,387 |
| Mode M9 | |||
|---|---|---|---|
| Quadrant | BADHDUFLAG | Total packets | Discarded packets |
| A | 0 | 11 | 0 |
| B | 0 | 11 | 0 |
| C | 0 | 11 | 0 |
| D | 0 | 11 | 0 |
| Mode SS | |||
|---|---|---|---|
| Quadrant | BADHDUFLAG | Total packets | Discarded packets |
| A | 0 | 136 | 0 |
| B | 0 | 136 | 0 |
| C | 0 | 136 | 0 |
| D | 0 | 136 | 0 |
| Mode M0 | |||
|---|---|---|---|
| Quadrant | BADHDUFLAG | Total packets | Discarded packets |
| A | 0 | 26734 | 2 |
| B | 0 | 21738 | 3 |
| C | 0 | 16483 | 2 |
| D | 0 | 15965 | 2 |
| Quadrant | Total seconds | Saturated seconds | Saturation percentage |
|---|---|---|---|
| A | 6642 | 1548 | 23.306233% |
| B | 6641 | 1051 | 15.825930% |
| C | 6642 | 260 | 3.914484% |
| D | 6642 | 142 | 2.137910% |
Noise dominated data is calculated using 1-second bins in cleaned event files. If a bin has >2000 counts, and if more than 50% of those come from <1% of pixels, then it is considered to be noise-dominated and hence unusable.
| Quadrant | # 1 sec bins | Bins with >0 counts | Bins with >2000 counts | High rate bins dominated by noise | Noise dominated (total time) | Noise dominated (detector-on time) | Marked lightcurve |
|---|---|---|---|---|---|---|---|
| A | 8034 | 6889 | 1473 | 1473 | 18.33% | 21.38% |  |
| B | 8033 | 6896 | 625 | 625 | 7.78% | 9.06% |  |
| C | 8034 | 6925 | 177 | 177 | 2.20% | 2.56% | 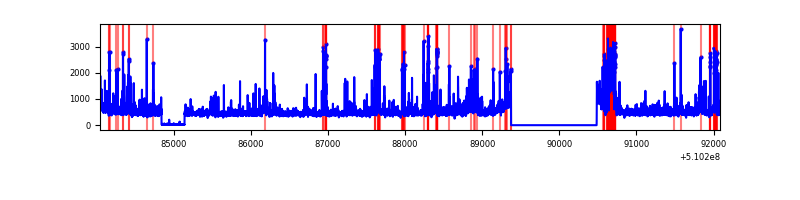 |
| D | 8034 | 6925 | 120 | 120 | 1.49% | 1.73% |  |
Top three noisy pixels from each quadrant. If the there are fewer than three noisy pixels in the level2.evt file, extra rows are filled as -1
| Pixel properties | Quadrant properties | ||||||
|---|---|---|---|---|---|---|---|
| Quadrant | DetID | PixID | Counts | Sigma | Mean | Median | Sigma |
| A | 12 | 3 | 3172528 | 19409.42 | 660 | 644 | 163.4 |
| A | 4 | 95 | 698015 | 4267.36 | 660 | 644 | 163.4 |
| A | 12 | 194 | 433756 | 2650.3 | 660 | 644 | 163.4 |
| B | 4 | 206 | 2625952 | 18110.2 | 679 | 653 | 145.0 |
| B | 0 | 231 | 231554 | 1592.83 | 679 | 653 | 145.0 |
| B | 15 | 33 | 59558 | 406.35 | 679 | 653 | 145.0 |
| C | 6 | 223 | 325595 | 1663.69 | 709 | 701 | 195.3 |
| C | 12 | 254 | 257400 | 1314.48 | 709 | 701 | 195.3 |
| C | 12 | 252 | 250276 | 1278.0 | 709 | 701 | 195.3 |
| D | 8 | 160 | 287894 | 1456.58 | 701 | 669 | 197.2 |
| D | 2 | 31 | 169859 | 858.0 | 701 | 669 | 197.2 |
| D | 2 | 249 | 161019 | 813.17 | 701 | 669 | 197.2 |
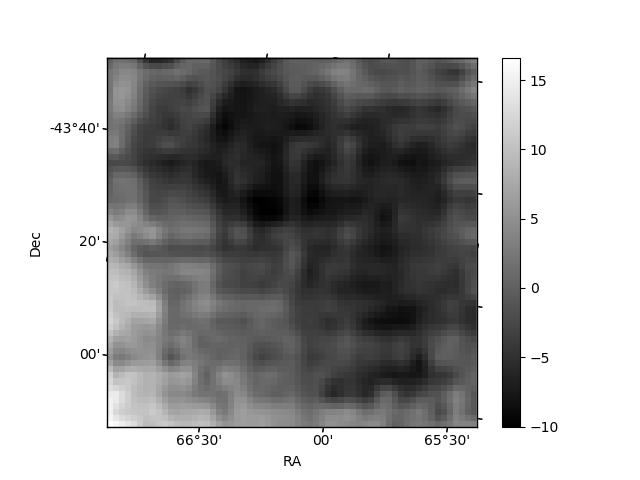
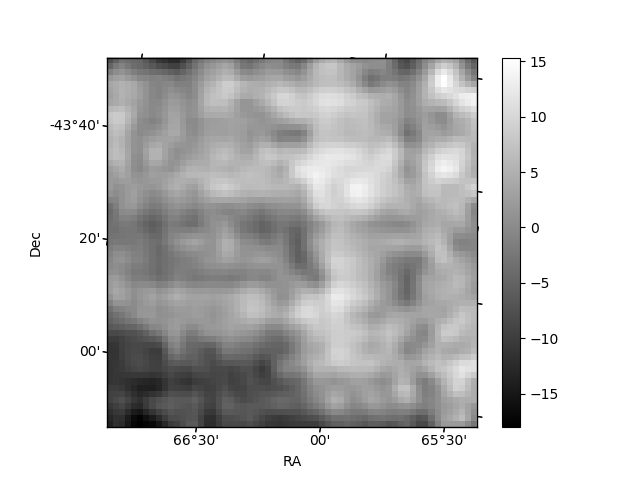
Histogram calculated using DETX and DETY for each event in the final _common_clean file
| Quadrant A | 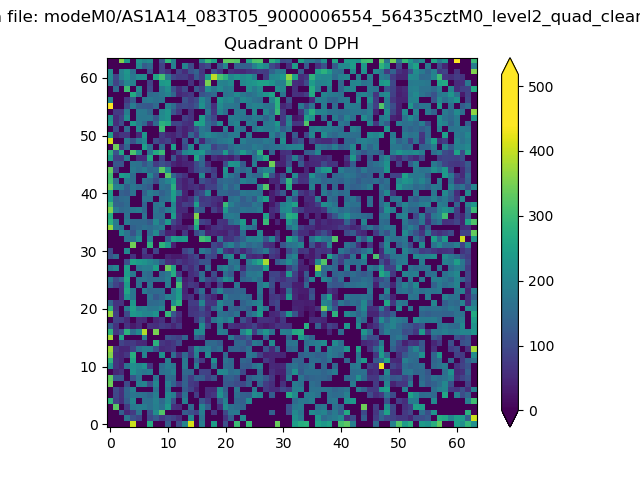 |
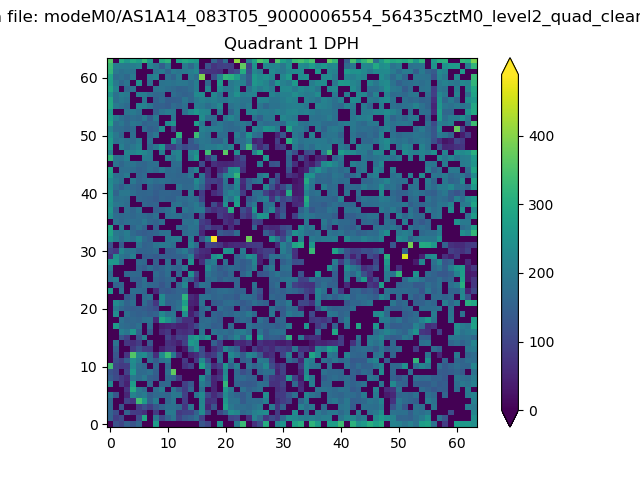 |
Quadrant B |
|---|---|---|---|
| Quadrant D | 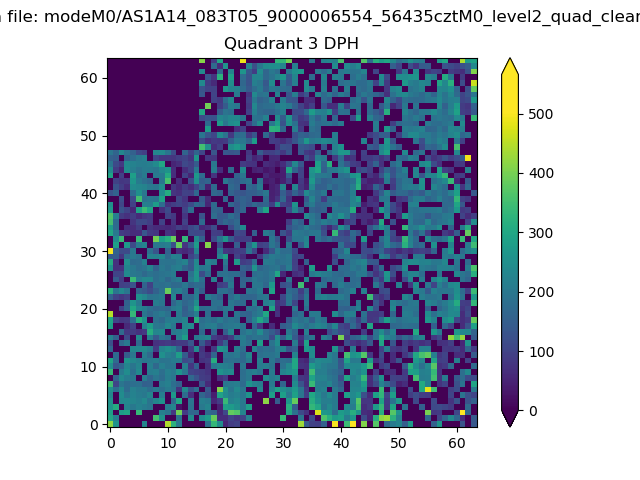 |
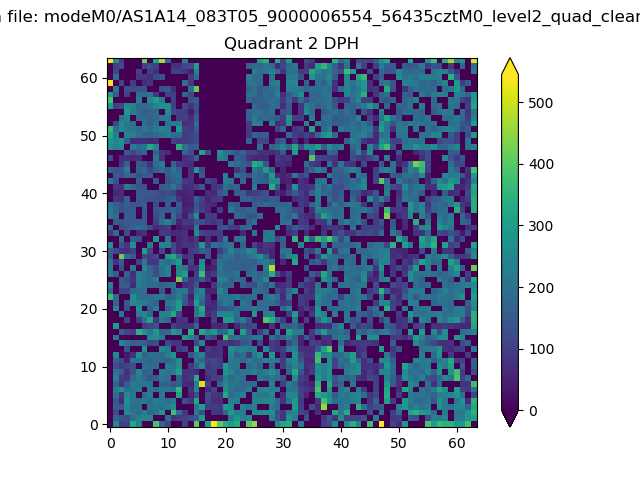 |
Quadrant C |
| Plot type | Count rate plots | Images |
|---|---|---|
| Comparison with Poisson distribution Blue bars denote a histogram of data divided into 1 sec bins. Red curve is a Poisson curve with rate = median count rate of data. |
 |
 |
| Quadrant-wise count rates Data is divided into 100 sec bins |
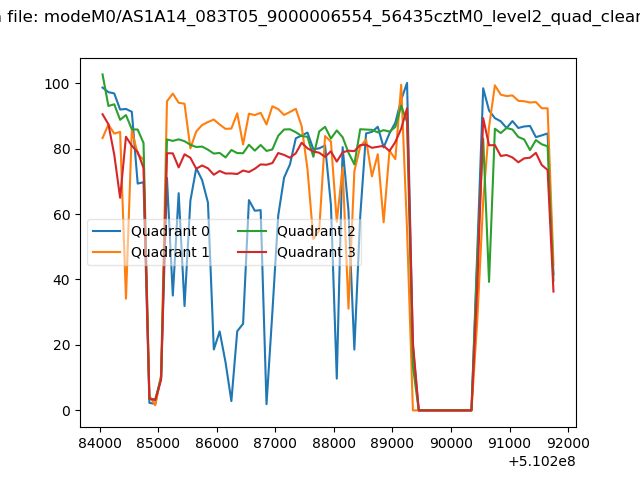 |
|
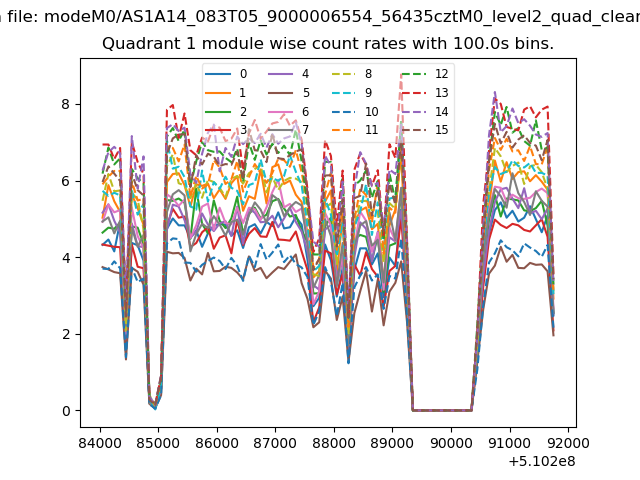
| Module-wise count rates for Quadrant A Data is divided into 100 sec bins |
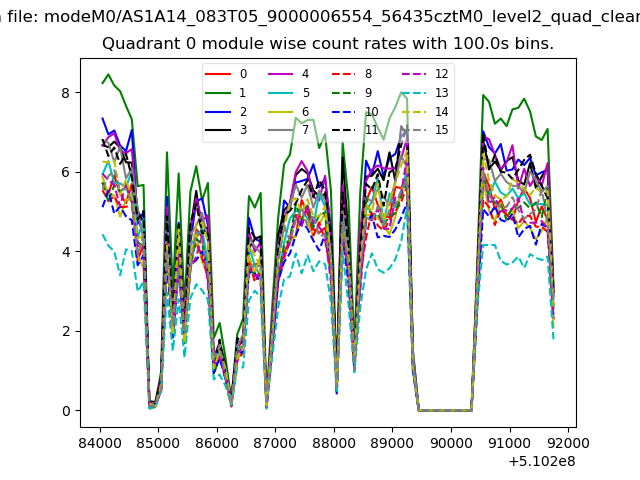 |
 |
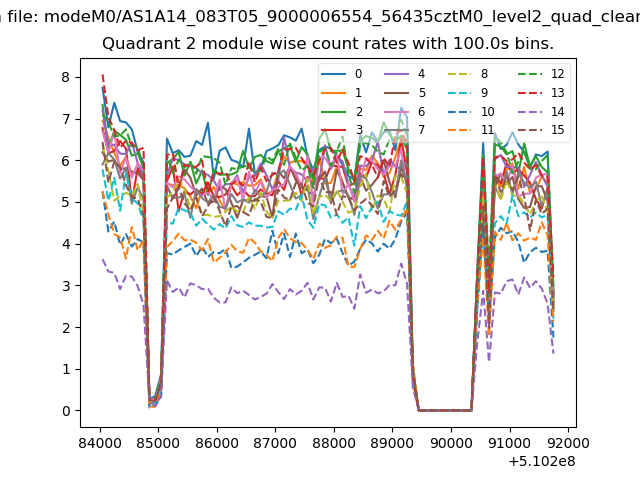
| Module-wise count rates for Quadrant B Data is divided into 100 sec bins |
 |
 |
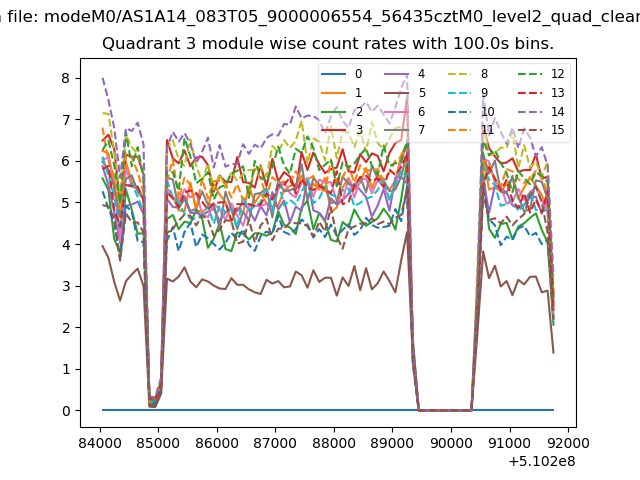
| Module-wise count rates for Quadrant C Data is divided into 100 sec bins |
 |
 |
| Module-wise count rates for Quadrant D Data is divided into 100 sec bins |
 |
 |
| Parameter | Plot |
|---|---|
| CZT HV Monitor |  |
| D_VDD | 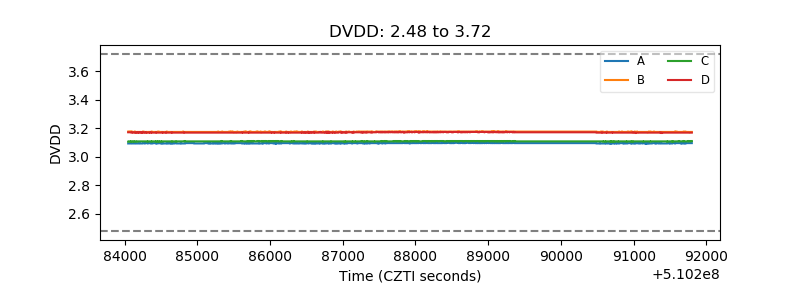 |
| Temperature 1 | 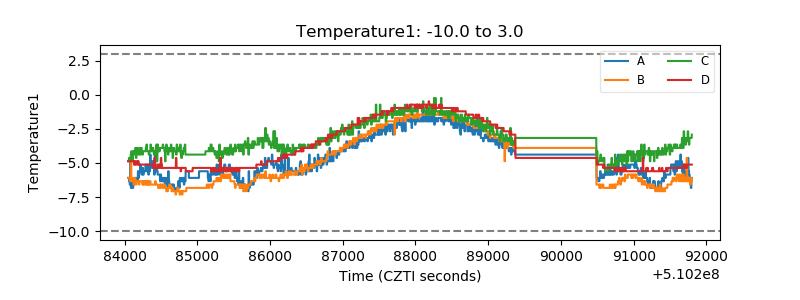 |
| Veto HV Monitor | 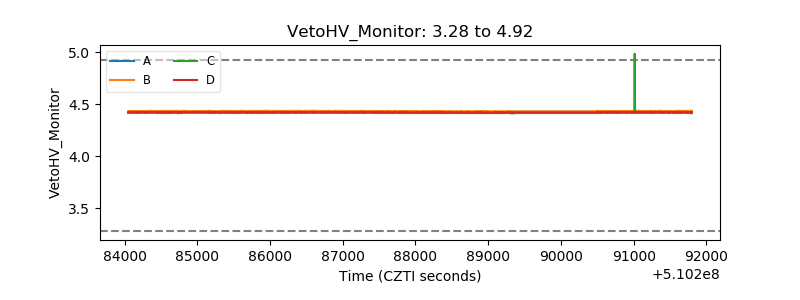 |
| Veto LLD | 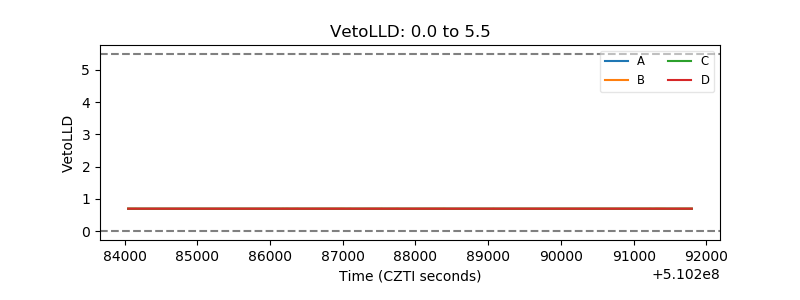 |
| Alpha Counter |  |
| _CPM_Rate |  |
| CZT Counter | 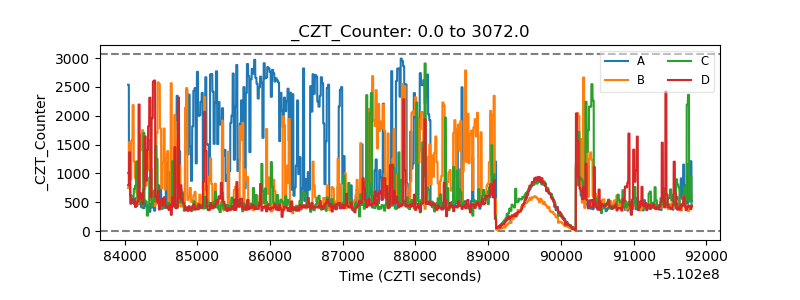 |
| +2.5 Volts monitor | 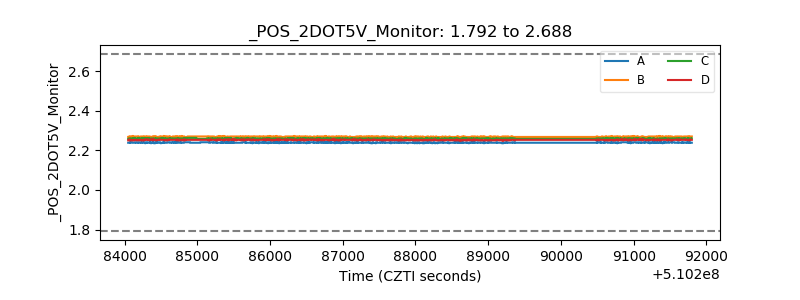 |
| +5 Volts monitor |  |
| _ROLL_ROT | 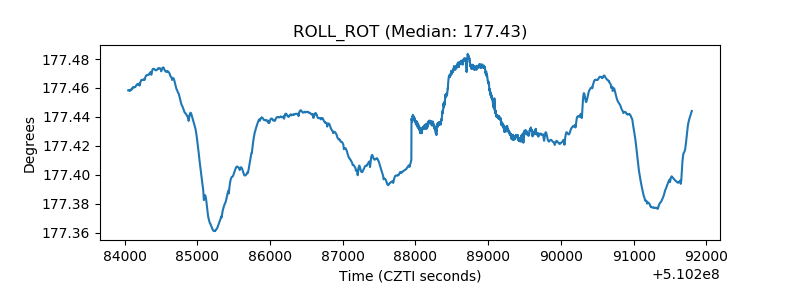 |
| _Roll_DEC | 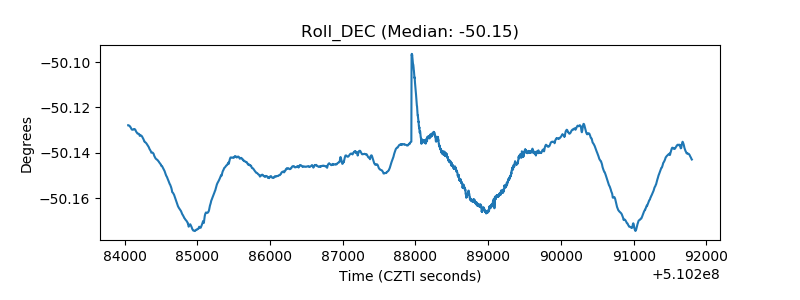 |
| _Roll_RA |  |
| Veto Counter | 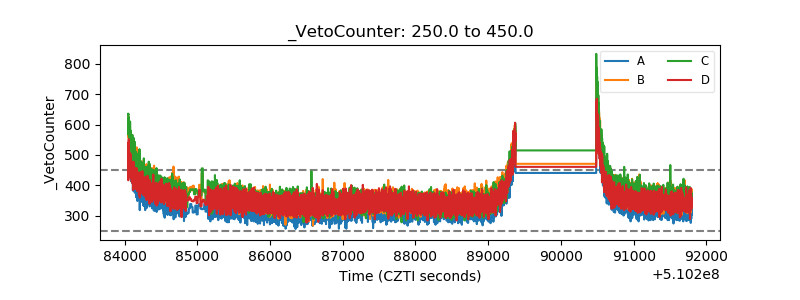 |