| Param | Original file | Final file |
|---|---|---|
| Filename | modeM0/AS1A14_083T05_9000006554_56437cztM0_level2.fits | modeM0/AS1A14_083T05_9000006554_56437cztM0_level2_quad_clean.evt |
| Size (bytes) | 735,517,440 | 98,596,800 |
| Size | 701.4 MB | 94.0 MB |
| Events in quadrant A | 6,516,150 | 627,738 |
| Events in quadrant B | 7,383,714 | 631,602 |
| Events in quadrant C | 8,212,979 | 554,087 |
| Events in quadrant D | 4,524,249 | 643,139 |
| Mode M9 | |||
|---|---|---|---|
| Quadrant | BADHDUFLAG | Total packets | Discarded packets |
| A | 0 | 14 | 0 |
| B | 0 | 14 | 0 |
| C | 0 | 14 | 0 |
| D | 0 | 14 | 0 |
| Mode SS | |||
|---|---|---|---|
| Quadrant | BADHDUFLAG | Total packets | Discarded packets |
| A | 0 | 156 | 0 |
| B | 0 | 156 | 0 |
| C | 0 | 156 | 0 |
| D | 0 | 156 | 0 |
| Mode M0 | |||
|---|---|---|---|
| Quadrant | BADHDUFLAG | Total packets | Discarded packets |
| A | 0 | 24619 | 6 |
| B | 0 | 27226 | 2 |
| C | 0 | 29575 | 2 |
| D | 0 | 18729 | 2 |
| Quadrant | Total seconds | Saturated seconds | Saturation percentage |
|---|---|---|---|
| A | 7598 | 1197 | 15.754146% |
| B | 7599 | 1668 | 21.950257% |
| C | 7599 | 1800 | 23.687327% |
| D | 7599 | 251 | 3.303066% |
Noise dominated data is calculated using 1-second bins in cleaned event files. If a bin has >2000 counts, and if more than 50% of those come from <1% of pixels, then it is considered to be noise-dominated and hence unusable.
| Quadrant | # 1 sec bins | Bins with >0 counts | Bins with >2000 counts | High rate bins dominated by noise | Noise dominated (total time) | Noise dominated (detector-on time) | Marked lightcurve |
|---|---|---|---|---|---|---|---|
| A | 9087 | 7598 | 996 | 996 | 10.96% | 13.11% |  |
| B | 9089 | 7600 | 1013 | 1013 | 11.15% | 13.33% |  |
| C | 9089 | 7600 | 1499 | 1499 | 16.49% | 19.72% | 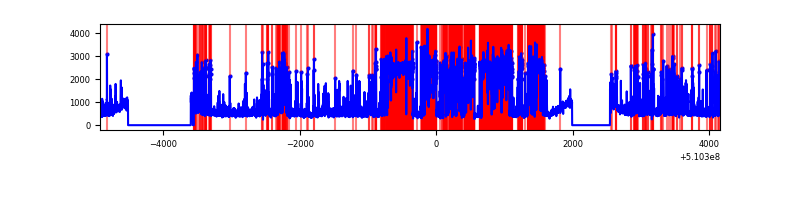 |
| D | 9089 | 7599 | 109 | 109 | 1.20% | 1.43% | 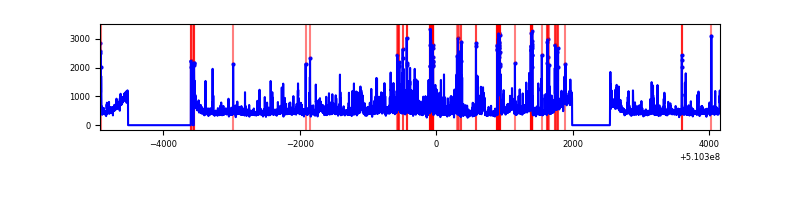 |
Top three noisy pixels from each quadrant. If the there are fewer than three noisy pixels in the level2.evt file, extra rows are filled as -1
| Pixel properties | Quadrant properties | ||||||
|---|---|---|---|---|---|---|---|
| Quadrant | DetID | PixID | Counts | Sigma | Mean | Median | Sigma |
| A | 12 | 3 | 2155749 | 10972.88 | 800 | 781 | 196.4 |
| A | 8 | 249 | 464630 | 2361.87 | 800 | 781 | 196.4 |
| A | 12 | 194 | 293096 | 1488.44 | 800 | 781 | 196.4 |
| B | 4 | 206 | 3857552 | 23543.27 | 765 | 737 | 163.8 |
| B | 0 | 231 | 165659 | 1006.74 | 765 | 737 | 163.8 |
| B | 10 | 247 | 77482 | 468.48 | 765 | 737 | 163.8 |
| C | 12 | 254 | 4392768 | 21601.97 | 749 | 741 | 203.3 |
| C | 12 | 252 | 368977 | 1811.15 | 749 | 741 | 203.3 |
| C | 1 | 16 | 288798 | 1416.79 | 749 | 741 | 203.3 |
| D | 11 | 176 | 448786 | 1951.44 | 829 | 792 | 229.6 |
| D | 2 | 249 | 324848 | 1411.57 | 829 | 792 | 229.6 |
| D | 8 | 240 | 96860 | 418.47 | 829 | 792 | 229.6 |
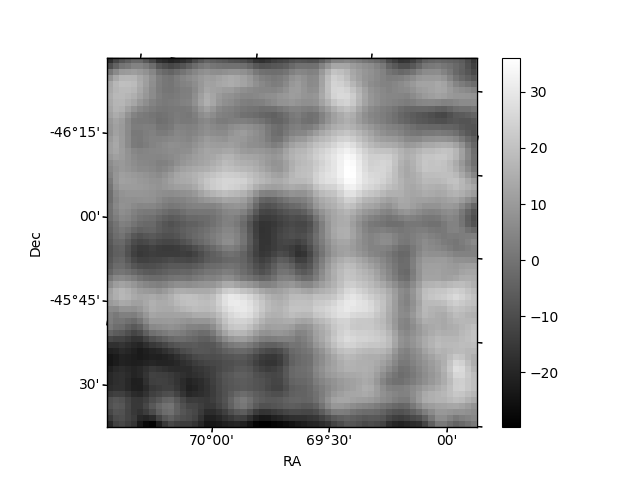
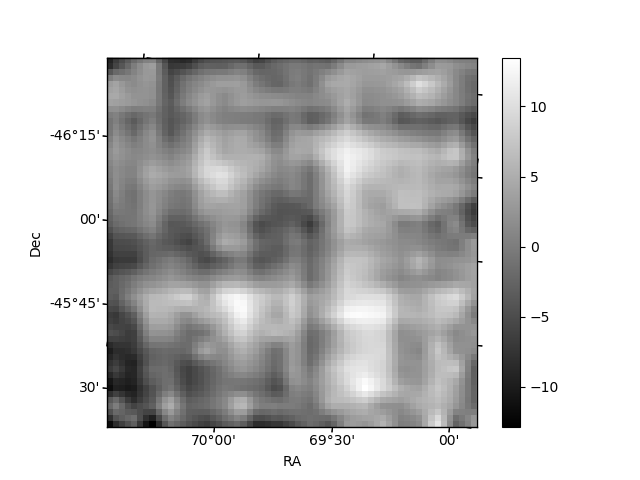
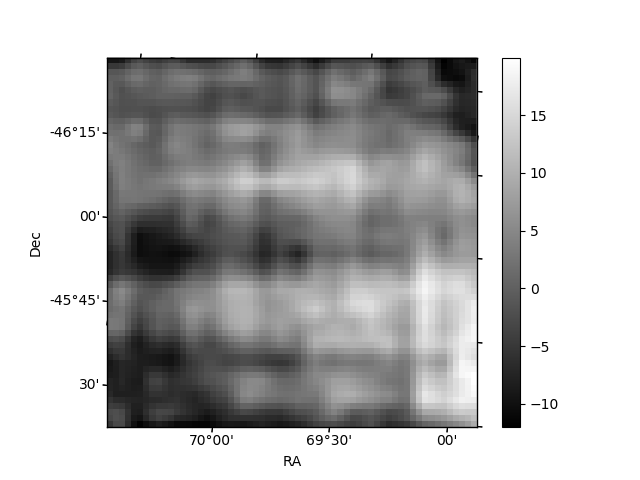
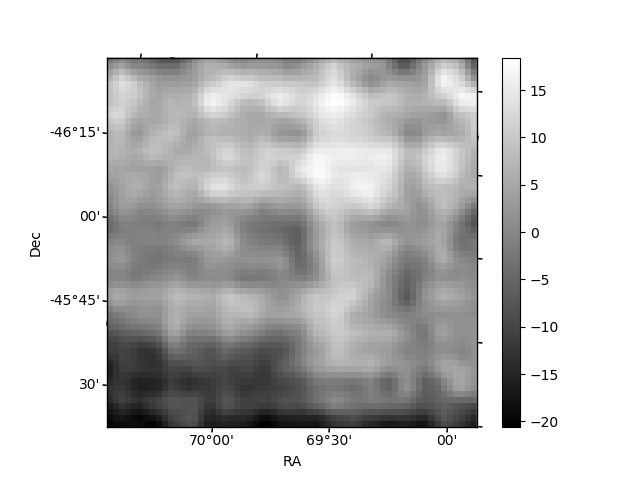
Histogram calculated using DETX and DETY for each event in the final _common_clean file
| Quadrant A |  |
 |
Quadrant B |
|---|---|---|---|
| Quadrant D | 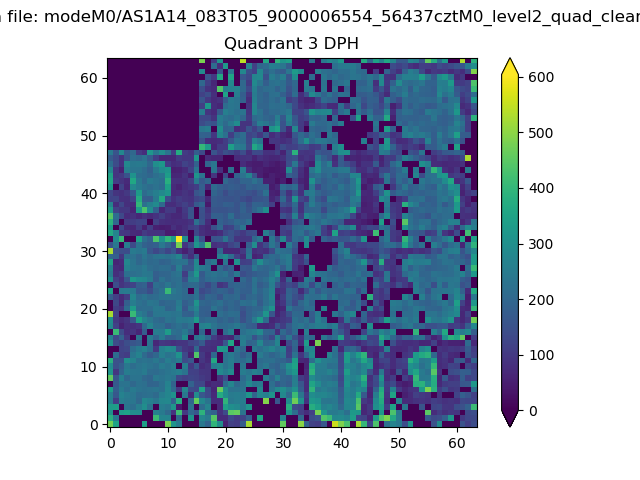 |
 |
Quadrant C |
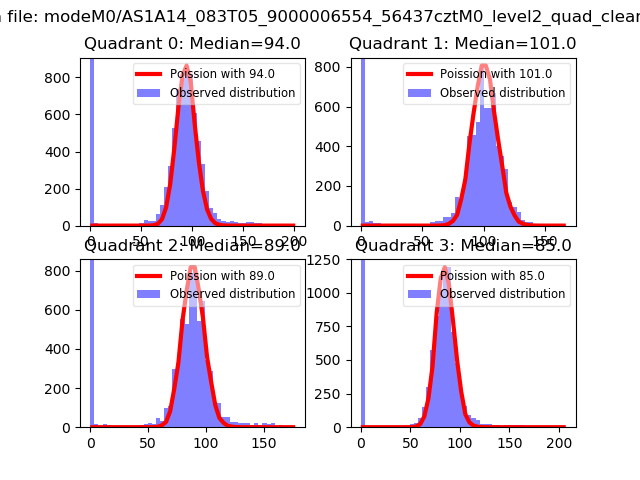
| Plot type | Count rate plots | Images |
|---|---|---|
| Comparison with Poisson distribution Blue bars denote a histogram of data divided into 1 sec bins. Red curve is a Poisson curve with rate = median count rate of data. |
 |
 |
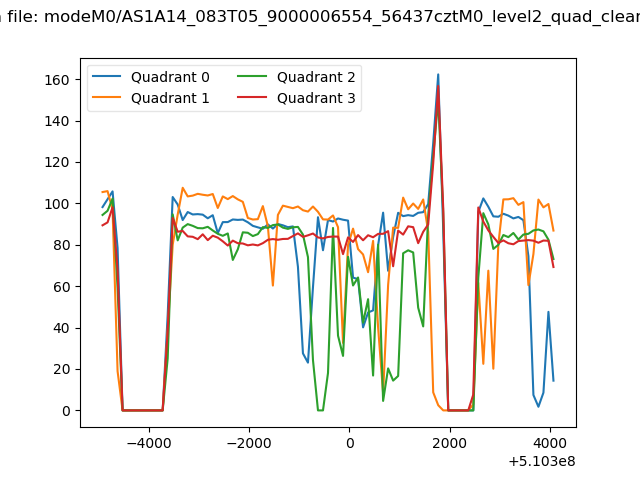
| Quadrant-wise count rates Data is divided into 100 sec bins |
 |
|
| Module-wise count rates for Quadrant A Data is divided into 100 sec bins |
 |
 |
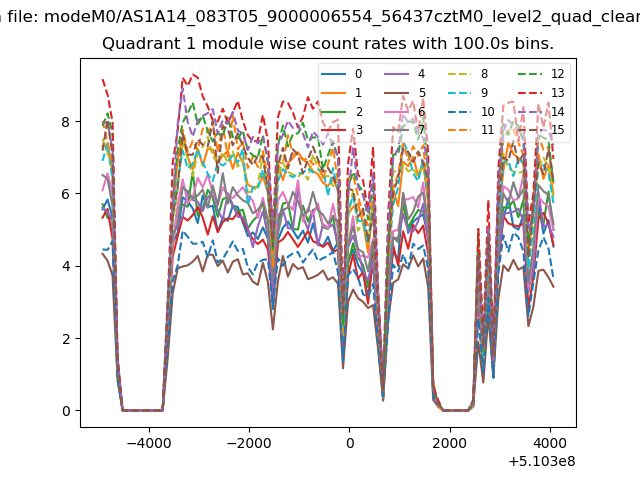
| Module-wise count rates for Quadrant B Data is divided into 100 sec bins |
 |
 |
| Module-wise count rates for Quadrant C Data is divided into 100 sec bins |
 |
 |
| Module-wise count rates for Quadrant D Data is divided into 100 sec bins |
 |
 |
| Parameter | Plot |
|---|---|
| CZT HV Monitor | 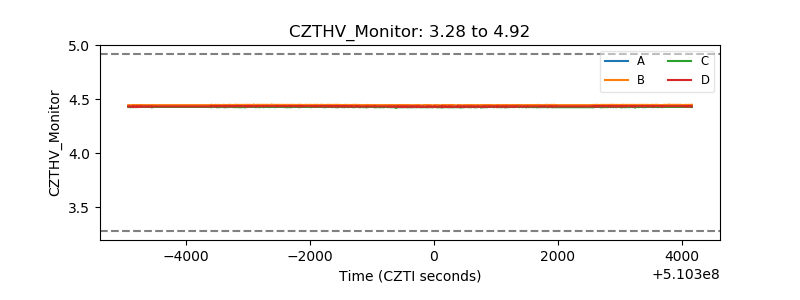 |
| D_VDD |  |
| Temperature 1 | 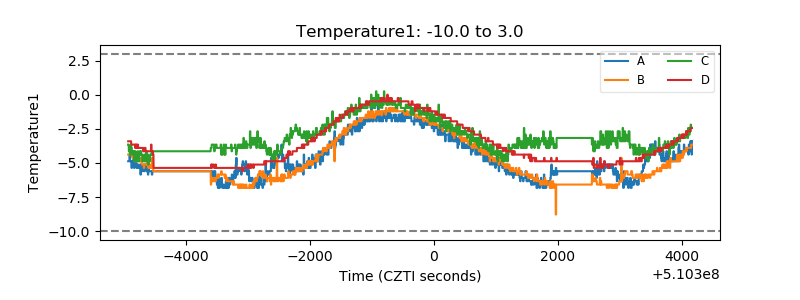 |
| Veto HV Monitor | 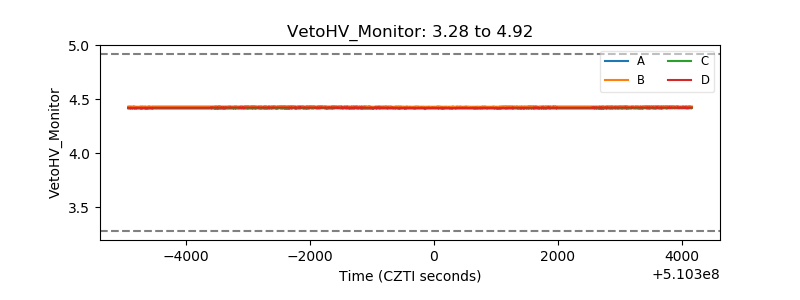 |
| Veto LLD | 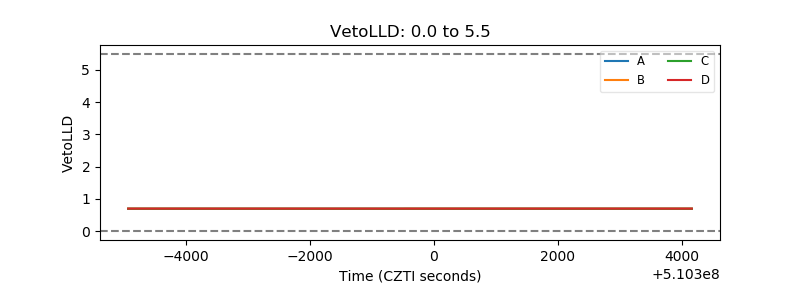 |
| Alpha Counter | 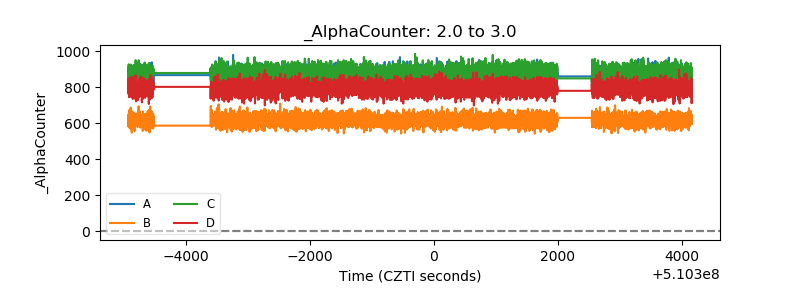 |
| _CPM_Rate | 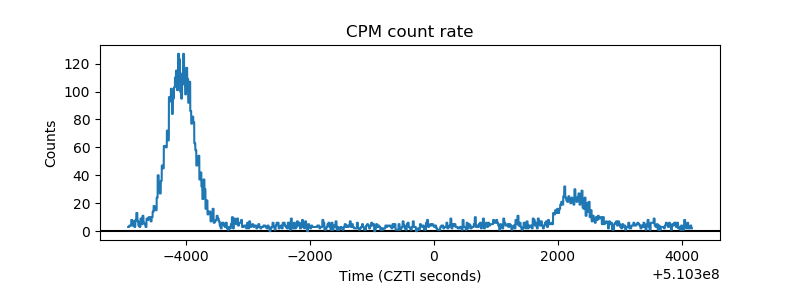 |
| CZT Counter |  |
| +2.5 Volts monitor |  |
| +5 Volts monitor | 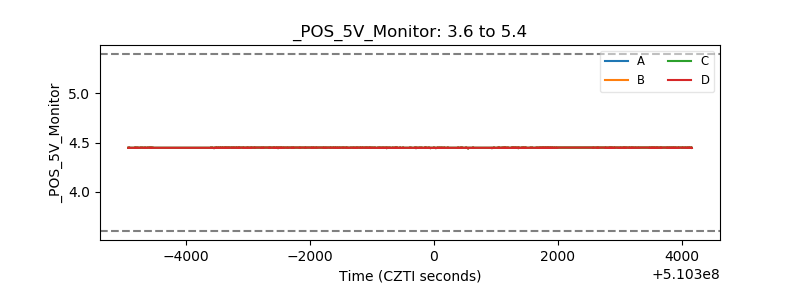 |
| _ROLL_ROT | 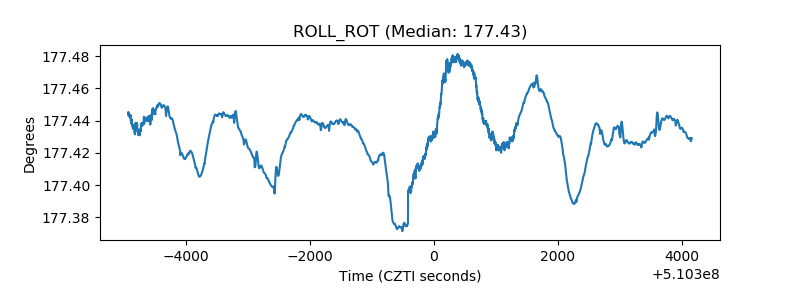 |
| _Roll_DEC | 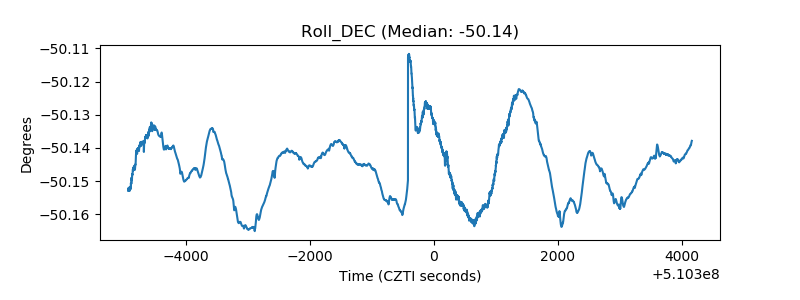 |
| _Roll_RA |  |
| Veto Counter | 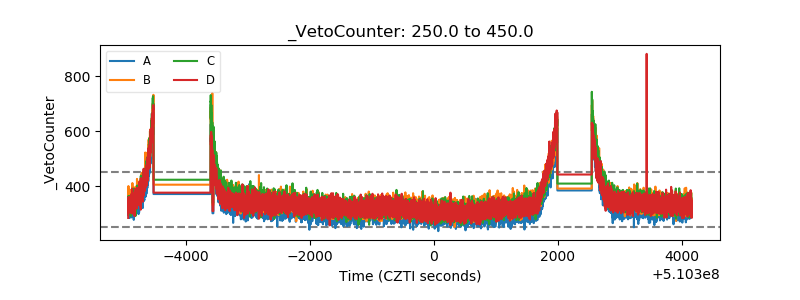 |