| Param | Original file | Final file |
|---|---|---|
| Filename | modeM0/AS1A14_083T05_9000006554_56438cztM0_level2.fits | modeM0/AS1A14_083T05_9000006554_56438cztM0_level2_quad_clean.evt |
| Size (bytes) | 854,841,600 | 88,418,880 |
| Size | 815.2 MB | 84.3 MB |
| Events in quadrant A | 10,600,443 | 486,473 |
| Events in quadrant B | 7,251,929 | 670,345 |
| Events in quadrant C | 7,981,666 | 359,110 |
| Events in quadrant D | 5,212,000 | 626,039 |
| Mode SS | |||
|---|---|---|---|
| Quadrant | BADHDUFLAG | Total packets | Discarded packets |
| A | 0 | 154 | 0 |
| B | 0 | 154 | 0 |
| C | 0 | 154 | 0 |
| D | 0 | 154 | 0 |
| Mode M0 | |||
|---|---|---|---|
| Quadrant | BADHDUFLAG | Total packets | Discarded packets |
| A | 0 | 36651 | 0 |
| B | 0 | 26855 | 0 |
| C | 0 | 29095 | 0 |
| D | 0 | 20914 | 0 |
| Quadrant | Total seconds | Saturated seconds | Saturation percentage |
|---|---|---|---|
| A | 7688 | 2629 | 34.196150% |
| B | 7688 | 1392 | 18.106139% |
| C | 7689 | 3797 | 49.382234% |
| D | 7689 | 401 | 5.215243% |
Noise dominated data is calculated using 1-second bins in cleaned event files. If a bin has >2000 counts, and if more than 50% of those come from <1% of pixels, then it is considered to be noise-dominated and hence unusable.
| Quadrant | # 1 sec bins | Bins with >0 counts | Bins with >2000 counts | High rate bins dominated by noise | Noise dominated (total time) | Noise dominated (detector-on time) | Marked lightcurve |
|---|---|---|---|---|---|---|---|
| A | 7688 | 7688 | 2478 | 2478 | 32.23% | 32.23% |  |
| B | 7688 | 7688 | 952 | 952 | 12.38% | 12.38% | 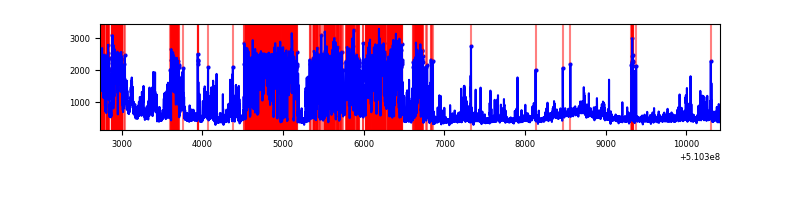 |
| C | 7688 | 7688 | 603 | 603 | 7.84% | 7.84% | 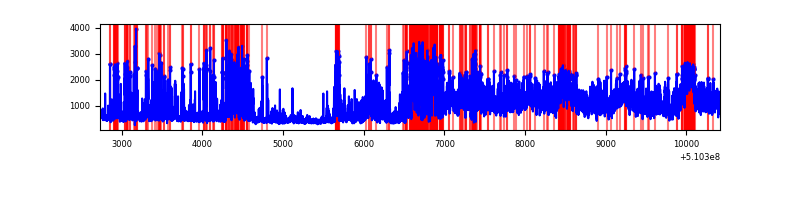 |
| D | 7689 | 7689 | 389 | 389 | 5.06% | 5.06% |  |
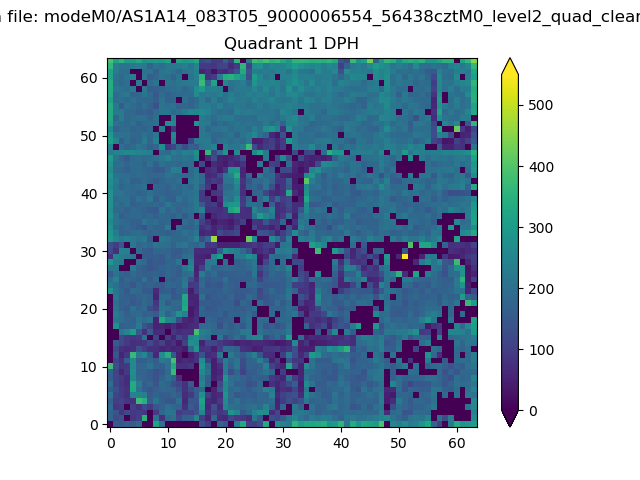
Top three noisy pixels from each quadrant. If the there are fewer than three noisy pixels in the level2.evt file, extra rows are filled as -1
| Pixel properties | Quadrant properties | ||||||
|---|---|---|---|---|---|---|---|
| Quadrant | DetID | PixID | Counts | Sigma | Mean | Median | Sigma |
| A | 12 | 3 | 5639606 | 34070.52 | 668 | 650 | 165.5 |
| A | 4 | 95 | 1091072 | 6588.32 | 668 | 650 | 165.5 |
| A | 12 | 194 | 709625 | 4283.62 | 668 | 650 | 165.5 |
| B | 4 | 206 | 2760367 | 16488.52 | 783 | 753 | 167.4 |
| B | 5 | 185 | 853584 | 5095.61 | 783 | 753 | 167.4 |
| B | 4 | 21 | 112322 | 666.62 | 783 | 753 | 167.4 |
| C | 12 | 254 | 5685004 | 47870.23 | 432 | 428 | 118.7 |
| C | 15 | 209 | 277357 | 2332.04 | 432 | 428 | 118.7 |
| C | 1 | 16 | 170314 | 1430.62 | 432 | 428 | 118.7 |
| D | 2 | 249 | 1296012 | 5796.06 | 797 | 761 | 223.5 |
| D | 2 | 31 | 282036 | 1258.66 | 797 | 761 | 223.5 |
| D | 11 | 176 | 157695 | 702.26 | 797 | 761 | 223.5 |
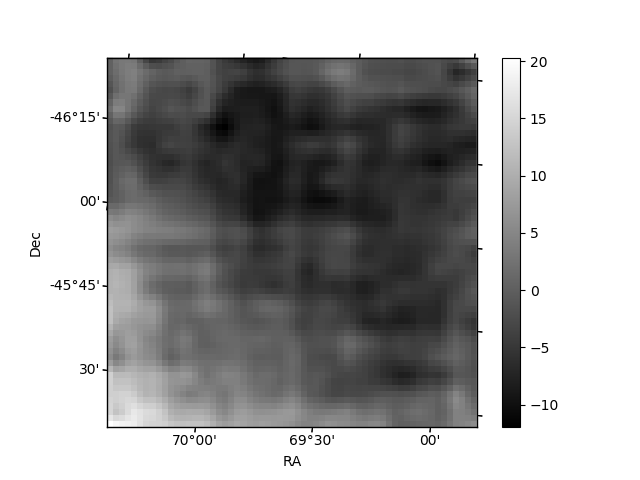
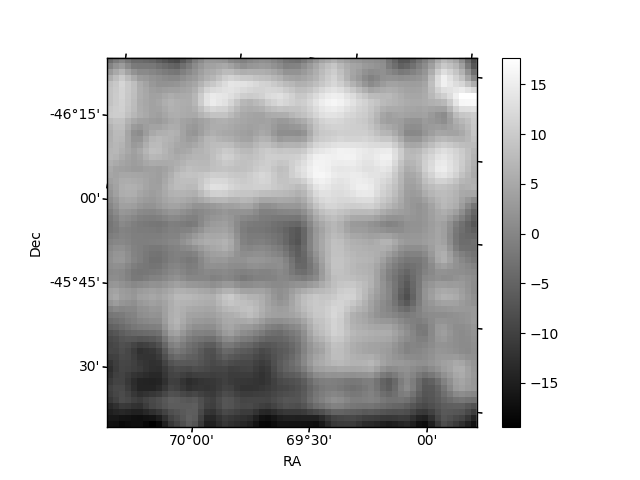
Histogram calculated using DETX and DETY for each event in the final _common_clean file
| Quadrant A | 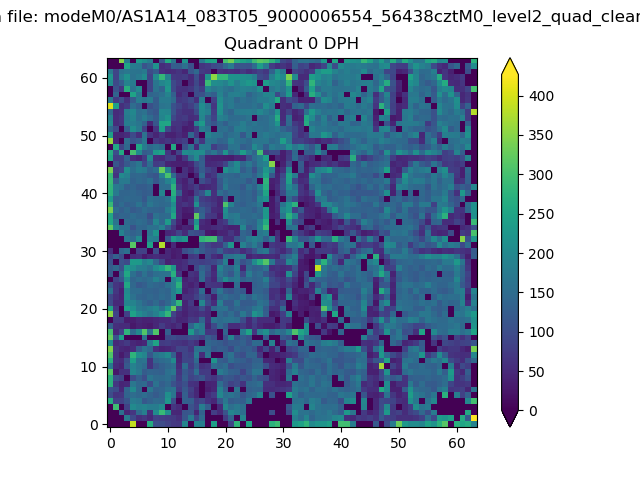 |
 |
Quadrant B |
|---|---|---|---|
| Quadrant D | 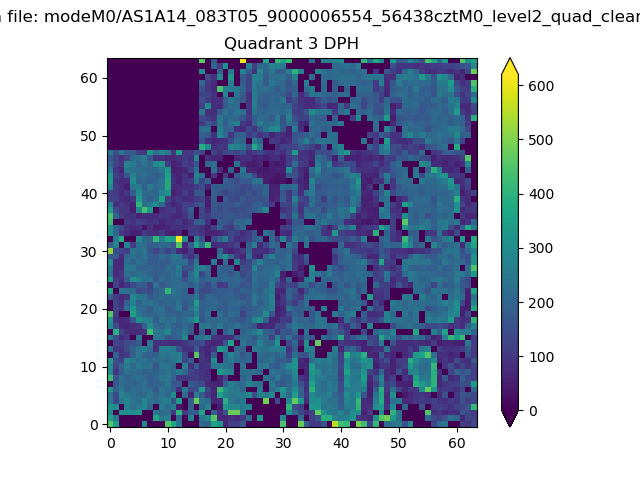 |
 |
Quadrant C |
| Plot type | Count rate plots | Images |
|---|---|---|
| Comparison with Poisson distribution Blue bars denote a histogram of data divided into 1 sec bins. Red curve is a Poisson curve with rate = median count rate of data. |
 |
 |
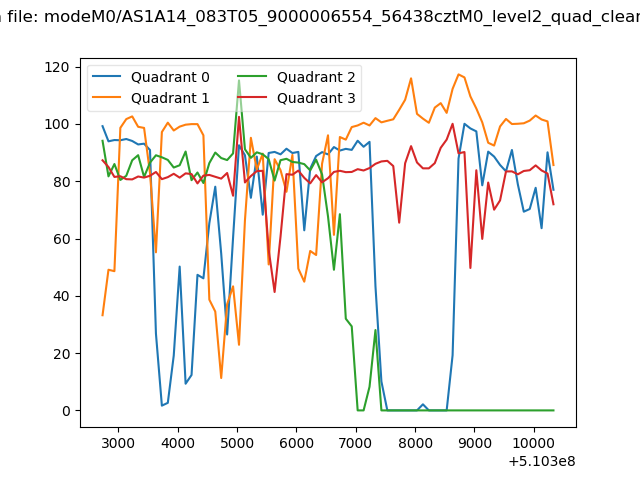
| Quadrant-wise count rates Data is divided into 100 sec bins |
 |
|
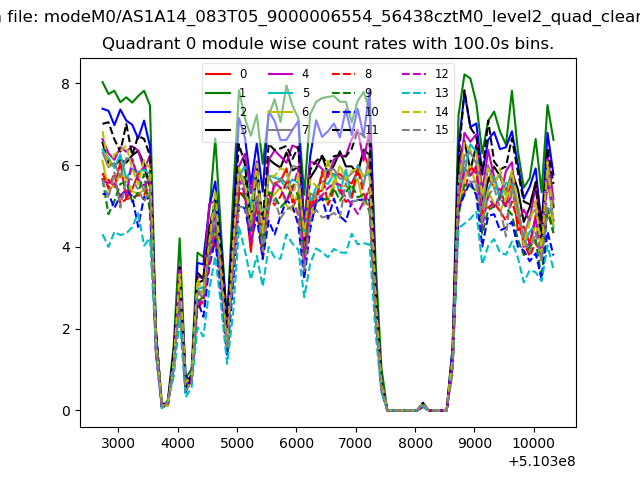
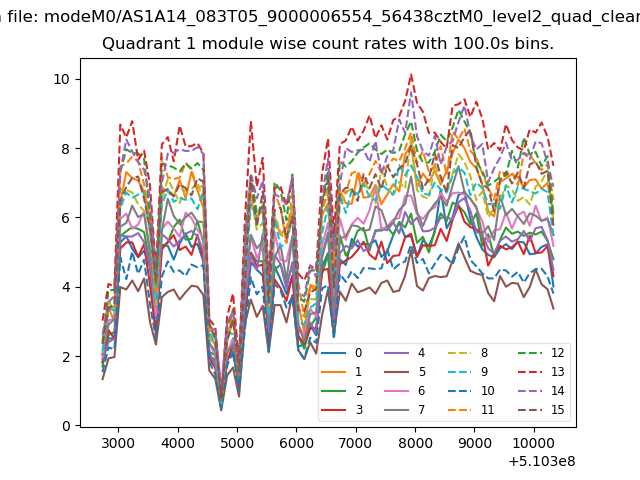
| Module-wise count rates for Quadrant A Data is divided into 100 sec bins |
 |
 |
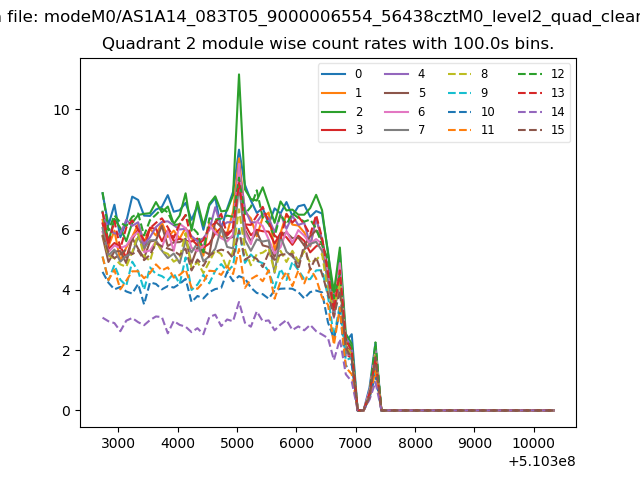
| Module-wise count rates for Quadrant B Data is divided into 100 sec bins |
 |
 |
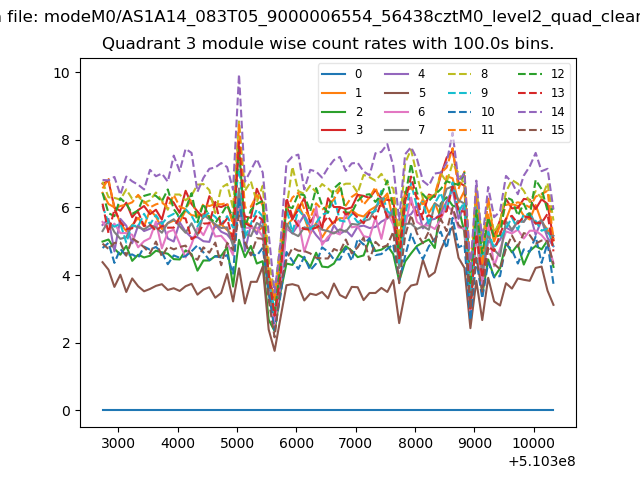
| Module-wise count rates for Quadrant C Data is divided into 100 sec bins |
 |
 |
| Module-wise count rates for Quadrant D Data is divided into 100 sec bins |
 |
 |
| Parameter | Plot |
|---|---|
| CZT HV Monitor |  |
| D_VDD | 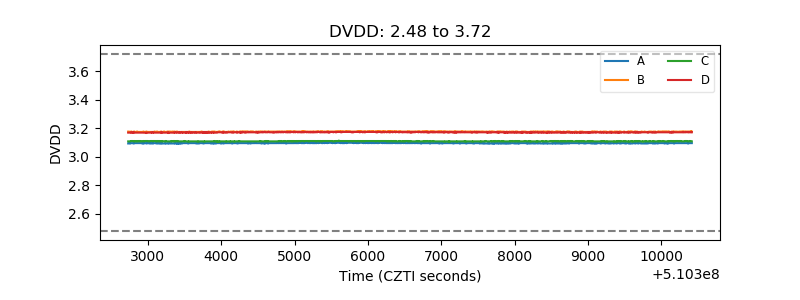 |
| Temperature 1 |  |
| Veto HV Monitor | 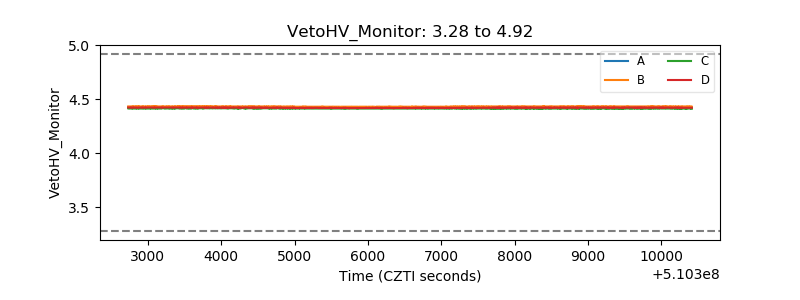 |
| Veto LLD | 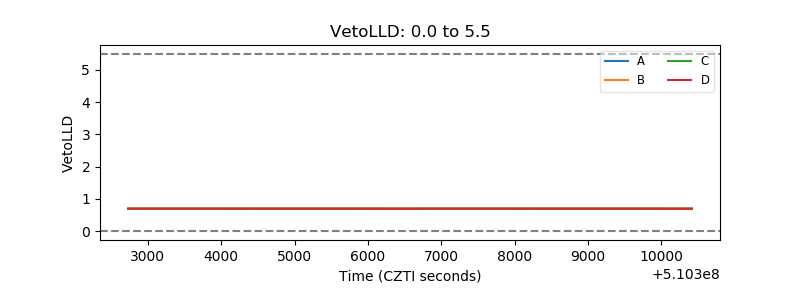 |
| Alpha Counter |  |
| _CPM_Rate | 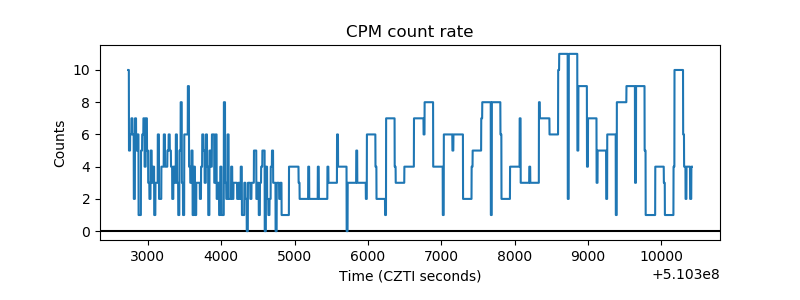 |
| CZT Counter | 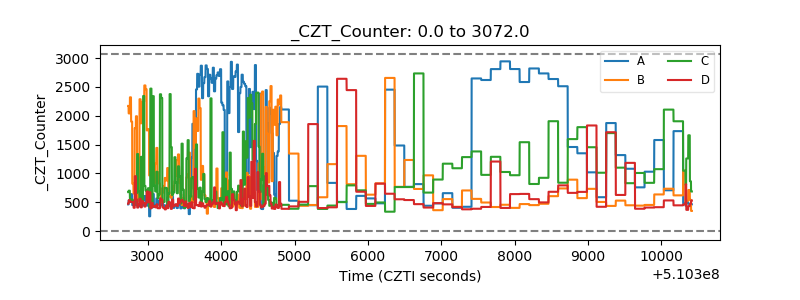 |
| +2.5 Volts monitor | 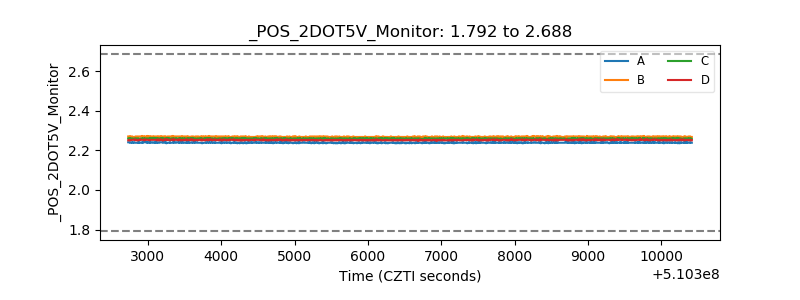 |
| +5 Volts monitor |  |
| _ROLL_ROT | 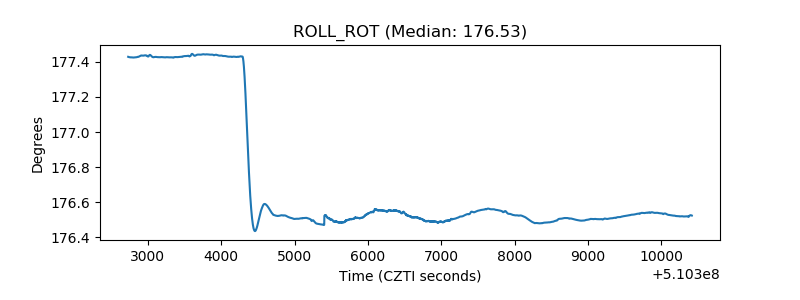 |
| _Roll_DEC | 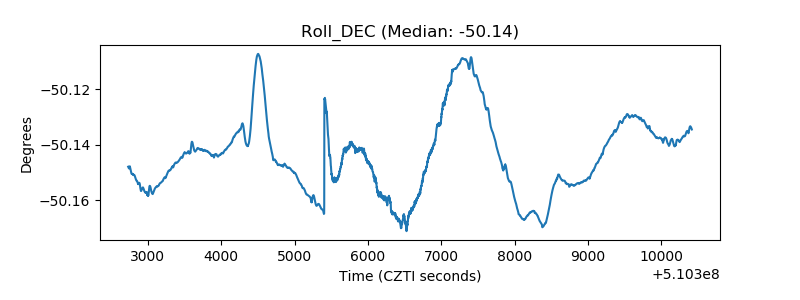 |
| _Roll_RA |  |
| Veto Counter | 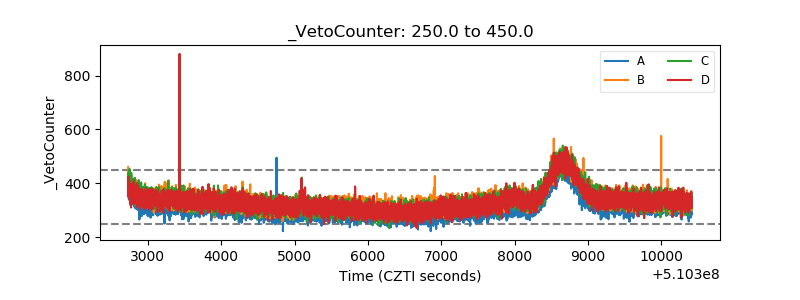 |