| Param | Original file | Final file |
|---|---|---|
| Filename | modeM0/AS1A14_083T05_9000006554_56440cztM0_level2.fits | modeM0/AS1A14_083T05_9000006554_56440cztM0_level2_quad_clean.evt |
| Size (bytes) | 1,041,071,040 | 79,577,280 |
| Size | 992.8 MB | 75.9 MB |
| Events in quadrant A | 11,622,068 | 466,951 |
| Events in quadrant B | 5,199,648 | 761,783 |
| Events in quadrant C | 15,133,510 | 51,206 |
| Events in quadrant D | 5,995,643 | 602,666 |
| Mode SS | |||
|---|---|---|---|
| Quadrant | BADHDUFLAG | Total packets | Discarded packets |
| A | 0 | 152 | 0 |
| B | 0 | 152 | 0 |
| C | 0 | 152 | 0 |
| D | 0 | 152 | 0 |
| Mode M0 | |||
|---|---|---|---|
| Quadrant | BADHDUFLAG | Total packets | Discarded packets |
| A | 0 | 39737 | 0 |
| B | 0 | 20694 | 0 |
| C | 0 | 50121 | 0 |
| D | 0 | 23248 | 0 |
| Quadrant | Total seconds | Saturated seconds | Saturation percentage |
|---|---|---|---|
| A | 7566 | 2835 | 37.470262% |
| B | 7566 | 183 | 2.418715% |
| C | 7567 | 7029 | 92.890181% |
| D | 7567 | 582 | 7.691291% |
Noise dominated data is calculated using 1-second bins in cleaned event files. If a bin has >2000 counts, and if more than 50% of those come from <1% of pixels, then it is considered to be noise-dominated and hence unusable.
| Quadrant | # 1 sec bins | Bins with >0 counts | Bins with >2000 counts | High rate bins dominated by noise | Noise dominated (total time) | Noise dominated (detector-on time) | Marked lightcurve |
|---|---|---|---|---|---|---|---|
| A | 7566 | 7566 | 2706 | 2706 | 35.77% | 35.77% |  |
| B | 7566 | 7566 | 80 | 80 | 1.06% | 1.06% |  |
| C | 7567 | 7567 | 4216 | 4216 | 55.72% | 55.72% | 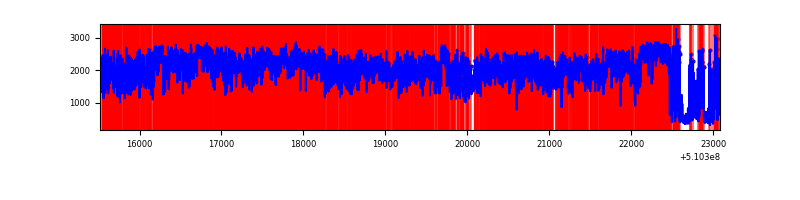 |
| D | 7567 | 7567 | 548 | 548 | 7.24% | 7.24% |  |
Top three noisy pixels from each quadrant. If the there are fewer than three noisy pixels in the level2.evt file, extra rows are filled as -1
| Pixel properties | Quadrant properties | ||||||
|---|---|---|---|---|---|---|---|
| Quadrant | DetID | PixID | Counts | Sigma | Mean | Median | Sigma |
| A | 12 | 3 | 5821104 | 35081.51 | 659 | 641 | 165.9 |
| A | 3 | 62 | 800783 | 4822.67 | 659 | 641 | 165.9 |
| A | 12 | 194 | 746545 | 4495.77 | 659 | 641 | 165.9 |
| B | 4 | 21 | 1465846 | 8481.09 | 806 | 777 | 172.7 |
| B | 10 | 247 | 119719 | 688.54 | 806 | 777 | 172.7 |
| B | 1 | 159 | 80888 | 463.75 | 806 | 777 | 172.7 |
| C | 12 | 254 | 14173663 | 377473.78 | 131 | 129 | 37.5 |
| C | 1 | 16 | 313665 | 8350.18 | 131 | 129 | 37.5 |
| C | 15 | 209 | 37107 | 984.81 | 131 | 129 | 37.5 |
| D | 2 | 249 | 1619482 | 7446.11 | 768 | 734 | 217.4 |
| D | 11 | 176 | 577803 | 2654.47 | 768 | 734 | 217.4 |
| D | 14 | 52 | 250143 | 1147.26 | 768 | 734 | 217.4 |
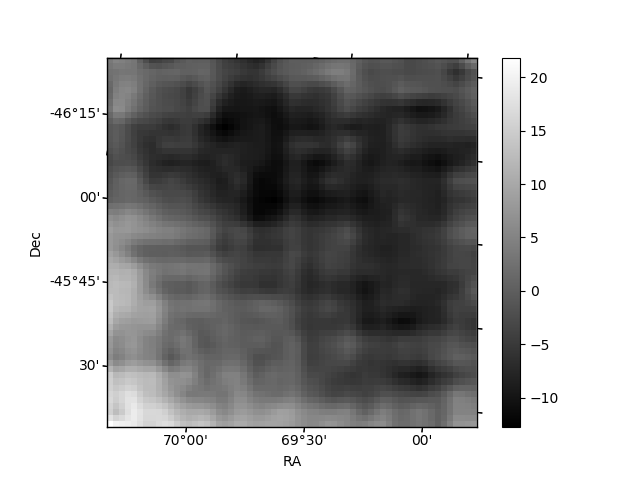
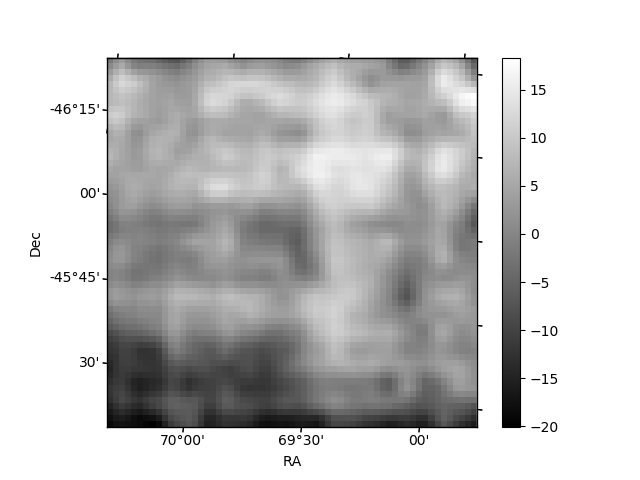
Histogram calculated using DETX and DETY for each event in the final _common_clean file
| Quadrant A | 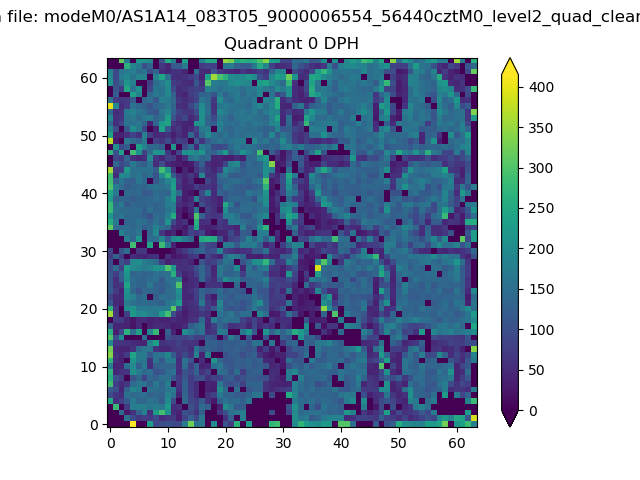 |
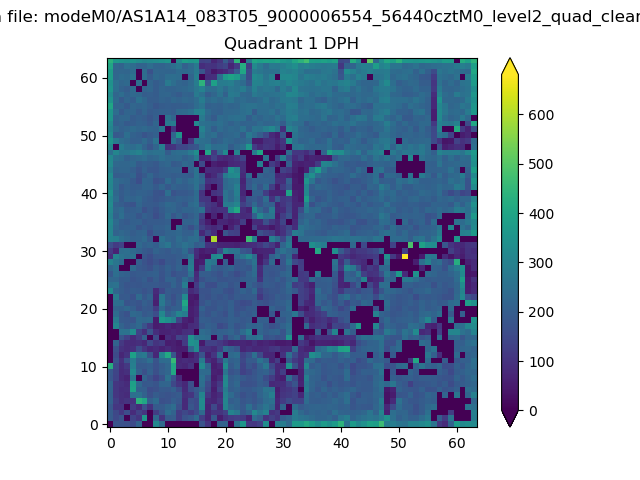 |
Quadrant B |
|---|---|---|---|
| Quadrant D | 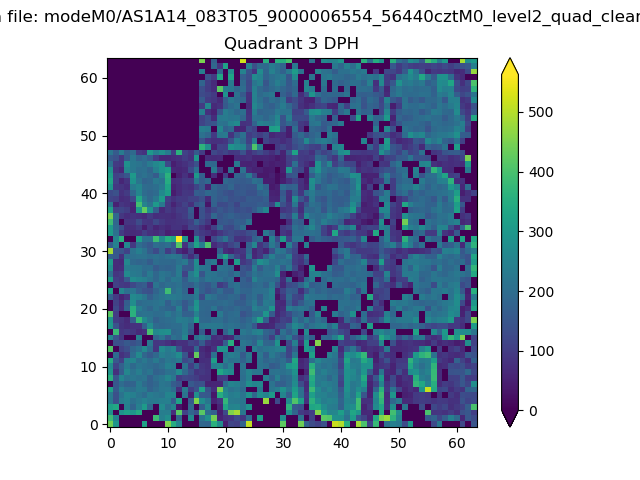 |
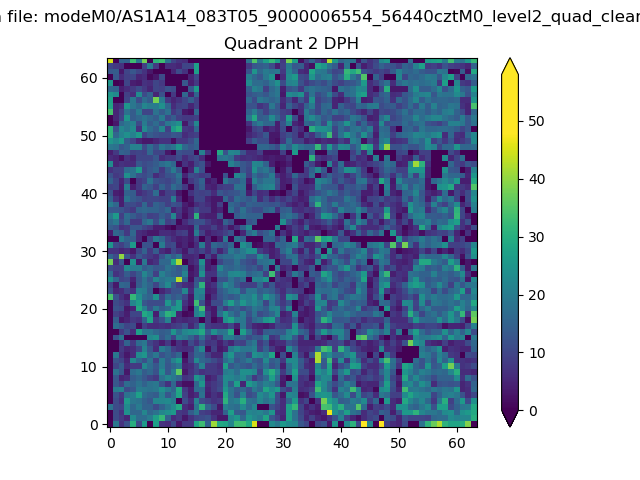 |
Quadrant C |
| Plot type | Count rate plots | Images |
|---|---|---|
| Comparison with Poisson distribution Blue bars denote a histogram of data divided into 1 sec bins. Red curve is a Poisson curve with rate = median count rate of data. |
 |
 |
| Quadrant-wise count rates Data is divided into 100 sec bins |
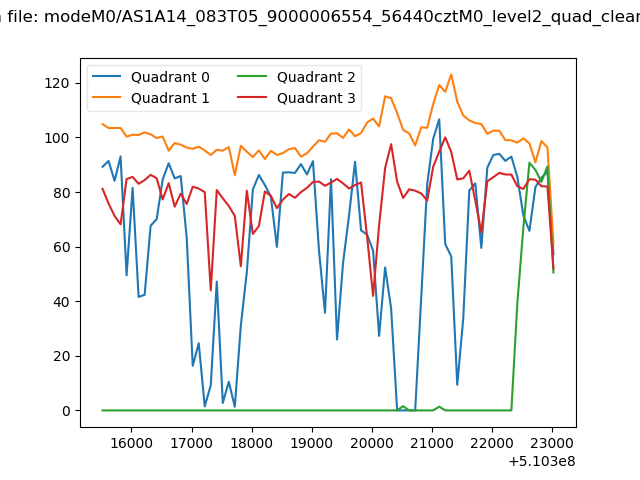 |
|
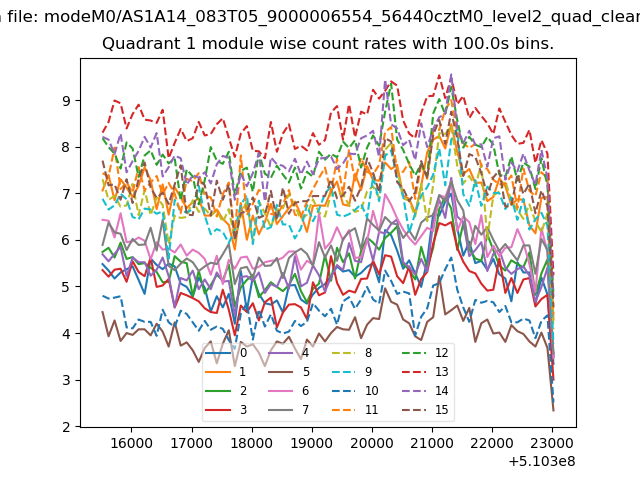
| Module-wise count rates for Quadrant A Data is divided into 100 sec bins |
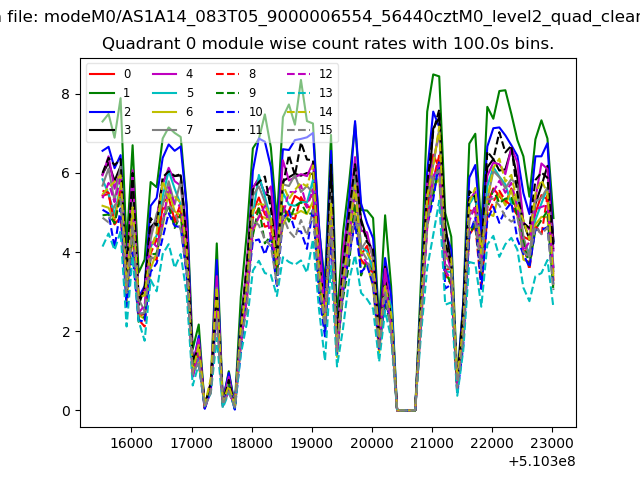 |
 |
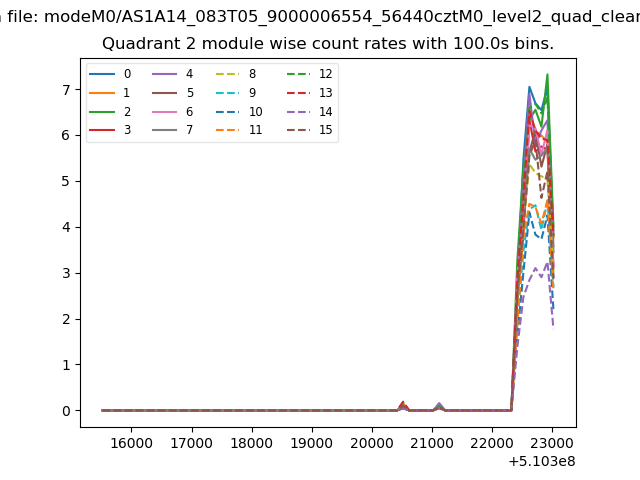
| Module-wise count rates for Quadrant B Data is divided into 100 sec bins |
 |
 |
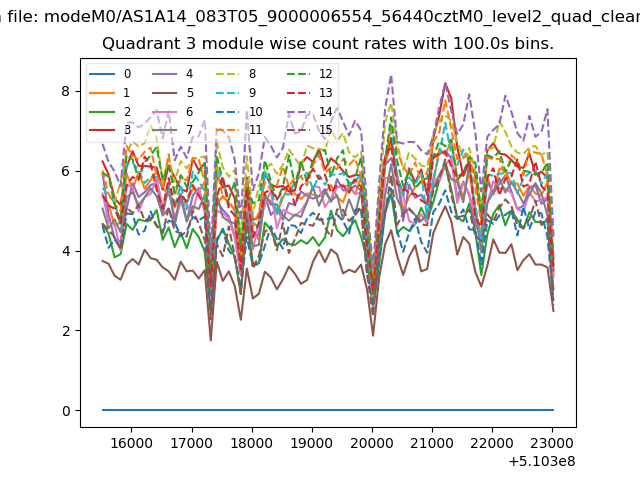
| Module-wise count rates for Quadrant C Data is divided into 100 sec bins |
 |
 |
| Module-wise count rates for Quadrant D Data is divided into 100 sec bins |
 |
 |
| Parameter | Plot |
|---|---|
| CZT HV Monitor |  |
| D_VDD | 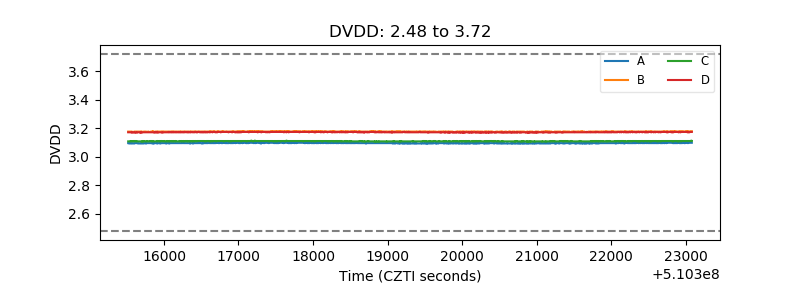 |
| Temperature 1 | 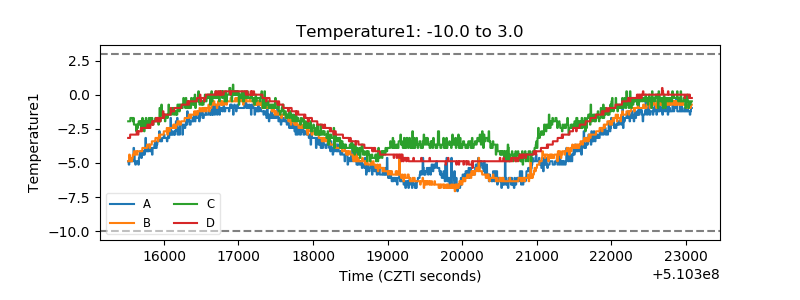 |
| Veto HV Monitor | 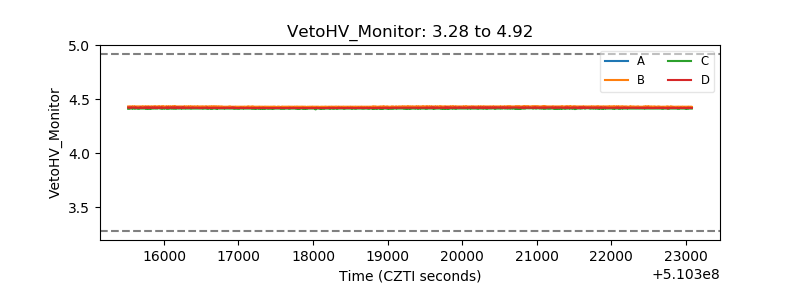 |
| Veto LLD | 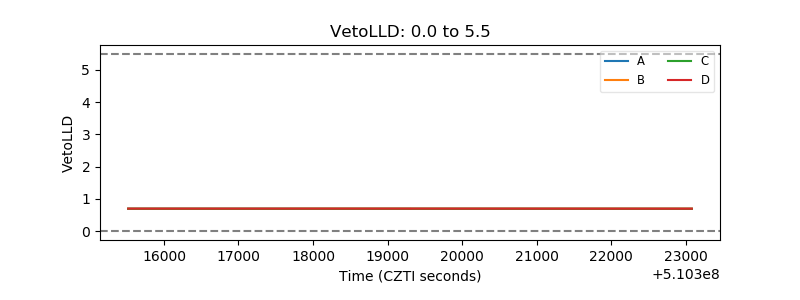 |
| Alpha Counter |  |
| _CPM_Rate |  |
| CZT Counter | 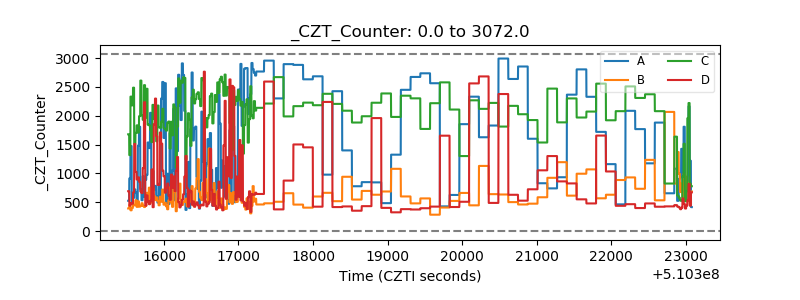 |
| +2.5 Volts monitor | 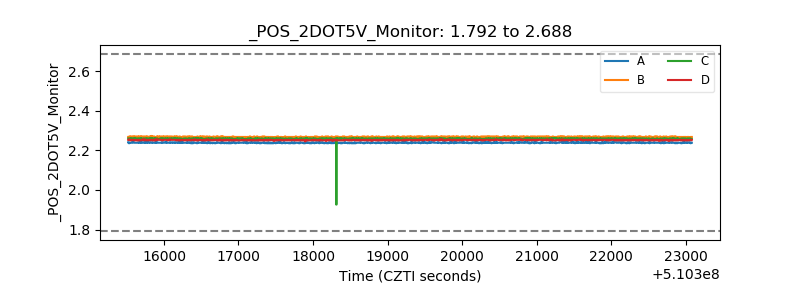 |
| +5 Volts monitor |  |
| _ROLL_ROT | 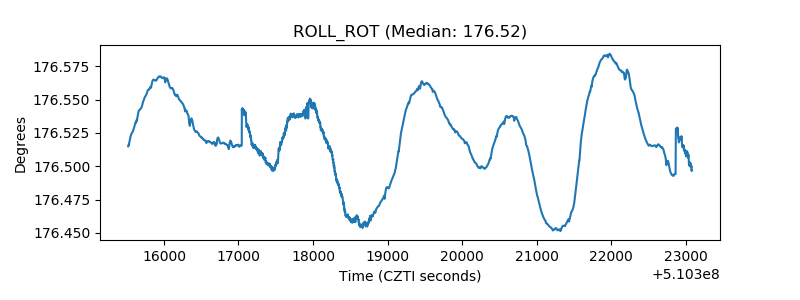 |
| _Roll_DEC | 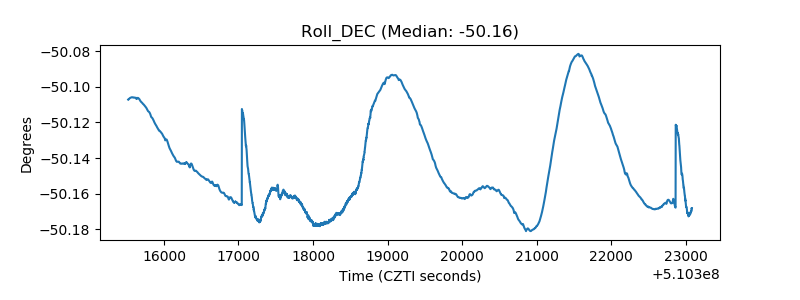 |
| _Roll_RA |  |
| Veto Counter | 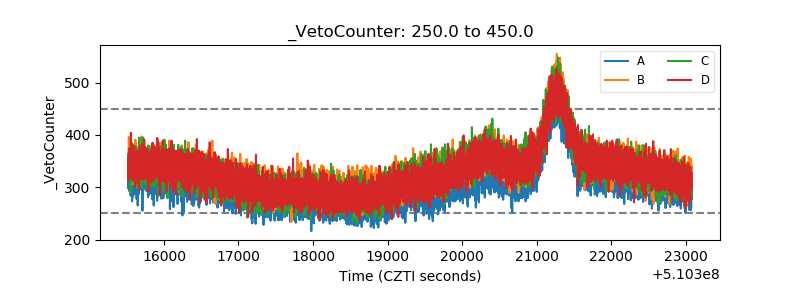 |