| Param | Original file | Final file |
|---|---|---|
| Filename | modeM0/AS1A14_083T05_9000006554_56443cztM0_level2.fits | modeM0/AS1A14_083T05_9000006554_56443cztM0_level2_quad_clean.evt |
| Size (bytes) | 1,676,229,120 | 242,841,600 |
| Size | 1.6 GB | 231.6 MB |
| Events in quadrant A | 20,613,729 | 1,399,371 |
| Events in quadrant B | 13,489,704 | 1,761,961 |
| Events in quadrant C | 13,776,398 | 1,451,067 |
| Events in quadrant D | 12,766,088 | 1,485,645 |
| Mode M9 | |||
|---|---|---|---|
| Quadrant | BADHDUFLAG | Total packets | Discarded packets |
| A | 0 | 15 | 0 |
| B | 0 | 15 | 0 |
| C | 0 | 15 | 0 |
| D | 0 | 15 | 0 |
| Mode SS | |||
|---|---|---|---|
| Quadrant | BADHDUFLAG | Total packets | Discarded packets |
| A | 0 | 370 | 0 |
| B | 0 | 370 | 0 |
| C | 0 | 370 | 0 |
| D | 0 | 370 | 0 |
| Mode M0 | |||
|---|---|---|---|
| Quadrant | BADHDUFLAG | Total packets | Discarded packets |
| A | 0 | 74017 | 3 |
| B | 0 | 52603 | 6 |
| C | 0 | 53887 | 3 |
| D | 0 | 50689 | 3 |
| Quadrant | Total seconds | Saturated seconds | Saturation percentage |
|---|---|---|---|
| A | 18189 | 3257 | 17.906427% |
| B | 18188 | 803 | 4.414999% |
| C | 18188 | 1775 | 9.759182% |
| D | 18188 | 578 | 3.177920% |
Noise dominated data is calculated using 1-second bins in cleaned event files. If a bin has >2000 counts, and if more than 50% of those come from <1% of pixels, then it is considered to be noise-dominated and hence unusable.
| Quadrant | # 1 sec bins | Bins with >0 counts | Bins with >2000 counts | High rate bins dominated by noise | Noise dominated (total time) | Noise dominated (detector-on time) | Marked lightcurve |
|---|---|---|---|---|---|---|---|
| A | 19710 | 18189 | 2612 | 2612 | 13.25% | 14.36% |  |
| B | 19708 | 18187 | 508 | 508 | 2.58% | 2.79% |  |
| C | 19709 | 18190 | 1601 | 1601 | 8.12% | 8.80% | 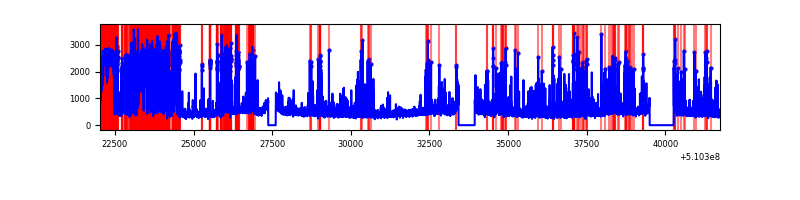 |
| D | 19709 | 18189 | 530 | 530 | 2.69% | 2.91% |  |
Top three noisy pixels from each quadrant. If the there are fewer than three noisy pixels in the level2.evt file, extra rows are filled as -1
| Pixel properties | Quadrant properties | ||||||
|---|---|---|---|---|---|---|---|
| Quadrant | DetID | PixID | Counts | Sigma | Mean | Median | Sigma |
| A | 3 | 14 | 3502195 | 7691.99 | 1828 | 1781 | 455.1 |
| A | 4 | 159 | 3454615 | 7587.44 | 1828 | 1781 | 455.1 |
| A | 12 | 3 | 2467342 | 5417.95 | 1828 | 1781 | 455.1 |
| B | 4 | 21 | 2648272 | 6567.48 | 1901 | 1834 | 403.0 |
| B | 4 | 206 | 1398914 | 3467.04 | 1901 | 1834 | 403.0 |
| B | 5 | 172 | 604827 | 1496.41 | 1901 | 1834 | 403.0 |
| C | 12 | 254 | 3795078 | 7748.73 | 1781 | 1766 | 489.5 |
| C | 1 | 16 | 1217796 | 2484.03 | 1781 | 1766 | 489.5 |
| C | 15 | 209 | 677023 | 1379.37 | 1781 | 1766 | 489.5 |
| D | 12 | 3 | 1413004 | 2679.92 | 1846 | 1762 | 526.6 |
| D | 2 | 249 | 766621 | 1452.45 | 1846 | 1762 | 526.6 |
| D | 5 | 113 | 678917 | 1285.9 | 1846 | 1762 | 526.6 |
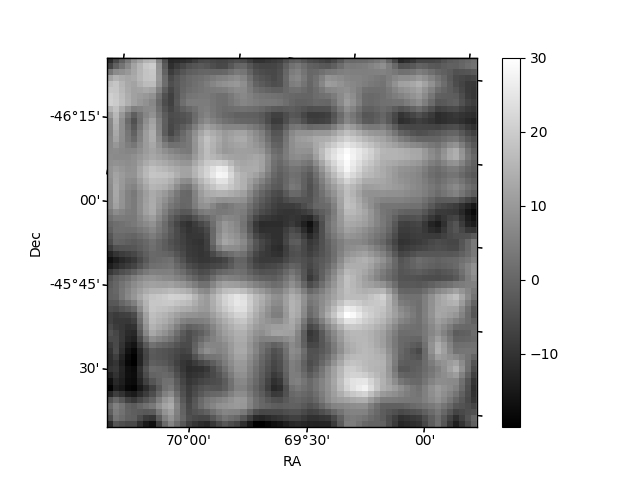
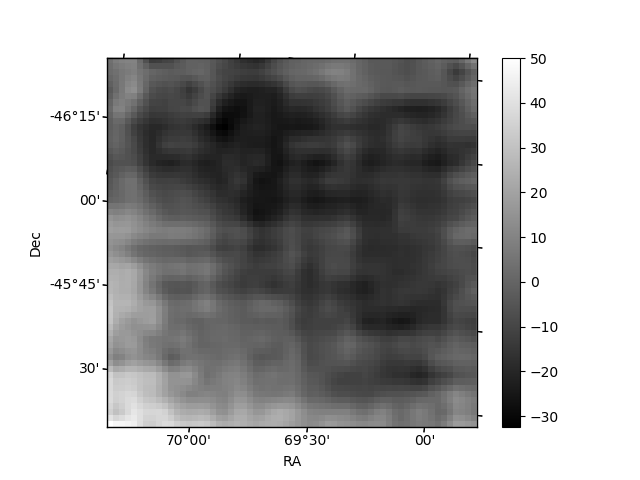
Histogram calculated using DETX and DETY for each event in the final _common_clean file
| Quadrant A | 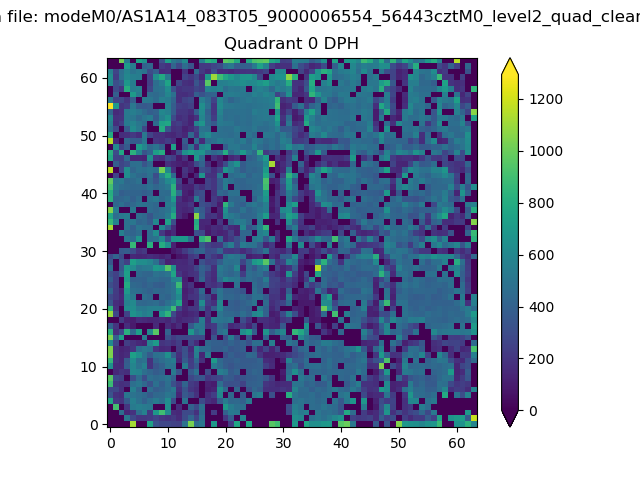 |
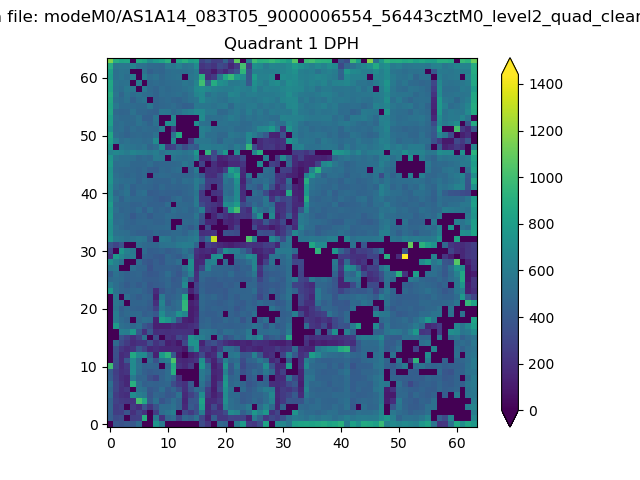 |
Quadrant B |
|---|---|---|---|
| Quadrant D |  |
 |
Quadrant C |
| Plot type | Count rate plots | Images |
|---|---|---|
| Comparison with Poisson distribution Blue bars denote a histogram of data divided into 1 sec bins. Red curve is a Poisson curve with rate = median count rate of data. |
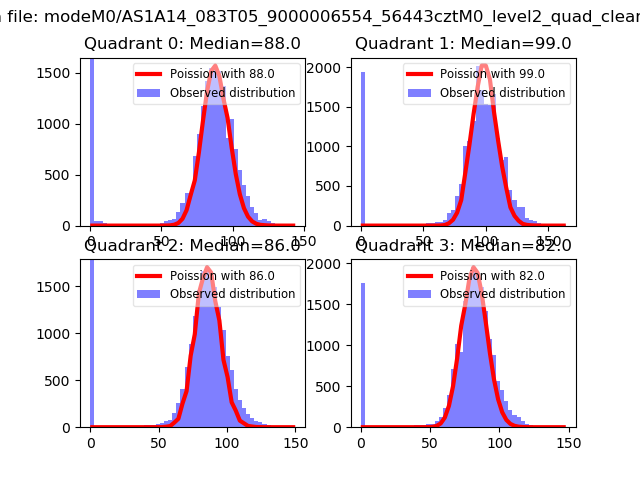 |
 |
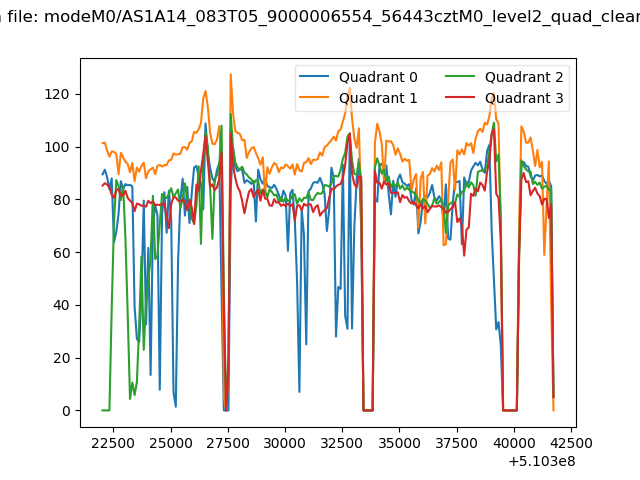
| Quadrant-wise count rates Data is divided into 100 sec bins |
 |
|
| Module-wise count rates for Quadrant A Data is divided into 100 sec bins |
 |
 |
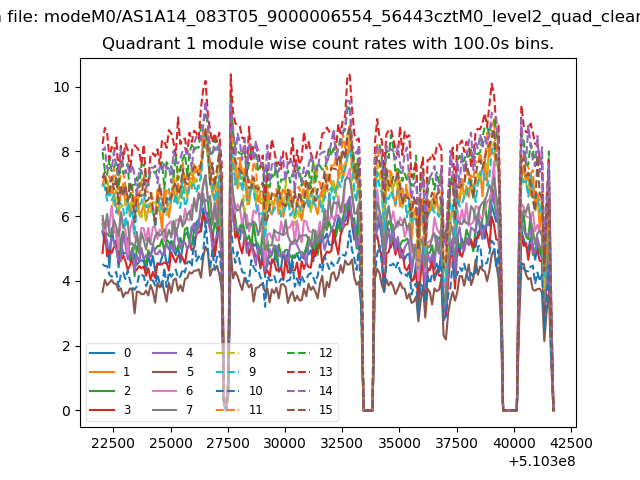
| Module-wise count rates for Quadrant B Data is divided into 100 sec bins |
 |
 |
| Module-wise count rates for Quadrant C Data is divided into 100 sec bins |
 |
 |
| Module-wise count rates for Quadrant D Data is divided into 100 sec bins |
 |
 |
| Parameter | Plot |
|---|---|
| CZT HV Monitor |  |
| D_VDD |  |
| Temperature 1 |  |
| Veto HV Monitor | 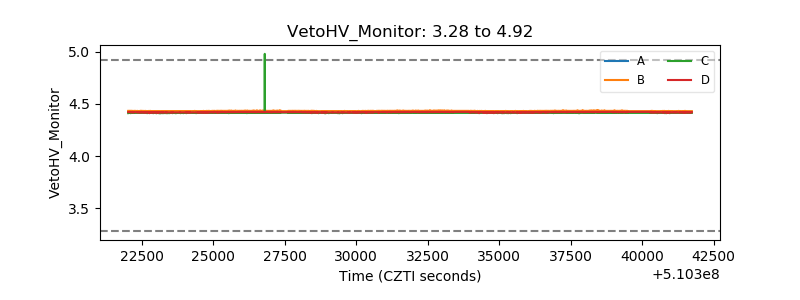 |
| Veto LLD | 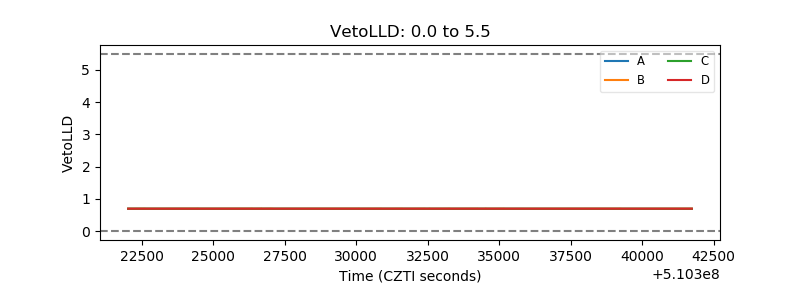 |
| Alpha Counter | 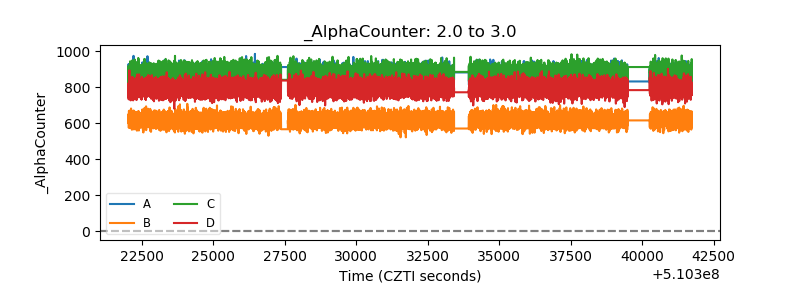 |
| _CPM_Rate | 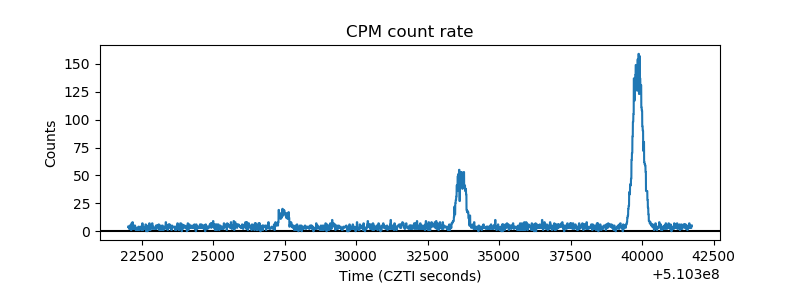 |
| CZT Counter |  |
| +2.5 Volts monitor |  |
| +5 Volts monitor |  |
| _ROLL_ROT | 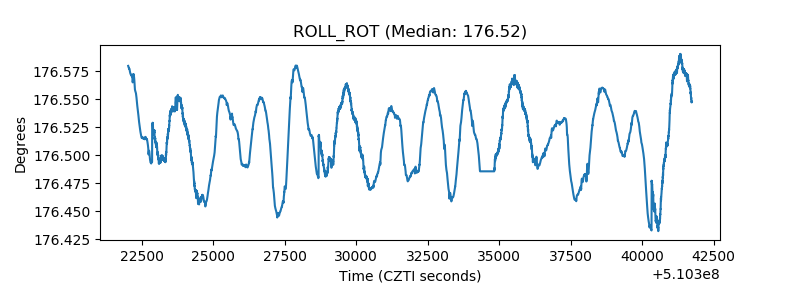 |
| _Roll_DEC | 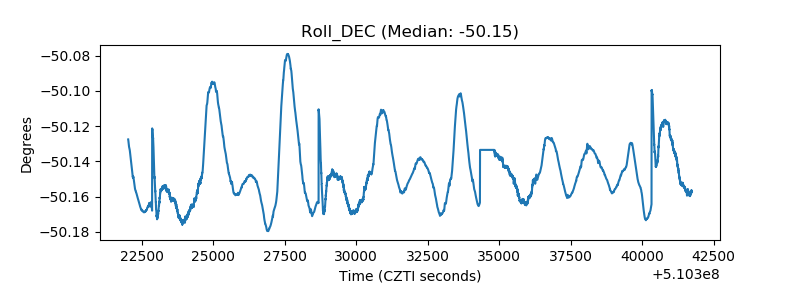 |
| _Roll_RA |  |
| Veto Counter | 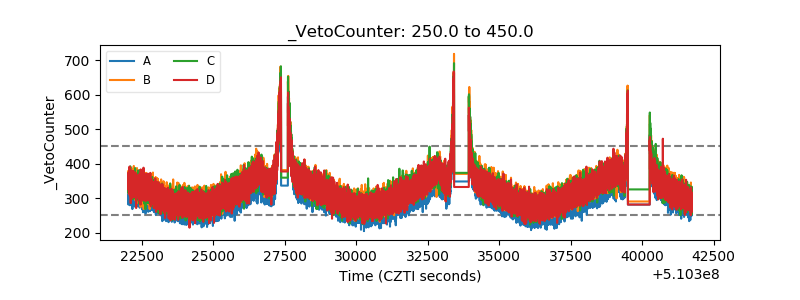 |