| Param | Original file | Final file |
|---|---|---|
| Filename | modeM0/AS1A14_083T05_9000006554_56444cztM0_level2.fits | modeM0/AS1A14_083T05_9000006554_56444cztM0_level2_quad_clean.evt |
| Size (bytes) | 678,291,840 | 90,144,000 |
| Size | 646.9 MB | 86.0 MB |
| Events in quadrant A | 8,987,211 | 501,752 |
| Events in quadrant B | 5,968,598 | 598,958 |
| Events in quadrant C | 3,766,818 | 604,156 |
| Events in quadrant D | 5,857,574 | 549,449 |
| Mode M9 | |||
|---|---|---|---|
| Quadrant | BADHDUFLAG | Total packets | Discarded packets |
| A | 0 | 12 | 0 |
| B | 0 | 12 | 0 |
| C | 0 | 13 | 0 |
| D | 0 | 13 | 0 |
| Mode SS | |||
|---|---|---|---|
| Quadrant | BADHDUFLAG | Total packets | Discarded packets |
| A | 0 | 138 | 0 |
| B | 0 | 138 | 0 |
| C | 0 | 138 | 0 |
| D | 0 | 138 | 0 |
| Mode M0 | |||
|---|---|---|---|
| Quadrant | BADHDUFLAG | Total packets | Discarded packets |
| A | 0 | 31473 | 2 |
| B | 0 | 22462 | 2 |
| C | 0 | 16325 | 2 |
| D | 0 | 22275 | 2 |
| Quadrant | Total seconds | Saturated seconds | Saturation percentage |
|---|---|---|---|
| A | 6816 | 1735 | 25.454812% |
| B | 6816 | 1056 | 15.492958% |
| C | 6816 | 145 | 2.127347% |
| D | 6816 | 417 | 6.117958% |
Noise dominated data is calculated using 1-second bins in cleaned event files. If a bin has >2000 counts, and if more than 50% of those come from <1% of pixels, then it is considered to be noise-dominated and hence unusable.
| Quadrant | # 1 sec bins | Bins with >0 counts | Bins with >2000 counts | High rate bins dominated by noise | Noise dominated (total time) | Noise dominated (detector-on time) | Marked lightcurve |
|---|---|---|---|---|---|---|---|
| A | 7721 | 6816 | 1659 | 1659 | 21.49% | 24.34% |  |
| B | 7721 | 6816 | 914 | 914 | 11.84% | 13.41% |  |
| C | 7721 | 6817 | 134 | 134 | 1.74% | 1.97% | 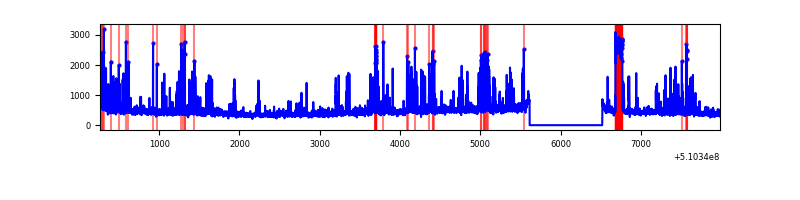 |
| D | 7721 | 6817 | 397 | 397 | 5.14% | 5.82% |  |
Top three noisy pixels from each quadrant. If the there are fewer than three noisy pixels in the level2.evt file, extra rows are filled as -1
| Pixel properties | Quadrant properties | ||||||
|---|---|---|---|---|---|---|---|
| Quadrant | DetID | PixID | Counts | Sigma | Mean | Median | Sigma |
| A | 4 | 95 | 2450616 | 14826.04 | 660 | 641 | 165.2 |
| A | 3 | 14 | 2043723 | 12363.72 | 660 | 641 | 165.2 |
| A | 12 | 3 | 896612 | 5421.97 | 660 | 641 | 165.2 |
| B | 5 | 172 | 2324634 | 16311.78 | 657 | 634 | 142.5 |
| B | 1 | 159 | 340196 | 2383.33 | 657 | 634 | 142.5 |
| B | 4 | 206 | 312490 | 2188.87 | 657 | 634 | 142.5 |
| C | 1 | 16 | 470425 | 2490.78 | 688 | 683 | 188.6 |
| C | 6 | 223 | 131881 | 695.67 | 688 | 683 | 188.6 |
| C | 1 | 29 | 107226 | 564.94 | 688 | 683 | 188.6 |
| D | 5 | 113 | 992112 | 5107.35 | 671 | 639 | 194.1 |
| D | 12 | 3 | 865931 | 4457.36 | 671 | 639 | 194.1 |
| D | 2 | 249 | 374900 | 1927.92 | 671 | 639 | 194.1 |
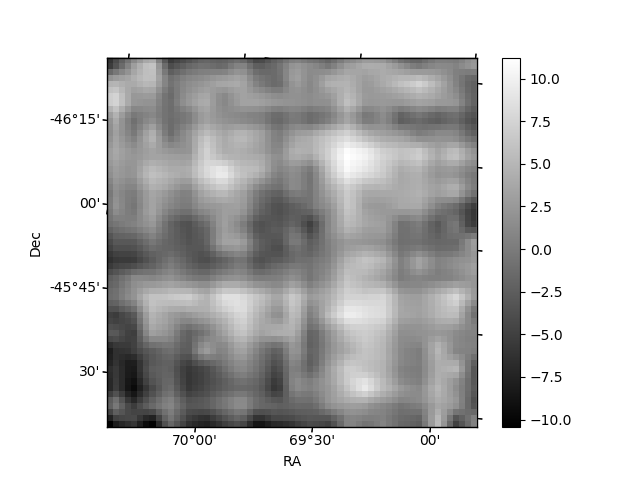
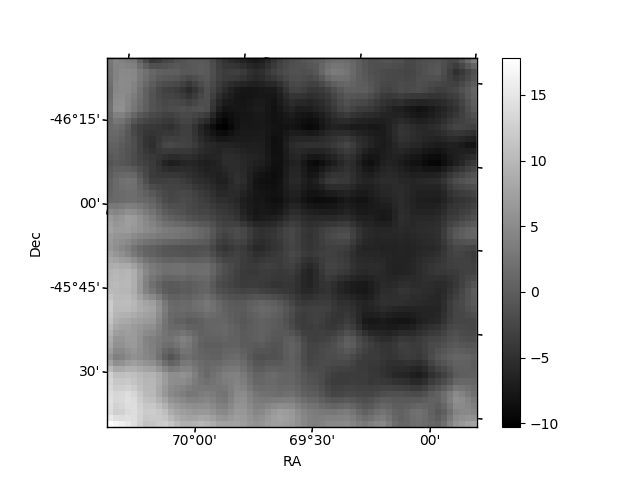
Histogram calculated using DETX and DETY for each event in the final _common_clean file
| Quadrant A | 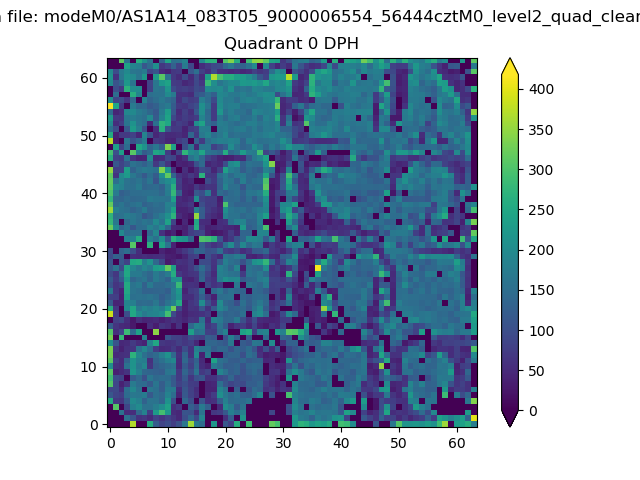 |
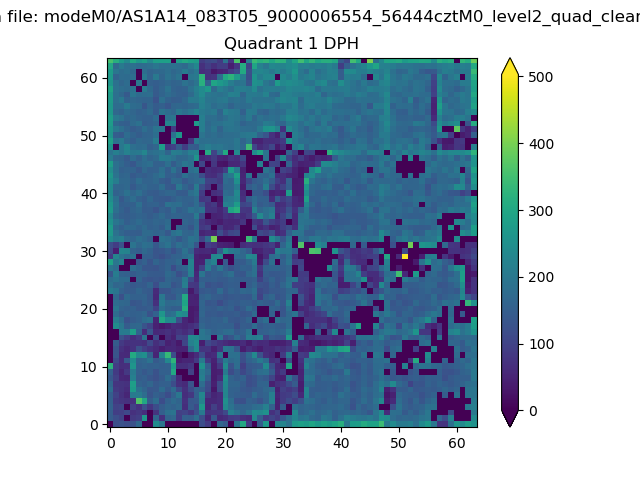 |
Quadrant B |
|---|---|---|---|
| Quadrant D |  |
 |
Quadrant C |
| Plot type | Count rate plots | Images |
|---|---|---|
| Comparison with Poisson distribution Blue bars denote a histogram of data divided into 1 sec bins. Red curve is a Poisson curve with rate = median count rate of data. |
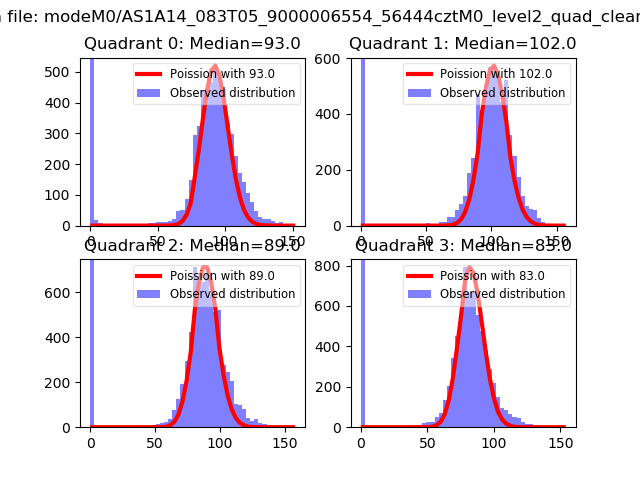 |
 |
| Quadrant-wise count rates Data is divided into 100 sec bins |
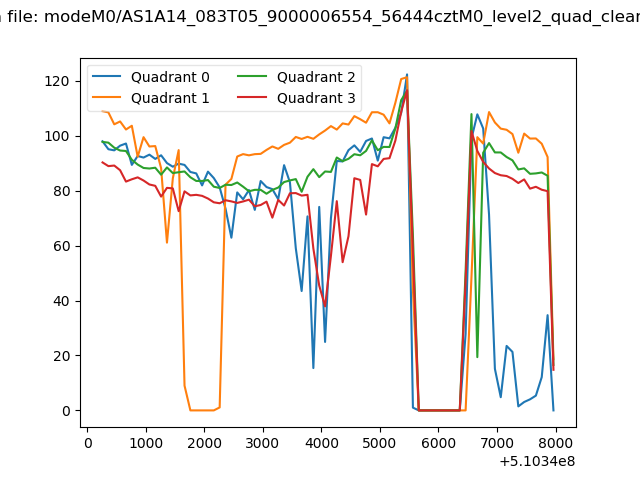 |
|
| Module-wise count rates for Quadrant A Data is divided into 100 sec bins |
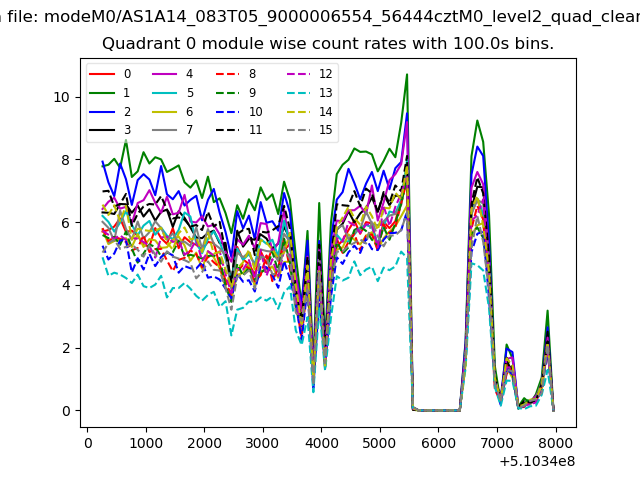 |
 |
| Module-wise count rates for Quadrant B Data is divided into 100 sec bins |
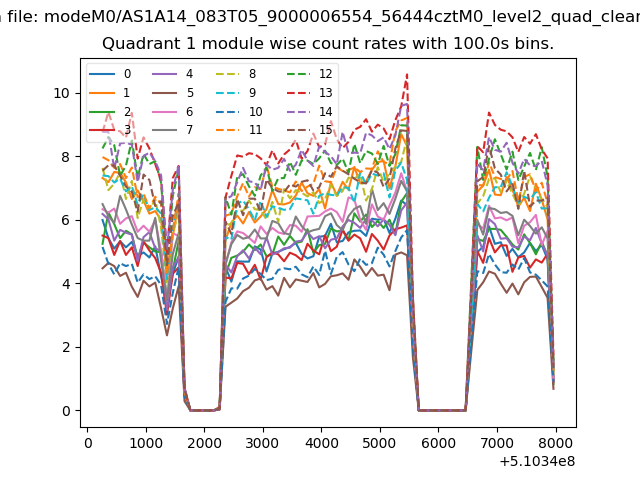 |
 |
| Module-wise count rates for Quadrant C Data is divided into 100 sec bins |
 |
 |
| Module-wise count rates for Quadrant D Data is divided into 100 sec bins |
 |
 |
| Parameter | Plot |
|---|---|
| CZT HV Monitor |  |
| D_VDD |  |
| Temperature 1 |  |
| Veto HV Monitor | 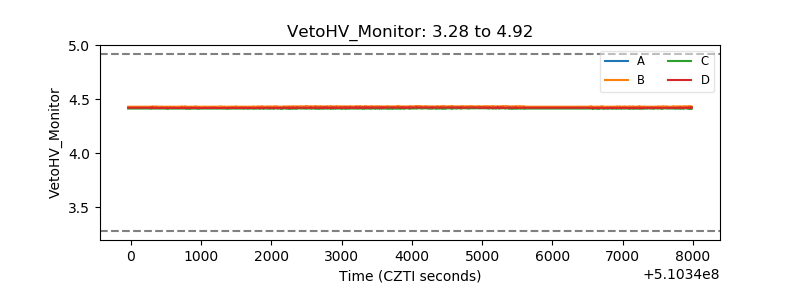 |
| Veto LLD | 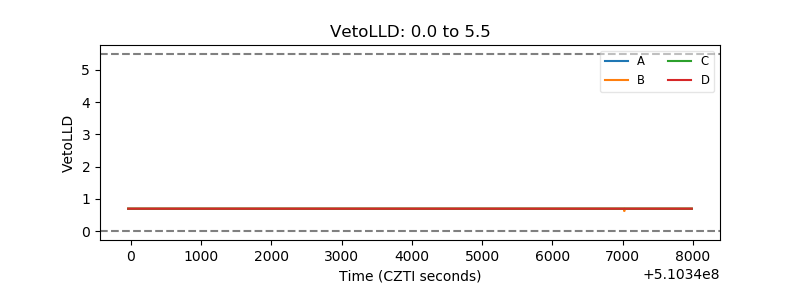 |
| Alpha Counter |  |
| _CPM_Rate | 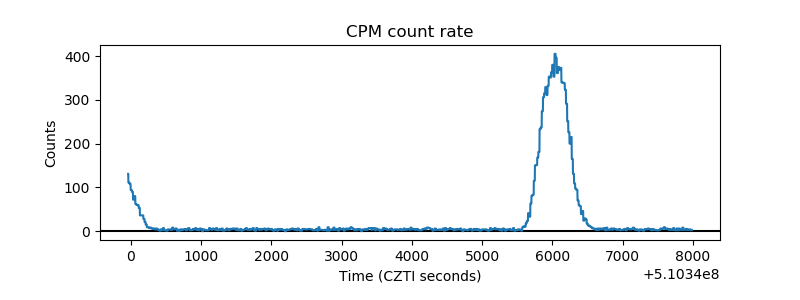 |
| CZT Counter | 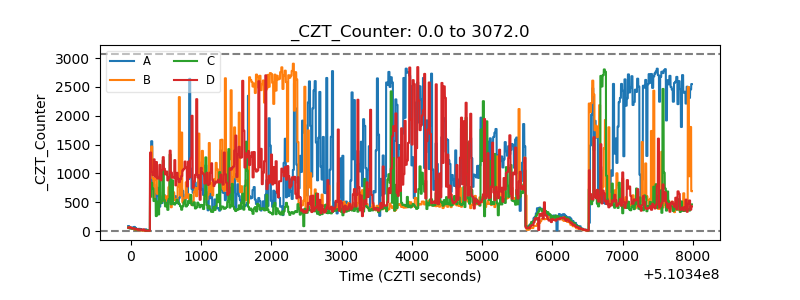 |
| +2.5 Volts monitor |  |
| +5 Volts monitor |  |
| _ROLL_ROT | 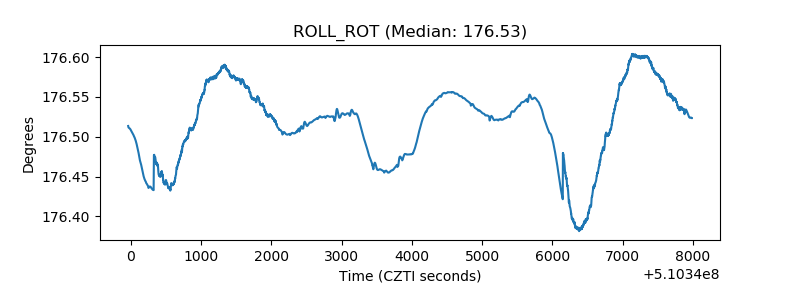 |
| _Roll_DEC | 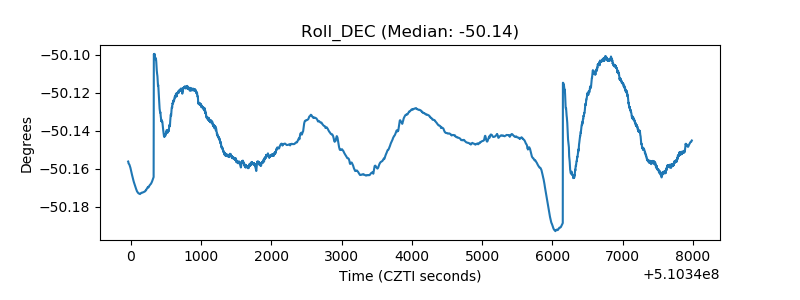 |
| _Roll_RA |  |
| Veto Counter | 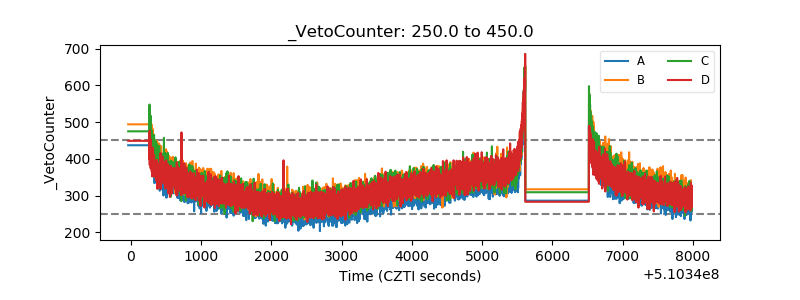 |