| Param | Original file | Final file |
|---|---|---|
| Filename | modeM0/AS1A14_083T05_9000006554_56446cztM0_level2.fits | modeM0/AS1A14_083T05_9000006554_56446cztM0_level2_quad_clean.evt |
| Size (bytes) | 608,950,080 | 84,450,240 |
| Size | 580.7 MB | 80.5 MB |
| Events in quadrant A | 10,402,179 | 400,507 |
| Events in quadrant B | 4,043,555 | 620,941 |
| Events in quadrant C | 3,328,178 | 566,351 |
| Events in quadrant D | 4,274,365 | 525,885 |
| Mode M9 | |||
|---|---|---|---|
| Quadrant | BADHDUFLAG | Total packets | Discarded packets |
| A | 0 | 11 | 0 |
| B | 0 | 11 | 0 |
| C | 0 | 11 | 0 |
| D | 0 | 11 | 0 |
| Mode SS | |||
|---|---|---|---|
| Quadrant | BADHDUFLAG | Total packets | Discarded packets |
| A | 0 | 128 | 0 |
| B | 0 | 128 | 0 |
| C | 0 | 128 | 0 |
| D | 0 | 128 | 0 |
| Mode M0 | |||
|---|---|---|---|
| Quadrant | BADHDUFLAG | Total packets | Discarded packets |
| A | 0 | 35291 | 1 |
| B | 0 | 16617 | 1 |
| C | 0 | 14696 | 1 |
| D | 0 | 17219 | 1 |
| Quadrant | Total seconds | Saturated seconds | Saturation percentage |
|---|---|---|---|
| A | 6353 | 2448 | 38.532977% |
| B | 6353 | 386 | 6.075870% |
| C | 6352 | 127 | 1.999370% |
| D | 6353 | 206 | 3.242563% |
Noise dominated data is calculated using 1-second bins in cleaned event files. If a bin has >2000 counts, and if more than 50% of those come from <1% of pixels, then it is considered to be noise-dominated and hence unusable.
| Quadrant | # 1 sec bins | Bins with >0 counts | Bins with >2000 counts | High rate bins dominated by noise | Noise dominated (total time) | Noise dominated (detector-on time) | Marked lightcurve |
|---|---|---|---|---|---|---|---|
| A | 7393 | 6353 | 2551 | 2551 | 34.51% | 40.15% |  |
| B | 7393 | 6354 | 182 | 182 | 2.46% | 2.86% |  |
| C | 7392 | 6353 | 121 | 121 | 1.64% | 1.90% | 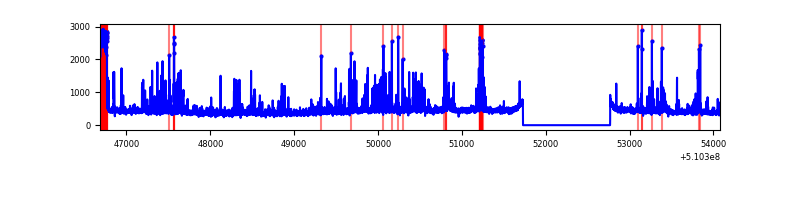 |
| D | 7393 | 6354 | 216 | 216 | 2.92% | 3.40% |  |
Top three noisy pixels from each quadrant. If the there are fewer than three noisy pixels in the level2.evt file, extra rows are filled as -1
| Pixel properties | Quadrant properties | ||||||
|---|---|---|---|---|---|---|---|
| Quadrant | DetID | PixID | Counts | Sigma | Mean | Median | Sigma |
| A | 4 | 95 | 4247528 | 29031.1 | 582 | 567 | 146.3 |
| A | 3 | 14 | 2486259 | 16991.53 | 582 | 567 | 146.3 |
| A | 12 | 3 | 984761 | 6727.69 | 582 | 567 | 146.3 |
| B | 4 | 206 | 924788 | 6552.18 | 653 | 630 | 141.0 |
| B | 0 | 231 | 151374 | 1068.76 | 653 | 630 | 141.0 |
| B | 5 | 172 | 107523 | 757.86 | 653 | 630 | 141.0 |
| C | 1 | 16 | 263994 | 1501.54 | 638 | 633 | 175.4 |
| C | 6 | 223 | 189855 | 1078.84 | 638 | 633 | 175.4 |
| C | 1 | 29 | 102982 | 583.54 | 638 | 633 | 175.4 |
| D | 12 | 3 | 506676 | 2814.46 | 630 | 604 | 179.8 |
| D | 5 | 113 | 392857 | 2181.47 | 630 | 604 | 179.8 |
| D | 8 | 240 | 288417 | 1600.64 | 630 | 604 | 179.8 |
Histogram calculated using DETX and DETY for each event in the final _common_clean file
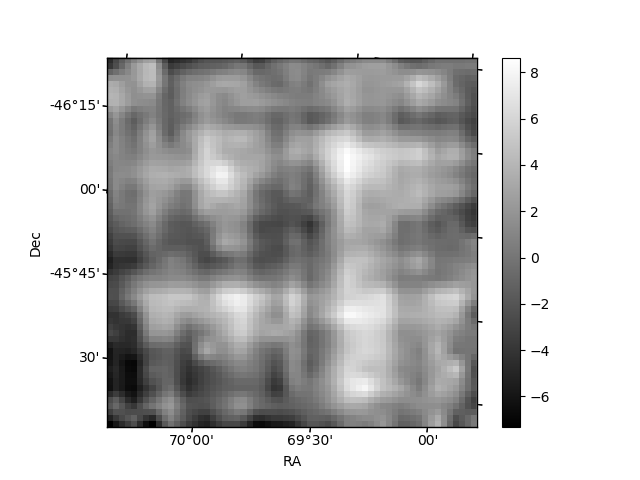
| Quadrant A |  |
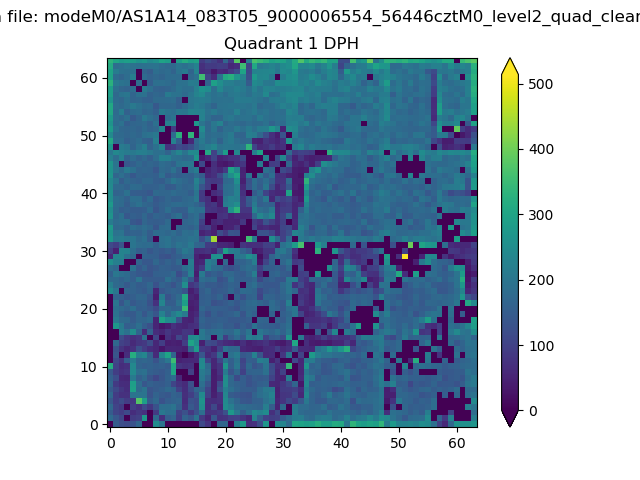 |
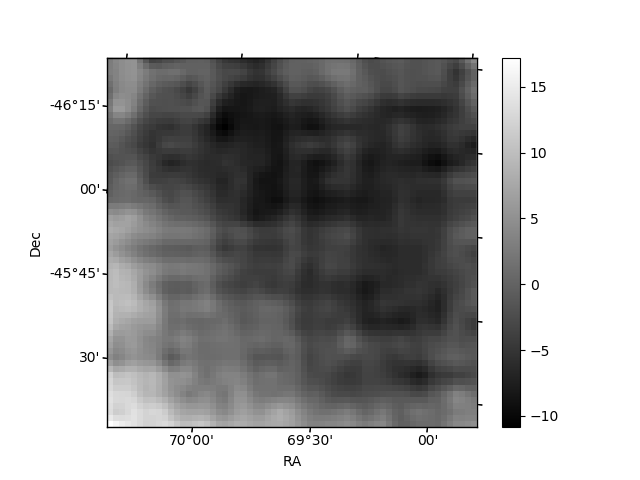
Quadrant B |
|---|---|---|---|
| Quadrant D |  |
 |
Quadrant C |
| Plot type | Count rate plots | Images |
|---|---|---|
| Comparison with Poisson distribution Blue bars denote a histogram of data divided into 1 sec bins. Red curve is a Poisson curve with rate = median count rate of data. |
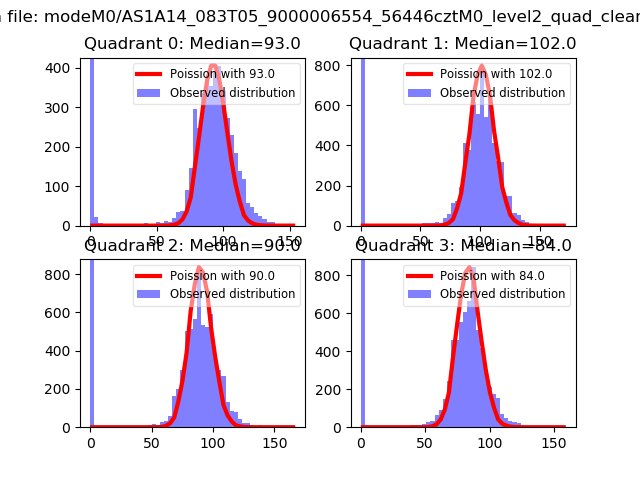 |
 |
| Quadrant-wise count rates Data is divided into 100 sec bins |
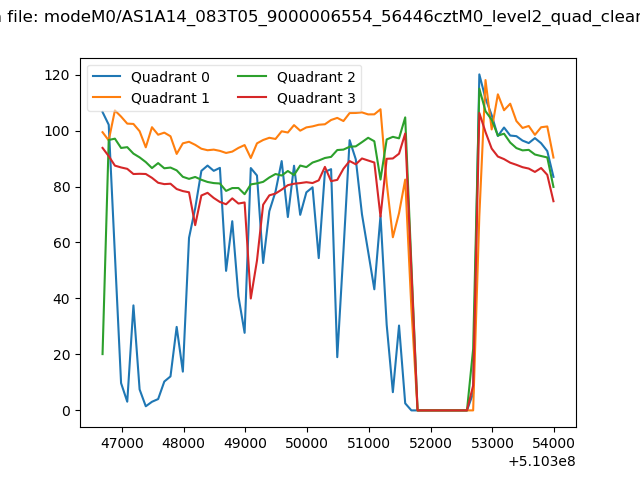 |
|
| Module-wise count rates for Quadrant A Data is divided into 100 sec bins |
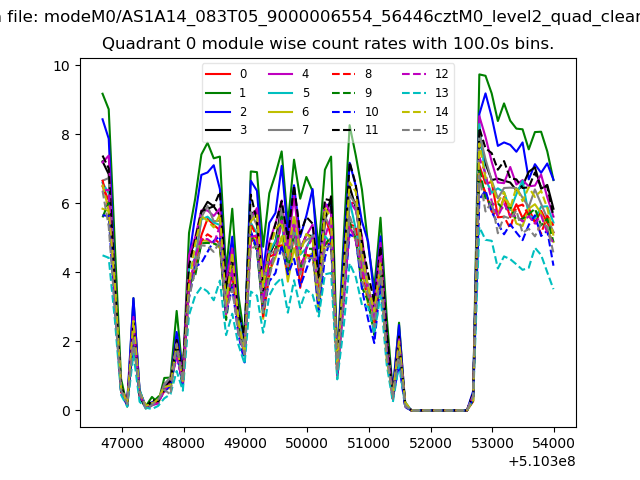 |
 |
| Module-wise count rates for Quadrant B Data is divided into 100 sec bins |
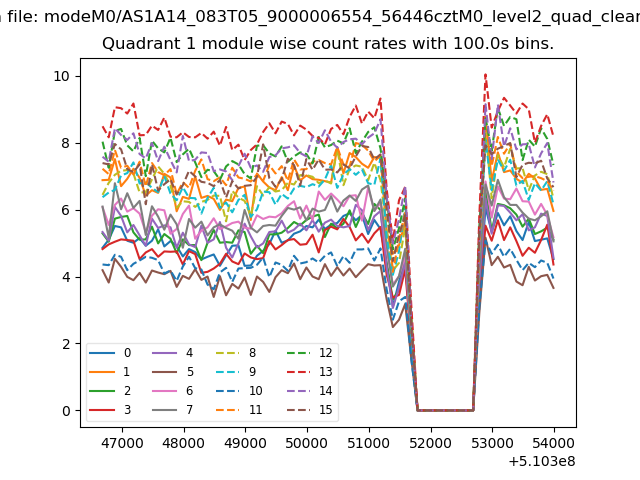 |
 |
| Module-wise count rates for Quadrant C Data is divided into 100 sec bins |
 |
 |
| Module-wise count rates for Quadrant D Data is divided into 100 sec bins |
 |
 |
| Parameter | Plot |
|---|---|
| CZT HV Monitor |  |
| D_VDD |  |
| Temperature 1 | 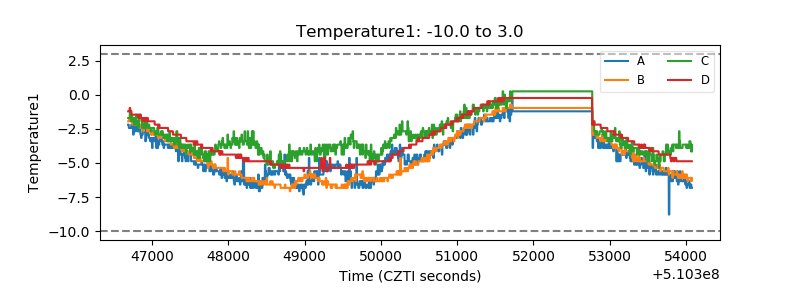 |
| Veto HV Monitor | 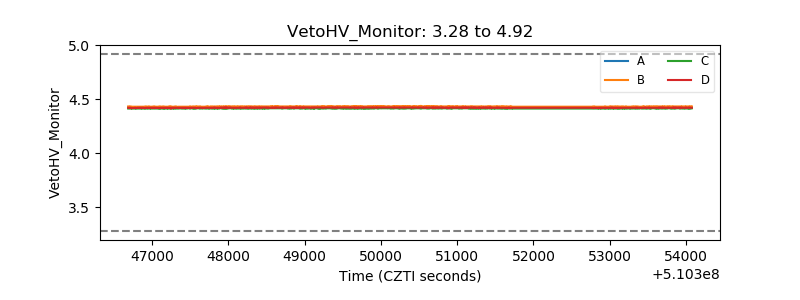 |
| Veto LLD | 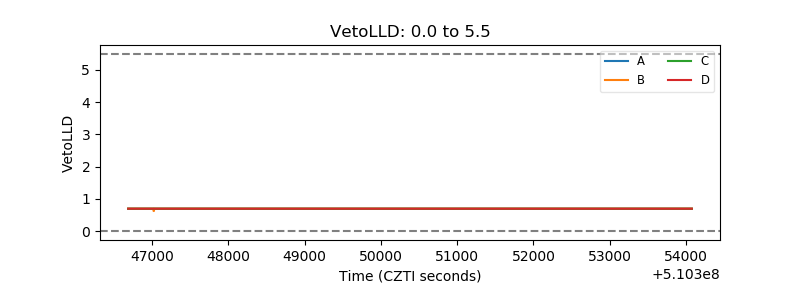 |
| Alpha Counter |  |
| _CPM_Rate | 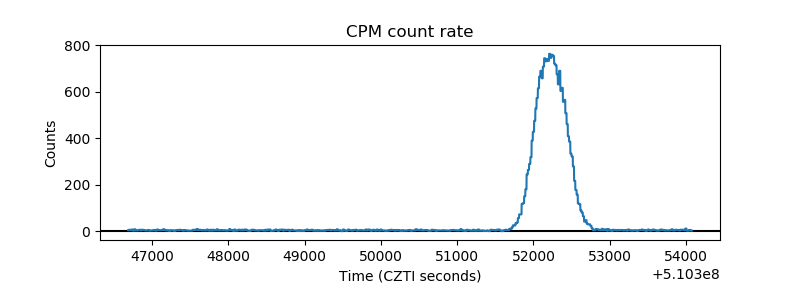 |
| CZT Counter | 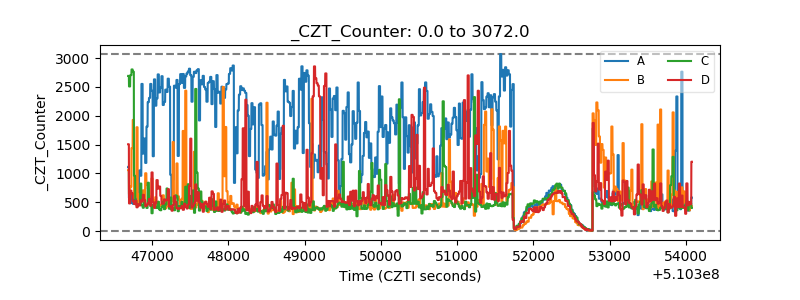 |
| +2.5 Volts monitor |  |
| +5 Volts monitor |  |
| _ROLL_ROT | 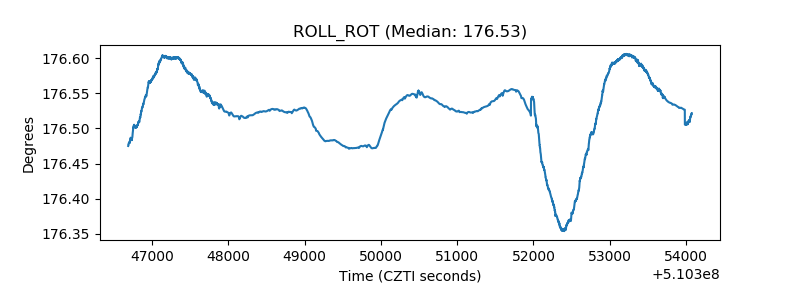 |
| _Roll_DEC | 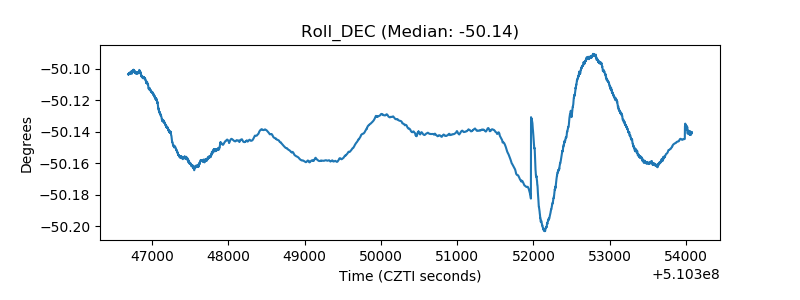 |
| _Roll_RA |  |
| Veto Counter | 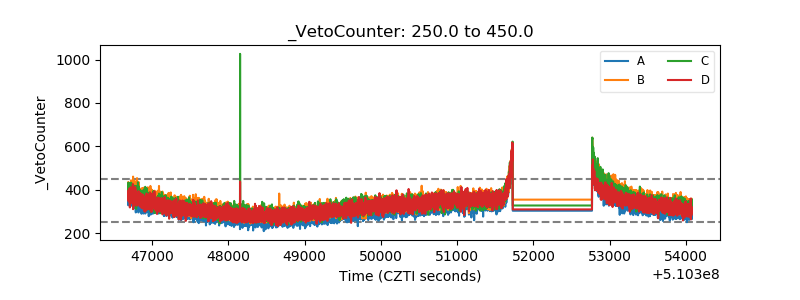 |