| Param | Original file | Final file |
|---|---|---|
| Filename | modeM0/AS1A14_083T05_9000006554_56447cztM0_level2.fits | modeM0/AS1A14_083T05_9000006554_56447cztM0_level2_quad_clean.evt |
| Size (bytes) | 573,886,080 | 88,067,520 |
| Size | 547.3 MB | 84.0 MB |
| Events in quadrant A | 4,164,355 | 608,058 |
| Events in quadrant B | 6,441,252 | 542,339 |
| Events in quadrant C | 3,250,830 | 600,823 |
| Events in quadrant D | 6,885,865 | 464,930 |
| Mode M9 | |||
|---|---|---|---|
| Quadrant | BADHDUFLAG | Total packets | Discarded packets |
| A | 0 | 13 | 0 |
| B | 0 | 13 | 0 |
| C | 0 | 14 | 0 |
| D | 0 | 14 | 0 |
| Mode SS | |||
|---|---|---|---|
| Quadrant | BADHDUFLAG | Total packets | Discarded packets |
| A | 0 | 130 | 0 |
| B | 0 | 130 | 0 |
| C | 0 | 130 | 0 |
| D | 0 | 130 | 0 |
| Mode M0 | |||
|---|---|---|---|
| Quadrant | BADHDUFLAG | Total packets | Discarded packets |
| A | 0 | 16846 | 2 |
| B | 0 | 23688 | 2 |
| C | 0 | 14422 | 2 |
| D | 0 | 24911 | 2 |
| Quadrant | Total seconds | Saturated seconds | Saturation percentage |
|---|---|---|---|
| A | 6458 | 298 | 4.614432% |
| B | 6458 | 1369 | 21.198513% |
| C | 6458 | 51 | 0.789718% |
| D | 6458 | 1197 | 18.535150% |
Noise dominated data is calculated using 1-second bins in cleaned event files. If a bin has >2000 counts, and if more than 50% of those come from <1% of pixels, then it is considered to be noise-dominated and hence unusable.
| Quadrant | # 1 sec bins | Bins with >0 counts | Bins with >2000 counts | High rate bins dominated by noise | Noise dominated (total time) | Noise dominated (detector-on time) | Marked lightcurve |
|---|---|---|---|---|---|---|---|
| A | 7573 | 6459 | 304 | 304 | 4.01% | 4.71% | 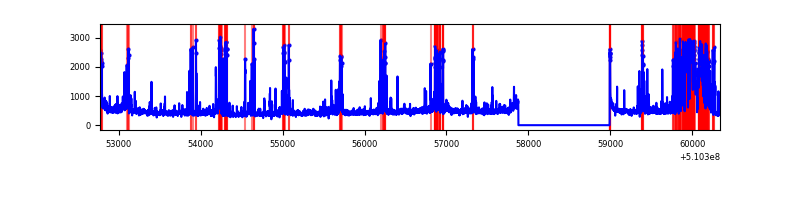 |
| B | 7572 | 6457 | 1150 | 1150 | 15.19% | 17.81% |  |
| C | 7573 | 6459 | 39 | 39 | 0.51% | 0.60% | 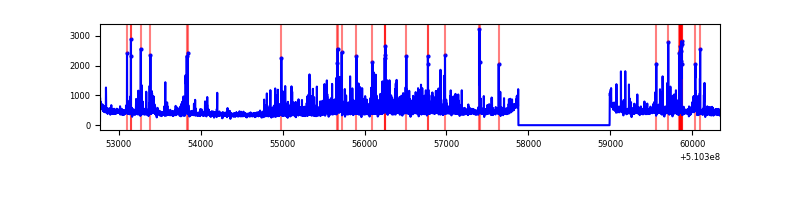 |
| D | 7572 | 6457 | 1262 | 1262 | 16.67% | 19.54% |  |
Top three noisy pixels from each quadrant. If the there are fewer than three noisy pixels in the level2.evt file, extra rows are filled as -1
| Pixel properties | Quadrant properties | ||||||
|---|---|---|---|---|---|---|---|
| Quadrant | DetID | PixID | Counts | Sigma | Mean | Median | Sigma |
| A | 12 | 3 | 613549 | 3635.26 | 681 | 665 | 168.6 |
| A | 4 | 95 | 271668 | 1607.43 | 681 | 665 | 168.6 |
| A | 3 | 14 | 191004 | 1128.98 | 681 | 665 | 168.6 |
| B | 5 | 172 | 2605316 | 20044.87 | 600 | 578 | 129.9 |
| B | 4 | 206 | 1109005 | 8529.95 | 600 | 578 | 129.9 |
| B | 5 | 236 | 157907 | 1210.73 | 600 | 578 | 129.9 |
| C | 1 | 16 | 336503 | 1820.07 | 670 | 663 | 184.5 |
| C | 6 | 223 | 111017 | 598.06 | 670 | 663 | 184.5 |
| C | 12 | 249 | 74408 | 399.66 | 670 | 663 | 184.5 |
| D | 5 | 113 | 2105345 | 12069.62 | 613 | 584 | 174.4 |
| D | 8 | 129 | 1108602 | 6353.86 | 613 | 584 | 174.4 |
| D | 12 | 3 | 719123 | 4120.42 | 613 | 584 | 174.4 |
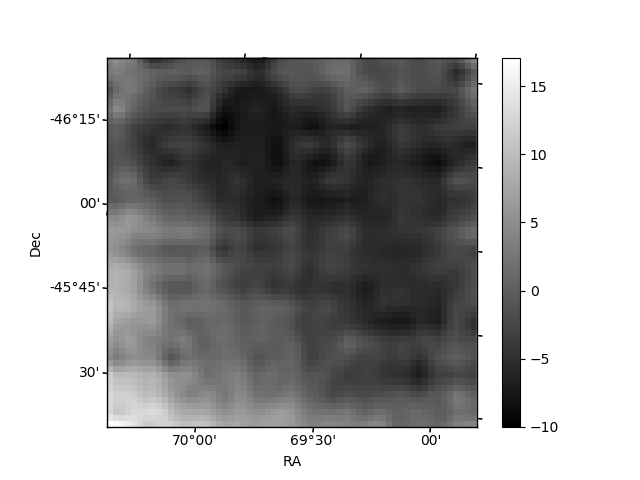
Histogram calculated using DETX and DETY for each event in the final _common_clean file
| Quadrant A | 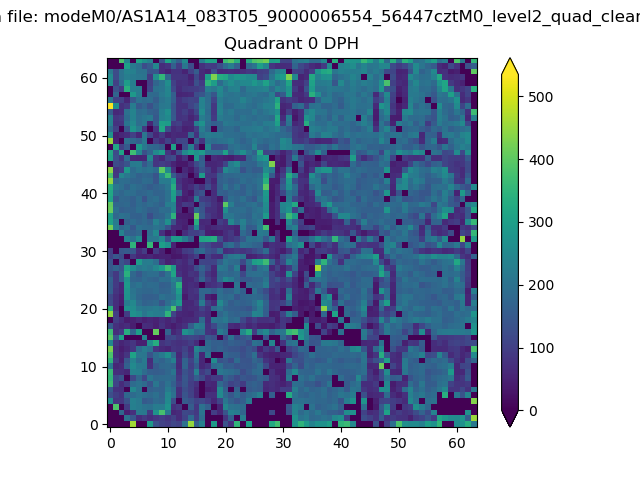 |
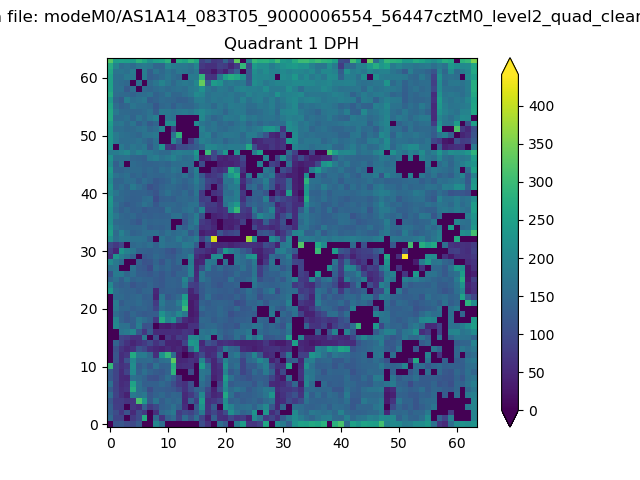 |
Quadrant B |
|---|---|---|---|
| Quadrant D |  |
 |
Quadrant C |
| Plot type | Count rate plots | Images |
|---|---|---|
| Comparison with Poisson distribution Blue bars denote a histogram of data divided into 1 sec bins. Red curve is a Poisson curve with rate = median count rate of data. |
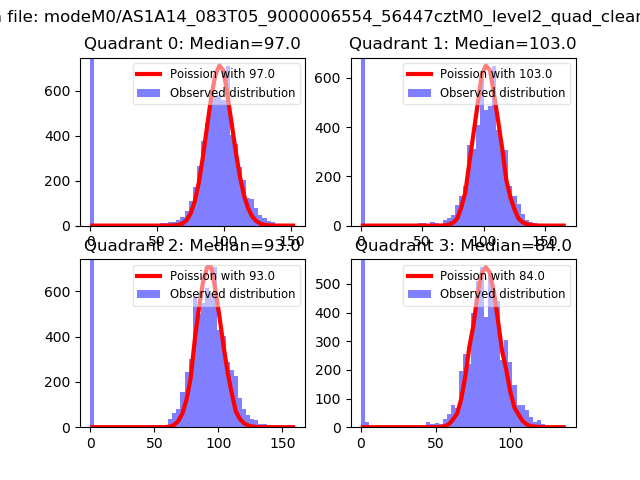 |
 |
| Quadrant-wise count rates Data is divided into 100 sec bins |
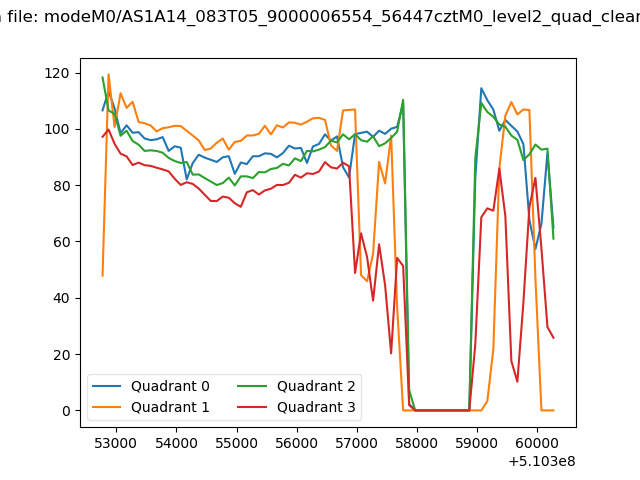 |
|
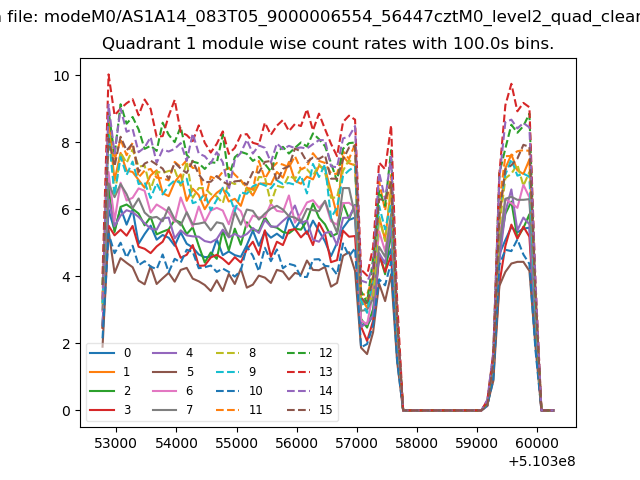
| Module-wise count rates for Quadrant A Data is divided into 100 sec bins |
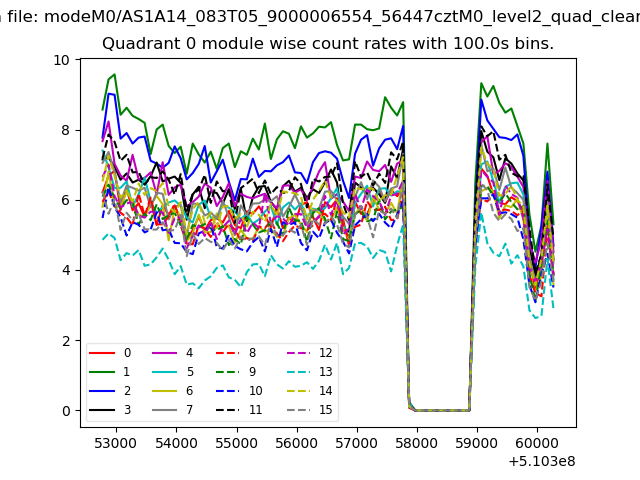 |
 |
| Module-wise count rates for Quadrant B Data is divided into 100 sec bins |
 |
 |
| Module-wise count rates for Quadrant C Data is divided into 100 sec bins |
 |
 |
| Module-wise count rates for Quadrant D Data is divided into 100 sec bins |
 |
 |
| Parameter | Plot |
|---|---|
| CZT HV Monitor |  |
| D_VDD |  |
| Temperature 1 | 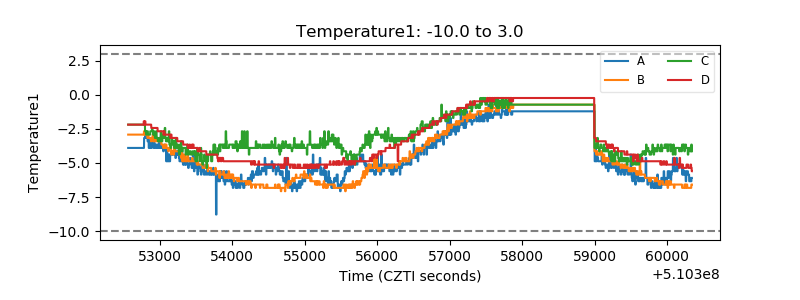 |
| Veto HV Monitor | 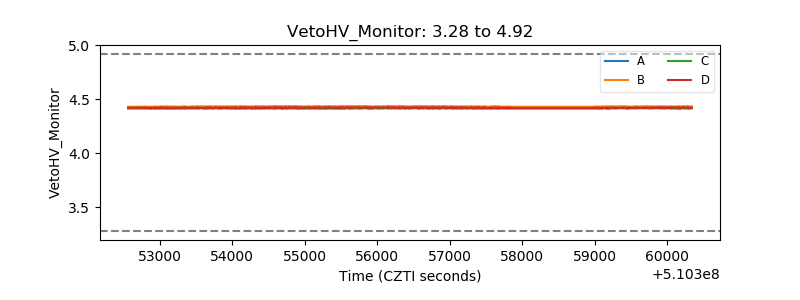 |
| Veto LLD | 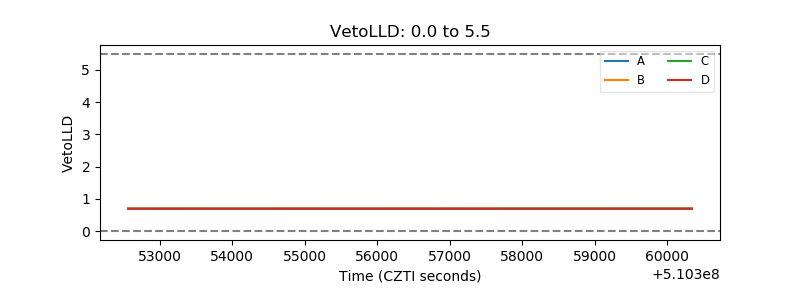 |
| Alpha Counter |  |
| _CPM_Rate | 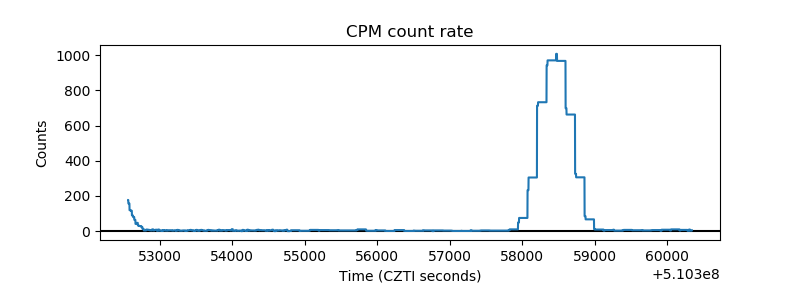 |
| CZT Counter | 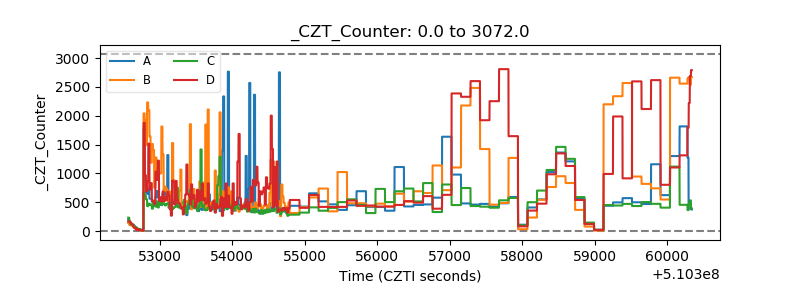 |
| +2.5 Volts monitor |  |
| +5 Volts monitor |  |
| _ROLL_ROT | 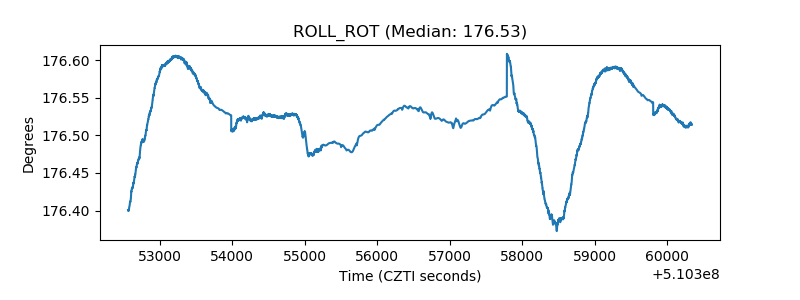 |
| _Roll_DEC | 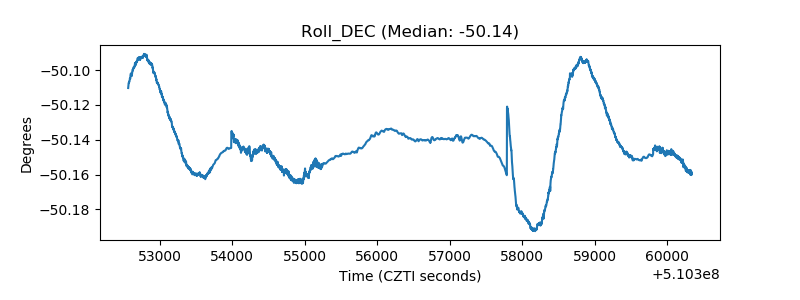 |
| _Roll_RA |  |
| Veto Counter | 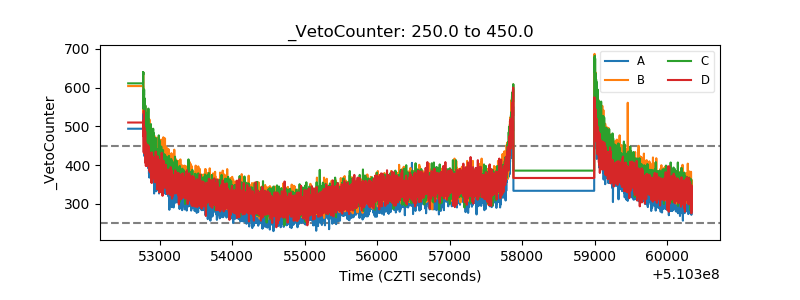 |