| Param | Original file | Final file |
|---|---|---|
| Filename | modeM0/AS1A14_083T05_9000006554_56448cztM0_level2.fits | modeM0/AS1A14_083T05_9000006554_56448cztM0_level2_quad_clean.evt |
| Size (bytes) | 908,841,600 | 78,880,320 |
| Size | 866.7 MB | 75.2 MB |
| Events in quadrant A | 6,595,581 | 574,442 |
| Events in quadrant B | 12,146,800 | 295,969 |
| Events in quadrant C | 3,251,625 | 636,418 |
| Events in quadrant D | 11,127,225 | 411,416 |
| Mode M9 | |||
|---|---|---|---|
| Quadrant | BADHDUFLAG | Total packets | Discarded packets |
| A | 0 | 21 | 0 |
| B | 0 | 22 | 0 |
| C | 0 | 22 | 0 |
| D | 0 | 22 | 0 |
| Mode SS | |||
|---|---|---|---|
| Quadrant | BADHDUFLAG | Total packets | Discarded packets |
| A | 0 | 136 | 0 |
| B | 0 | 136 | 0 |
| C | 0 | 136 | 0 |
| D | 0 | 136 | 0 |
| Mode M0 | |||
|---|---|---|---|
| Quadrant | BADHDUFLAG | Total packets | Discarded packets |
| A | 0 | 24129 | 2 |
| B | 0 | 40712 | 2 |
| C | 0 | 14401 | 2 |
| D | 0 | 37758 | 3 |
| Quadrant | Total seconds | Saturated seconds | Saturation percentage |
|---|---|---|---|
| A | 6742 | 1015 | 15.054880% |
| B | 6742 | 4161 | 61.717591% |
| C | 6742 | 45 | 0.667458% |
| D | 6741 | 2462 | 36.522771% |
Noise dominated data is calculated using 1-second bins in cleaned event files. If a bin has >2000 counts, and if more than 50% of those come from <1% of pixels, then it is considered to be noise-dominated and hence unusable.
| Quadrant | # 1 sec bins | Bins with >0 counts | Bins with >2000 counts | High rate bins dominated by noise | Noise dominated (total time) | Noise dominated (detector-on time) | Marked lightcurve |
|---|---|---|---|---|---|---|---|
| A | 7917 | 6742 | 998 | 998 | 12.61% | 14.80% |  |
| B | 7917 | 6742 | 3860 | 3860 | 48.76% | 57.25% |  |
| C | 7917 | 6743 | 27 | 27 | 0.34% | 0.40% | 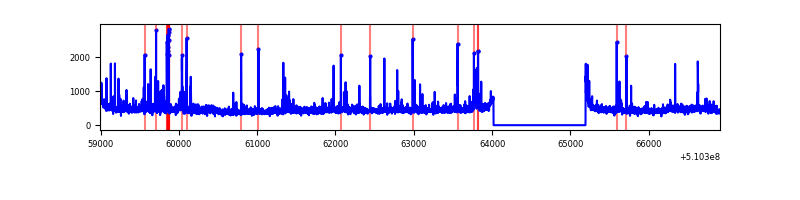 |
| D | 7916 | 6741 | 2676 | 2676 | 33.80% | 39.70% |  |
Top three noisy pixels from each quadrant. If the there are fewer than three noisy pixels in the level2.evt file, extra rows are filled as -1
| Pixel properties | Quadrant properties | ||||||
|---|---|---|---|---|---|---|---|
| Quadrant | DetID | PixID | Counts | Sigma | Mean | Median | Sigma |
| A | 12 | 3 | 2377308 | 14019.88 | 682 | 667 | 169.5 |
| A | 3 | 14 | 630378 | 3714.68 | 682 | 667 | 169.5 |
| A | 4 | 95 | 336484 | 1980.99 | 682 | 667 | 169.5 |
| B | 5 | 172 | 9434158 | 96695.84 | 457 | 441 | 97.6 |
| B | 4 | 206 | 740767 | 7588.36 | 457 | 441 | 97.6 |
| B | 0 | 63 | 39602 | 401.4 | 457 | 441 | 97.6 |
| C | 1 | 16 | 206581 | 1051.16 | 712 | 705 | 195.9 |
| C | 12 | 252 | 75471 | 381.74 | 712 | 705 | 195.9 |
| C | 12 | 249 | 74212 | 375.31 | 712 | 705 | 195.9 |
| D | 5 | 113 | 5706241 | 32185.24 | 622 | 593 | 177.3 |
| D | 8 | 129 | 2165686 | 12213.17 | 622 | 593 | 177.3 |
| D | 12 | 3 | 207731 | 1168.45 | 622 | 593 | 177.3 |
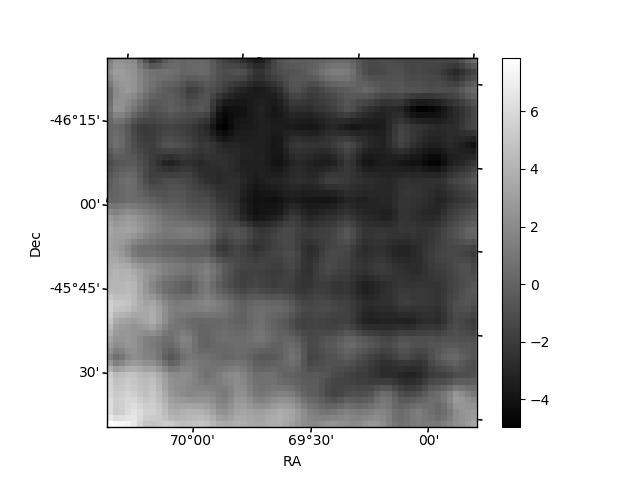
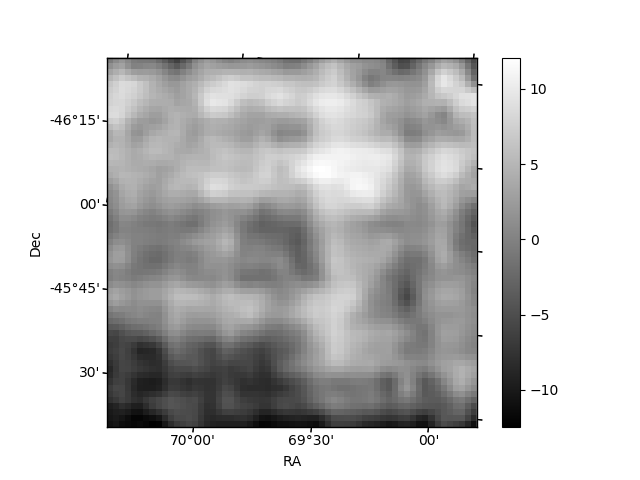
Histogram calculated using DETX and DETY for each event in the final _common_clean file
| Quadrant A | 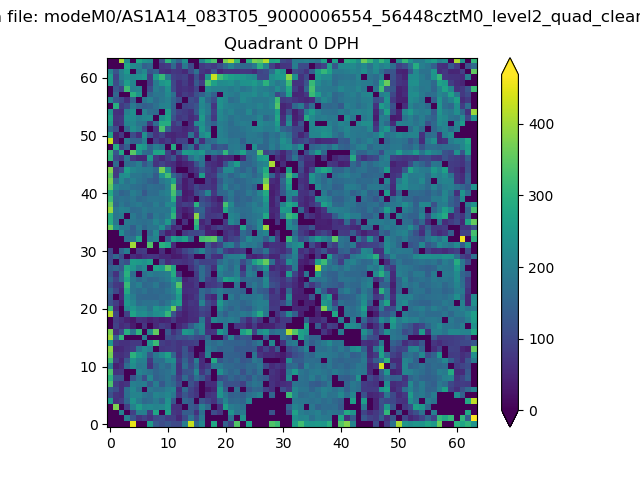 |
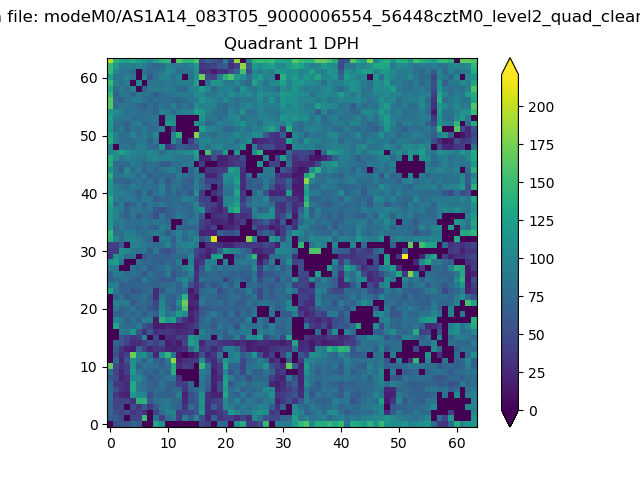 |
Quadrant B |
|---|---|---|---|
| Quadrant D |  |
 |
Quadrant C |
| Plot type | Count rate plots | Images |
|---|---|---|
| Comparison with Poisson distribution Blue bars denote a histogram of data divided into 1 sec bins. Red curve is a Poisson curve with rate = median count rate of data. |
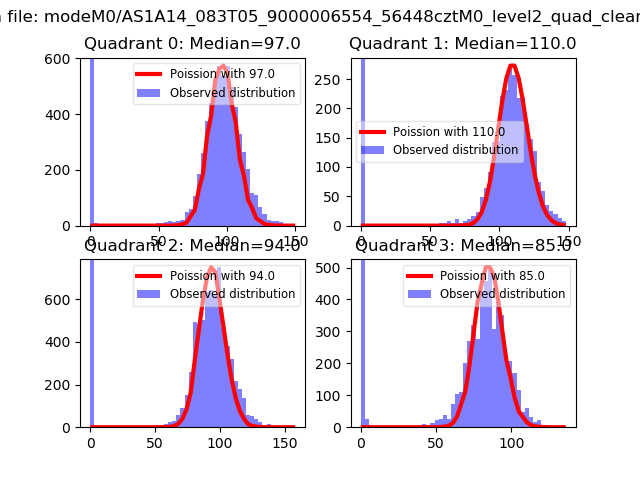 |
 |
| Quadrant-wise count rates Data is divided into 100 sec bins |
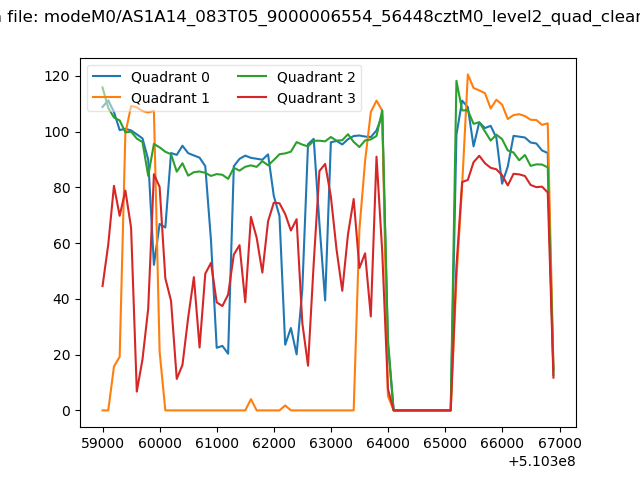 |
|
| Module-wise count rates for Quadrant A Data is divided into 100 sec bins |
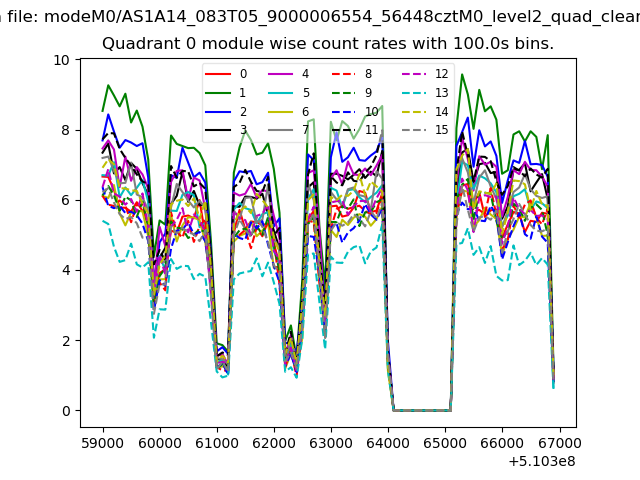 |
 |
| Module-wise count rates for Quadrant B Data is divided into 100 sec bins |
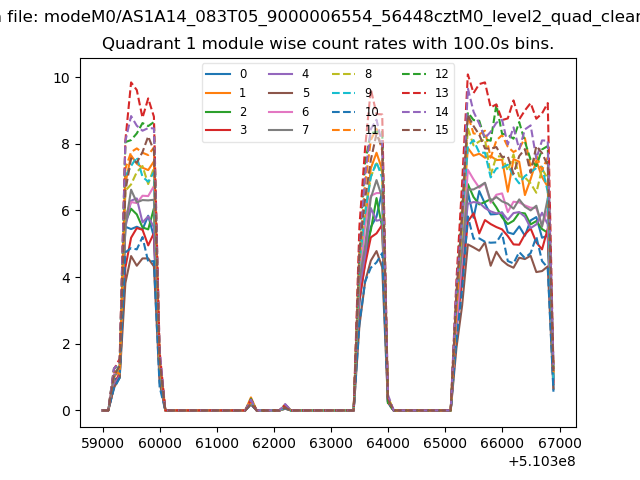 |
 |
| Module-wise count rates for Quadrant C Data is divided into 100 sec bins |
 |
 |
| Module-wise count rates for Quadrant D Data is divided into 100 sec bins |
 |
 |
| Parameter | Plot |
|---|---|
| CZT HV Monitor |  |
| D_VDD |  |
| Temperature 1 |  |
| Veto HV Monitor | 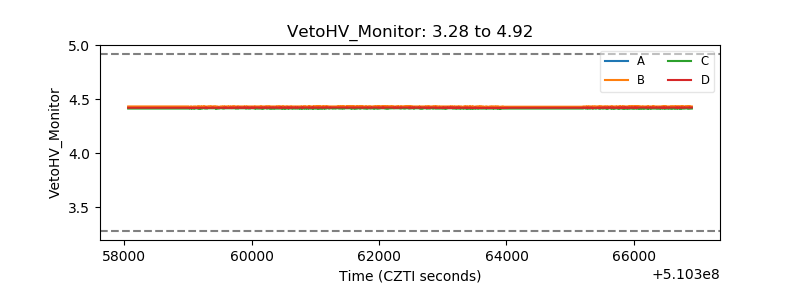 |
| Veto LLD | 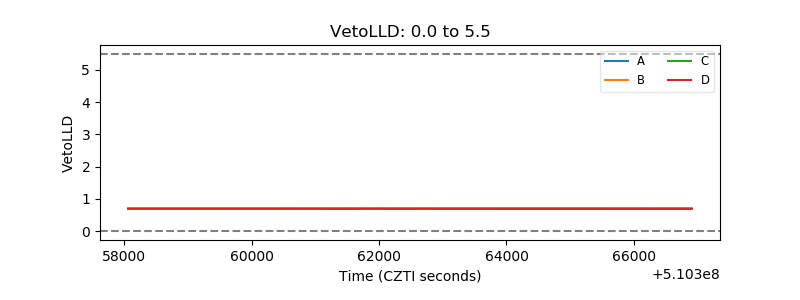 |
| Alpha Counter |  |
| _CPM_Rate | 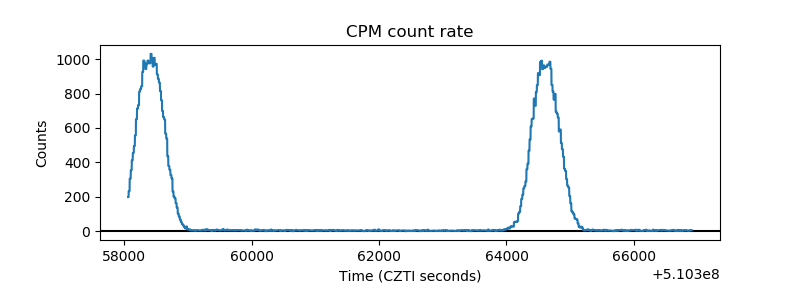 |
| CZT Counter | 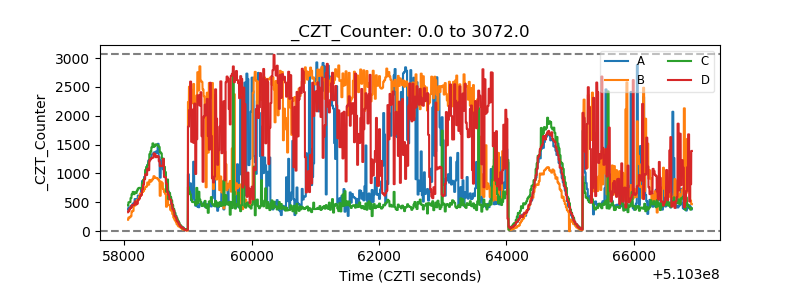 |
| +2.5 Volts monitor |  |
| +5 Volts monitor |  |
| _ROLL_ROT | 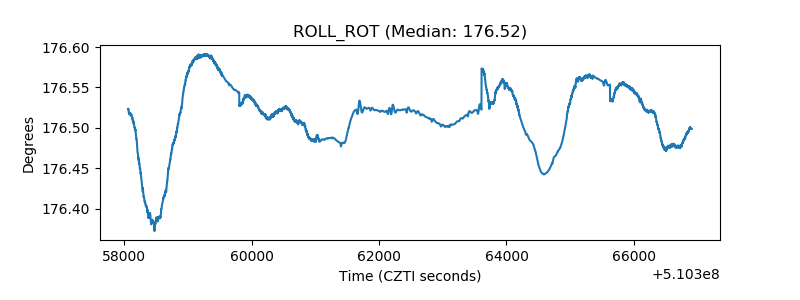 |
| _Roll_DEC | 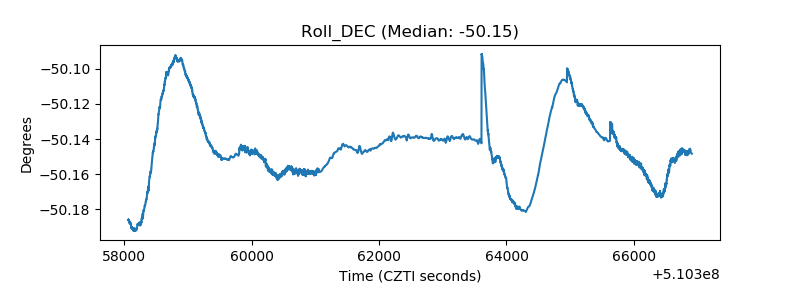 |
| _Roll_RA |  |
| Veto Counter | 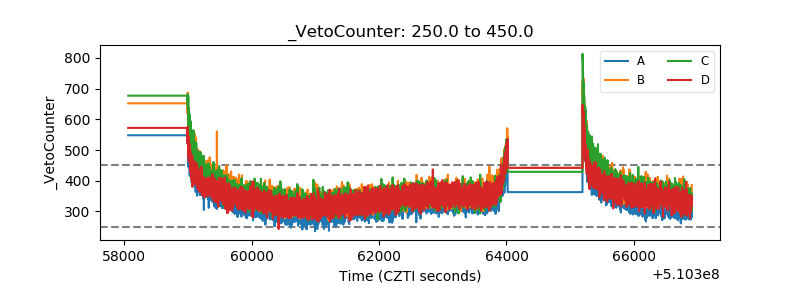 |