| Param | Original file | Final file |
|---|---|---|
| Filename | modeM0/AS1A14_083T05_9000006554_56449cztM0_level2.fits | modeM0/AS1A14_083T05_9000006554_56449cztM0_level2_quad_clean.evt |
| Size (bytes) | 671,448,960 | 77,739,840 |
| Size | 640.3 MB | 74.1 MB |
| Events in quadrant A | 5,087,637 | 511,468 |
| Events in quadrant B | 7,195,156 | 508,044 |
| Events in quadrant C | 3,568,354 | 530,826 |
| Events in quadrant D | 8,540,741 | 386,099 |
| Mode M9 | |||
|---|---|---|---|
| Quadrant | BADHDUFLAG | Total packets | Discarded packets |
| A | 0 | 12 | 0 |
| B | 0 | 12 | 0 |
| C | 0 | 12 | 0 |
| D | 0 | 12 | 0 |
| Mode SS | |||
|---|---|---|---|
| Quadrant | BADHDUFLAG | Total packets | Discarded packets |
| A | 0 | 120 | 0 |
| B | 0 | 120 | 0 |
| C | 0 | 120 | 0 |
| D | 0 | 120 | 0 |
| Mode M0 | |||
|---|---|---|---|
| Quadrant | BADHDUFLAG | Total packets | Discarded packets |
| A | 0 | 19335 | 1 |
| B | 0 | 25530 | 1 |
| C | 0 | 14756 | 1 |
| D | 0 | 29568 | 1 |
| Quadrant | Total seconds | Saturated seconds | Saturation percentage |
|---|---|---|---|
| A | 5976 | 847 | 14.173360% |
| B | 5976 | 1448 | 24.230254% |
| C | 5976 | 365 | 6.107764% |
| D | 5976 | 1731 | 28.965863% |
Noise dominated data is calculated using 1-second bins in cleaned event files. If a bin has >2000 counts, and if more than 50% of those come from <1% of pixels, then it is considered to be noise-dominated and hence unusable.
| Quadrant | # 1 sec bins | Bins with >0 counts | Bins with >2000 counts | High rate bins dominated by noise | Noise dominated (total time) | Noise dominated (detector-on time) | Marked lightcurve |
|---|---|---|---|---|---|---|---|
| A | 7126 | 5976 | 776 | 776 | 10.89% | 12.99% | 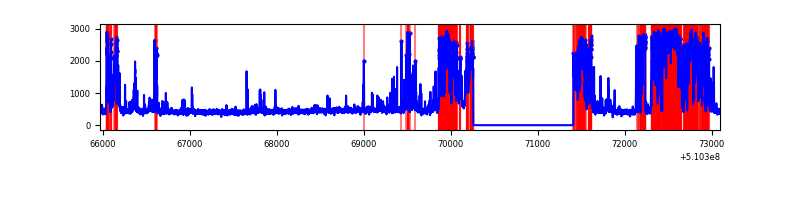 |
| B | 7126 | 5976 | 1033 | 1033 | 14.50% | 17.29% | 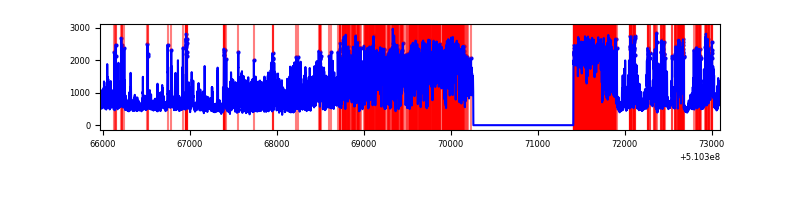 |
| C | 7126 | 5976 | 283 | 283 | 3.97% | 4.74% |  |
| D | 7125 | 5975 | 1795 | 1795 | 25.19% | 30.04% | 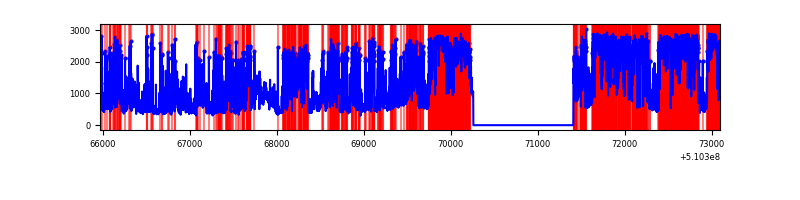 |
Top three noisy pixels from each quadrant. If the there are fewer than three noisy pixels in the level2.evt file, extra rows are filled as -1
| Pixel properties | Quadrant properties | ||||||
|---|---|---|---|---|---|---|---|
| Quadrant | DetID | PixID | Counts | Sigma | Mean | Median | Sigma |
| A | 12 | 3 | 2143742 | 14256.28 | 608 | 593 | 150.3 |
| A | 12 | 194 | 281962 | 1871.67 | 608 | 593 | 150.3 |
| A | 4 | 249 | 137914 | 913.46 | 608 | 593 | 150.3 |
| B | 5 | 172 | 3178446 | 25583.22 | 585 | 564 | 124.2 |
| B | 4 | 206 | 1465654 | 11794.56 | 585 | 564 | 124.2 |
| B | 15 | 33 | 65653 | 523.99 | 585 | 564 | 124.2 |
| C | 12 | 254 | 722296 | 4272.07 | 618 | 613 | 168.9 |
| C | 12 | 252 | 170500 | 1005.66 | 618 | 613 | 168.9 |
| C | 1 | 16 | 169517 | 999.84 | 618 | 613 | 168.9 |
| D | 5 | 113 | 4174719 | 26178.86 | 557 | 531 | 159.4 |
| D | 8 | 129 | 1124594 | 7049.68 | 557 | 531 | 159.4 |
| D | 2 | 249 | 649165 | 4067.98 | 557 | 531 | 159.4 |
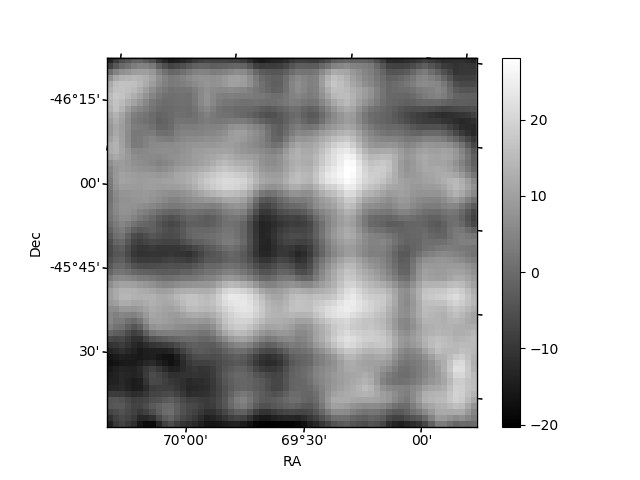
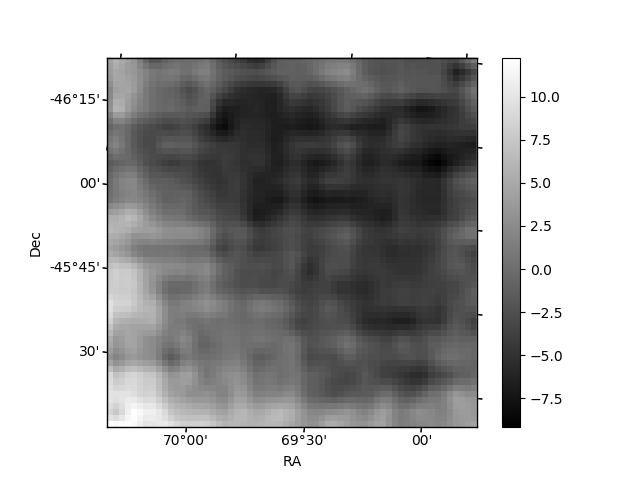
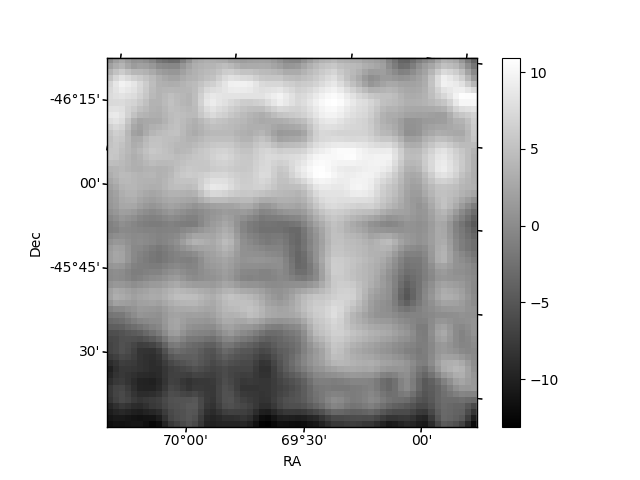
Histogram calculated using DETX and DETY for each event in the final _common_clean file
| Quadrant A | 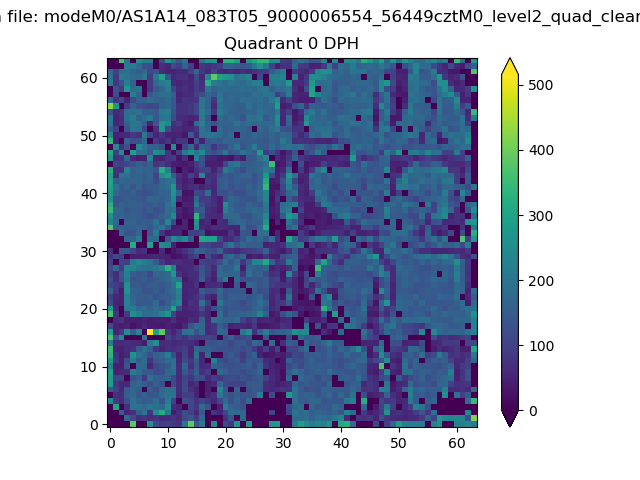 |
 |
Quadrant B |
|---|---|---|---|
| Quadrant D |  |
 |
Quadrant C |
| Plot type | Count rate plots | Images |
|---|---|---|
| Comparison with Poisson distribution Blue bars denote a histogram of data divided into 1 sec bins. Red curve is a Poisson curve with rate = median count rate of data. |
 |
 |
| Quadrant-wise count rates Data is divided into 100 sec bins |
 |
|
| Module-wise count rates for Quadrant A Data is divided into 100 sec bins |
 |
 |
| Module-wise count rates for Quadrant B Data is divided into 100 sec bins |
 |
 |
| Module-wise count rates for Quadrant C Data is divided into 100 sec bins |
 |
 |
| Module-wise count rates for Quadrant D Data is divided into 100 sec bins |
 |
 |
| Parameter | Plot |
|---|---|
| CZT HV Monitor | 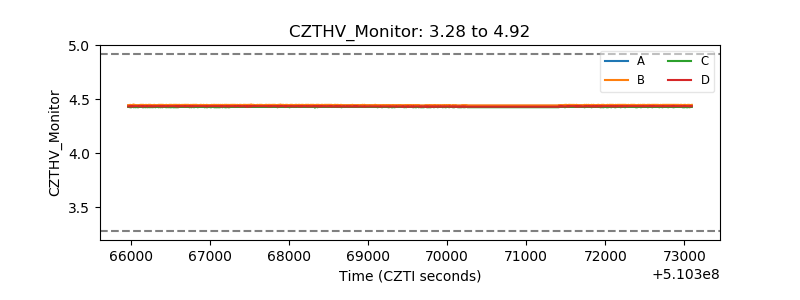 |
| D_VDD | 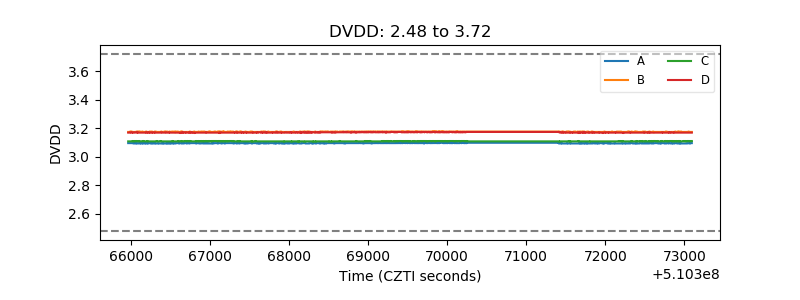 |
| Temperature 1 | 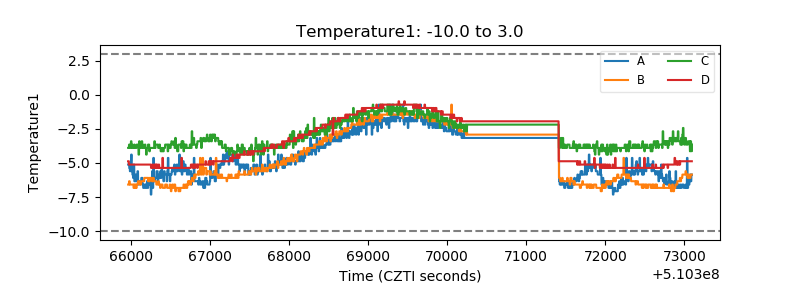 |
| Veto HV Monitor | 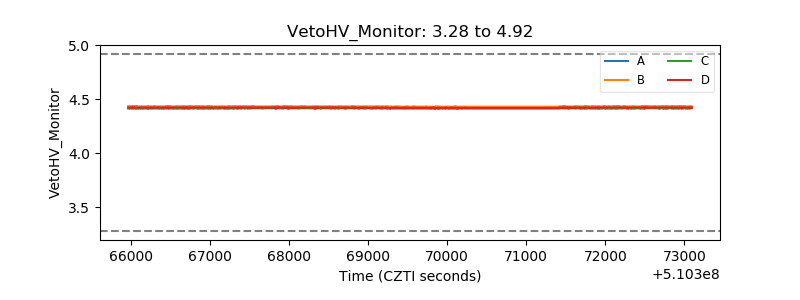 |
| Veto LLD |  |
| Alpha Counter |  |
| _CPM_Rate |  |
| CZT Counter |  |
| +2.5 Volts monitor |  |
| +5 Volts monitor | 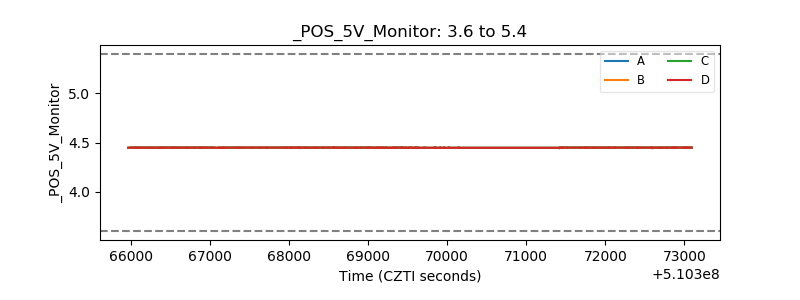 |
| _ROLL_ROT | 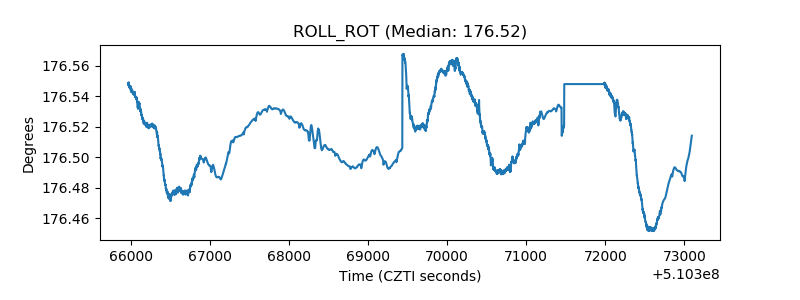 |
| _Roll_DEC | 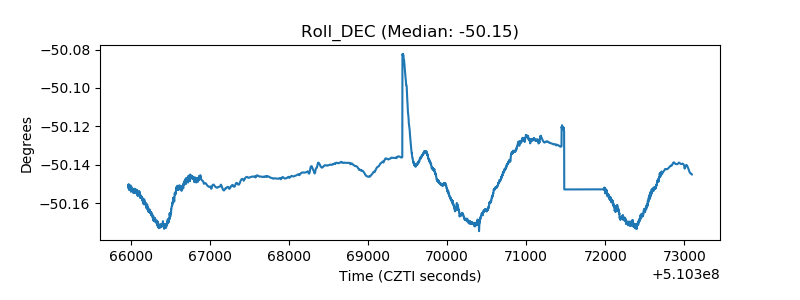 |
| _Roll_RA | 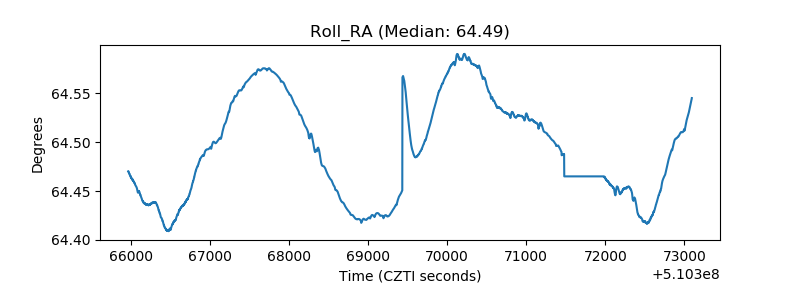 |
| Veto Counter | 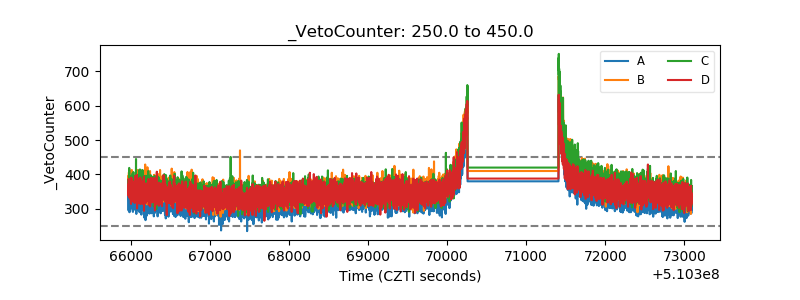 |