| Param | Original file | Final file |
|---|---|---|
| Filename | modeM0/AS1A14_083T05_9000006554_56450cztM0_level2.fits | modeM0/AS1A14_083T05_9000006554_56450cztM0_level2_quad_clean.evt |
| Size (bytes) | 805,069,440 | 72,204,480 |
| Size | 767.8 MB | 68.9 MB |
| Events in quadrant A | 7,621,061 | 437,174 |
| Events in quadrant B | 8,379,893 | 429,473 |
| Events in quadrant C | 3,288,243 | 545,853 |
| Events in quadrant D | 10,044,409 | 351,473 |
| Mode M9 | |||
|---|---|---|---|
| Quadrant | BADHDUFLAG | Total packets | Discarded packets |
| A | 0 | 11 | 0 |
| B | 0 | 11 | 0 |
| C | 0 | 11 | 0 |
| D | 0 | 11 | 0 |
| Mode SS | |||
|---|---|---|---|
| Quadrant | BADHDUFLAG | Total packets | Discarded packets |
| A | 0 | 122 | 0 |
| B | 0 | 122 | 0 |
| C | 0 | 122 | 0 |
| D | 0 | 122 | 0 |
| Mode M0 | |||
|---|---|---|---|
| Quadrant | BADHDUFLAG | Total packets | Discarded packets |
| A | 0 | 26805 | 2 |
| B | 0 | 29030 | 1 |
| C | 0 | 14215 | 1 |
| D | 0 | 34059 | 1 |
| Quadrant | Total seconds | Saturated seconds | Saturation percentage |
|---|---|---|---|
| A | 6041 | 1727 | 28.587982% |
| B | 6042 | 2239 | 37.057266% |
| C | 6042 | 198 | 3.277061% |
| D | 6042 | 2212 | 36.610394% |
Noise dominated data is calculated using 1-second bins in cleaned event files. If a bin has >2000 counts, and if more than 50% of those come from <1% of pixels, then it is considered to be noise-dominated and hence unusable.
| Quadrant | # 1 sec bins | Bins with >0 counts | Bins with >2000 counts | High rate bins dominated by noise | Noise dominated (total time) | Noise dominated (detector-on time) | Marked lightcurve |
|---|---|---|---|---|---|---|---|
| A | 7150 | 6040 | 1732 | 1732 | 24.22% | 28.68% | 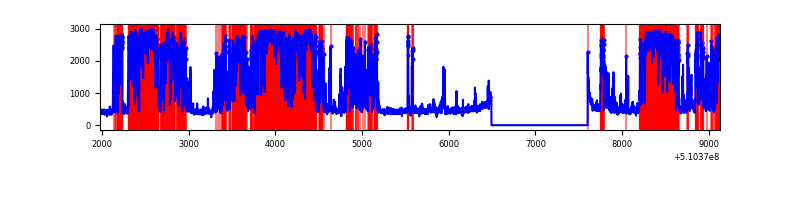 |
| B | 7152 | 6042 | 1922 | 1922 | 26.87% | 31.81% | 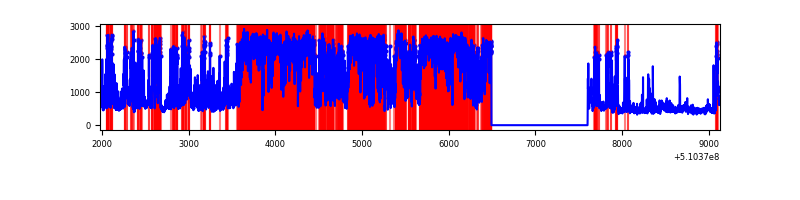 |
| C | 7152 | 6043 | 142 | 142 | 1.99% | 2.35% |  |
| D | 7152 | 6042 | 2400 | 2400 | 33.56% | 39.72% |  |
Top three noisy pixels from each quadrant. If the there are fewer than three noisy pixels in the level2.evt file, extra rows are filled as -1
| Pixel properties | Quadrant properties | ||||||
|---|---|---|---|---|---|---|---|
| Quadrant | DetID | PixID | Counts | Sigma | Mean | Median | Sigma |
| A | 12 | 3 | 4166387 | 29659.93 | 570 | 555 | 140.5 |
| A | 12 | 194 | 540985 | 3847.76 | 570 | 555 | 140.5 |
| A | 7 | 64 | 283106 | 2011.71 | 570 | 555 | 140.5 |
| B | 5 | 172 | 4795636 | 40259.49 | 557 | 537 | 119.1 |
| B | 4 | 206 | 1241913 | 10422.55 | 557 | 537 | 119.1 |
| B | 0 | 63 | 31268 | 258.02 | 557 | 537 | 119.1 |
| C | 6 | 223 | 360197 | 2087.88 | 632 | 625 | 172.2 |
| C | 12 | 254 | 247572 | 1433.92 | 632 | 625 | 172.2 |
| C | 12 | 252 | 97774 | 564.1 | 632 | 625 | 172.2 |
| D | 8 | 129 | 3326072 | 21316.48 | 547 | 521 | 156.0 |
| D | 5 | 113 | 3193577 | 20467.2 | 547 | 521 | 156.0 |
| D | 12 | 4 | 450729 | 2885.79 | 547 | 521 | 156.0 |
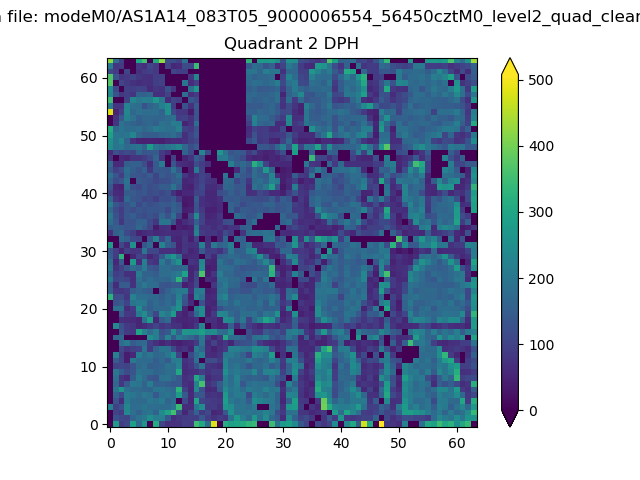
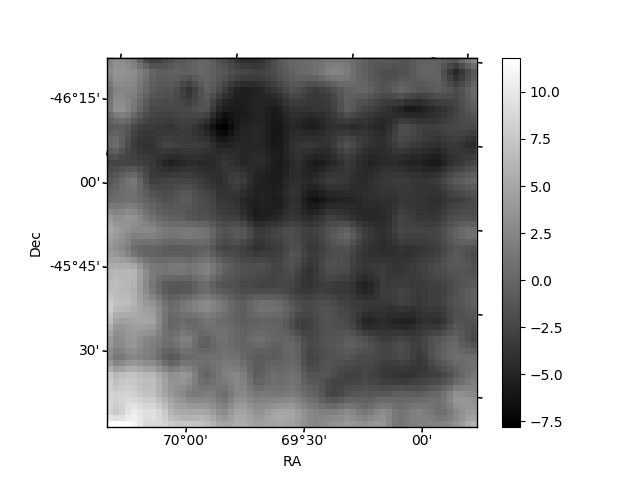
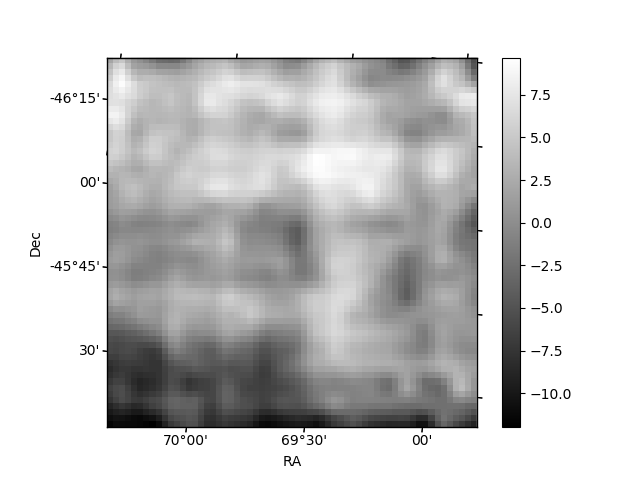
Histogram calculated using DETX and DETY for each event in the final _common_clean file
| Quadrant A | 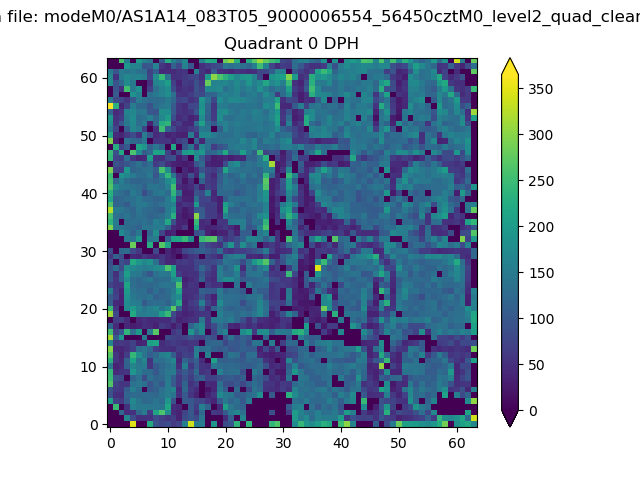 |
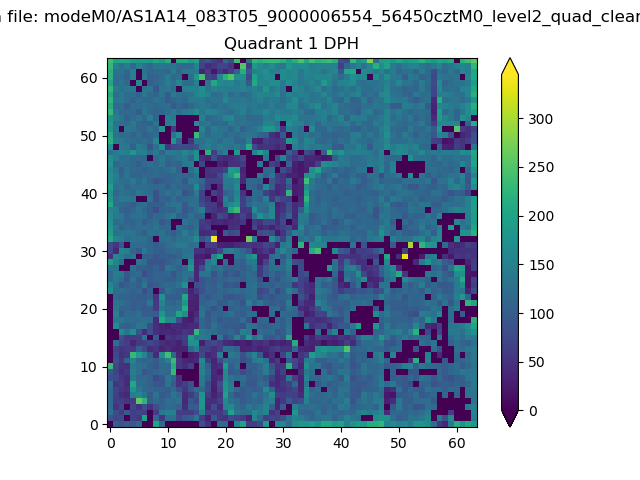 |
Quadrant B |
|---|---|---|---|
| Quadrant D | 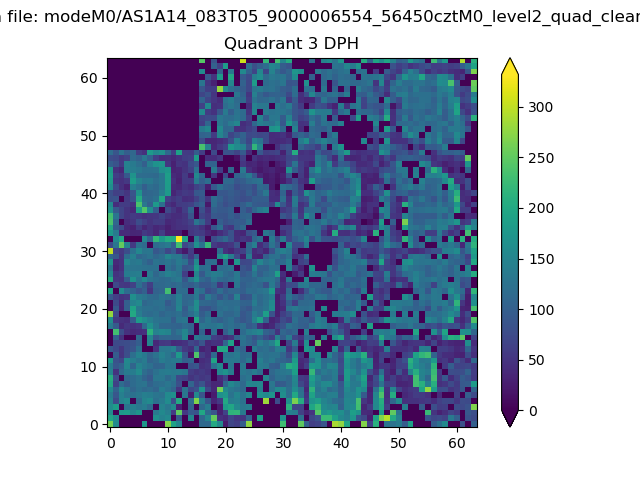 |
 |
Quadrant C |
| Plot type | Count rate plots | Images |
|---|---|---|
| Comparison with Poisson distribution Blue bars denote a histogram of data divided into 1 sec bins. Red curve is a Poisson curve with rate = median count rate of data. |
 |
 |
| Quadrant-wise count rates Data is divided into 100 sec bins |
 |
|
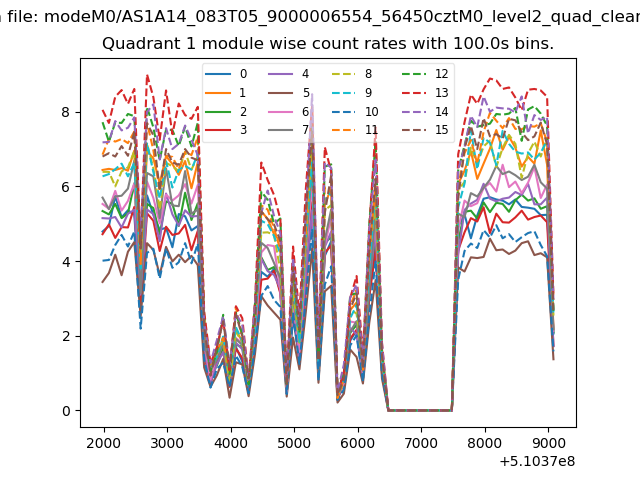
| Module-wise count rates for Quadrant A Data is divided into 100 sec bins |
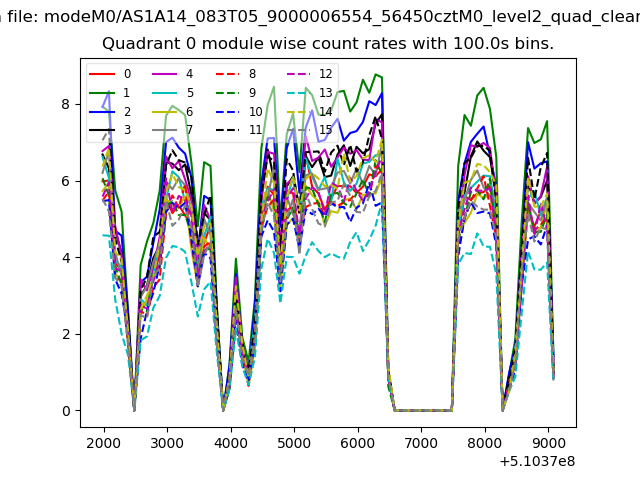 |
 |
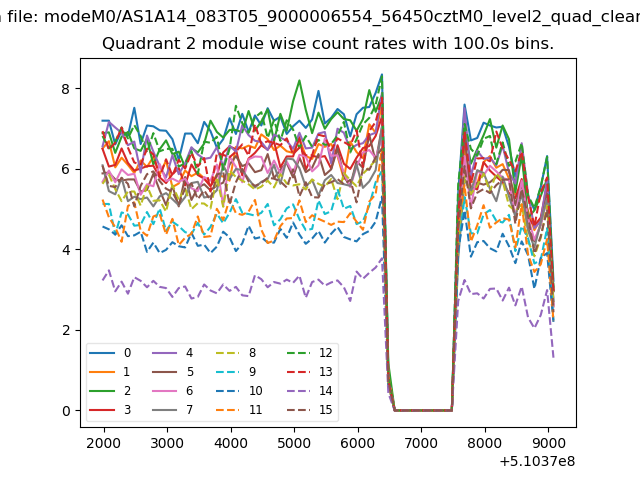
| Module-wise count rates for Quadrant B Data is divided into 100 sec bins |
 |
 |
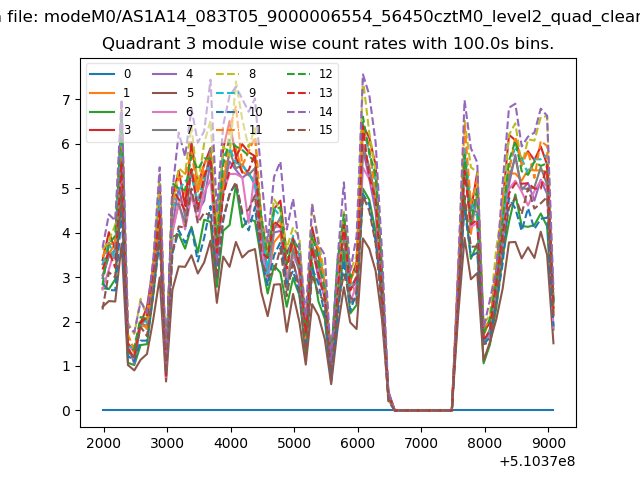
| Module-wise count rates for Quadrant C Data is divided into 100 sec bins |
 |
 |
| Module-wise count rates for Quadrant D Data is divided into 100 sec bins |
 |
 |
| Parameter | Plot |
|---|---|
| CZT HV Monitor |  |
| D_VDD |  |
| Temperature 1 | 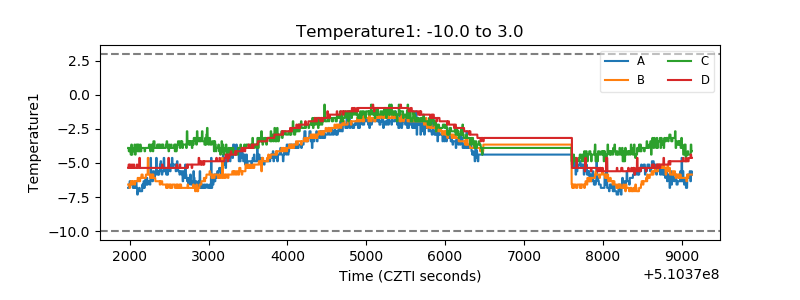 |
| Veto HV Monitor | 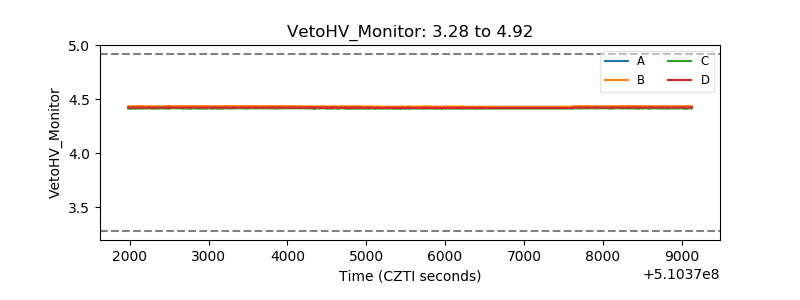 |
| Veto LLD |  |
| Alpha Counter |  |
| _CPM_Rate |  |
| CZT Counter | 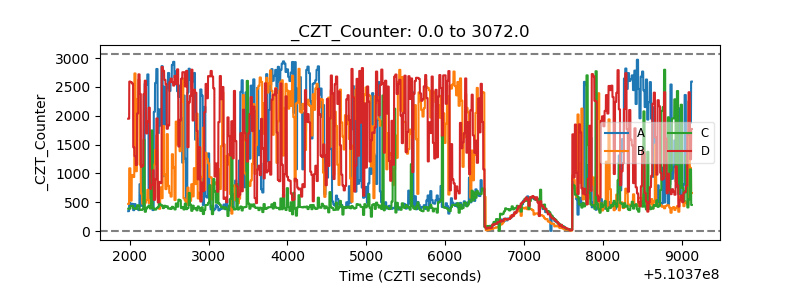 |
| +2.5 Volts monitor | 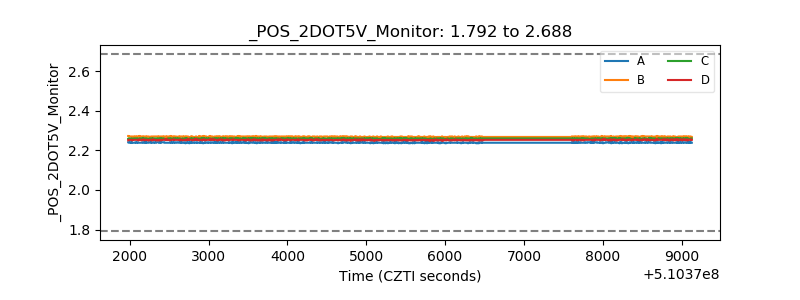 |
| +5 Volts monitor |  |
| _ROLL_ROT | 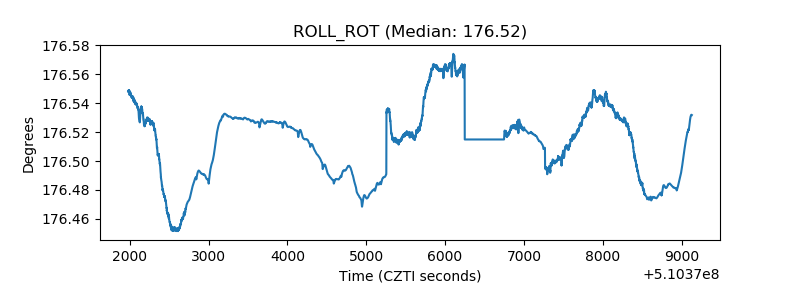 |
| _Roll_DEC | 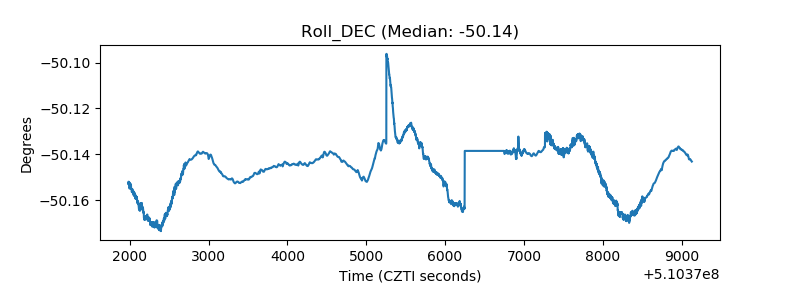 |
| _Roll_RA | 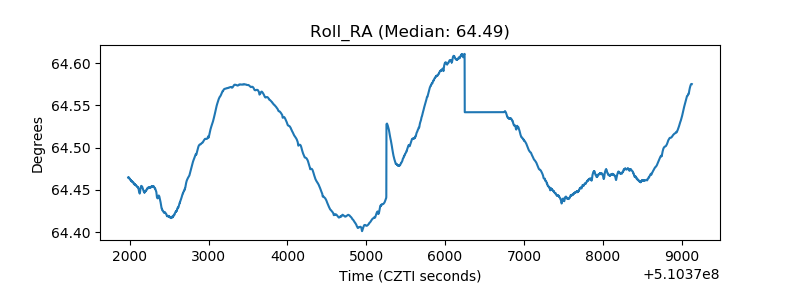 |
| Veto Counter | 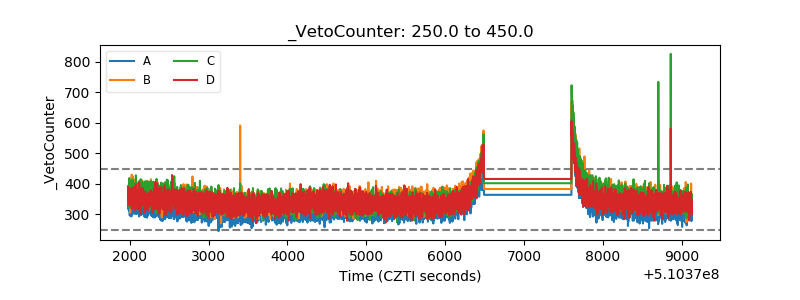 |