| Param | Original file | Final file |
|---|---|---|
| Filename | modeM0/AS1A14_083T05_9000006554_56451cztM0_level2.fits | modeM0/AS1A14_083T05_9000006554_56451cztM0_level2_quad_clean.evt |
| Size (bytes) | 774,308,160 | 88,678,080 |
| Size | 738.4 MB | 84.6 MB |
| Events in quadrant A | 6,820,399 | 567,016 |
| Events in quadrant B | 8,034,732 | 558,613 |
| Events in quadrant C | 4,320,343 | 606,893 |
| Events in quadrant D | 8,956,694 | 474,959 |
| Mode M9 | |||
|---|---|---|---|
| Quadrant | BADHDUFLAG | Total packets | Discarded packets |
| A | 0 | 16 | 0 |
| B | 0 | 16 | 0 |
| C | 0 | 17 | 0 |
| D | 0 | 17 | 0 |
| Mode SS | |||
|---|---|---|---|
| Quadrant | BADHDUFLAG | Total packets | Discarded packets |
| A | 0 | 138 | 0 |
| B | 0 | 138 | 0 |
| C | 0 | 138 | 0 |
| D | 0 | 138 | 0 |
| Mode M0 | |||
|---|---|---|---|
| Quadrant | BADHDUFLAG | Total packets | Discarded packets |
| A | 0 | 24959 | 2 |
| B | 0 | 28532 | 2 |
| C | 0 | 17685 | 2 |
| D | 0 | 31403 | 3 |
| Quadrant | Total seconds | Saturated seconds | Saturation percentage |
|---|---|---|---|
| A | 6853 | 1055 | 15.394718% |
| B | 6853 | 1730 | 25.244419% |
| C | 6853 | 325 | 4.742449% |
| D | 6852 | 1512 | 22.066550% |
Noise dominated data is calculated using 1-second bins in cleaned event files. If a bin has >2000 counts, and if more than 50% of those come from <1% of pixels, then it is considered to be noise-dominated and hence unusable.
| Quadrant | # 1 sec bins | Bins with >0 counts | Bins with >2000 counts | High rate bins dominated by noise | Noise dominated (total time) | Noise dominated (detector-on time) | Marked lightcurve |
|---|---|---|---|---|---|---|---|
| A | 7653 | 6853 | 979 | 979 | 12.79% | 14.29% |  |
| B | 7653 | 6853 | 1402 | 1402 | 18.32% | 20.46% |  |
| C | 7652 | 6852 | 225 | 225 | 2.94% | 3.28% |  |
| D | 7652 | 6852 | 1667 | 1667 | 21.79% | 24.33% | 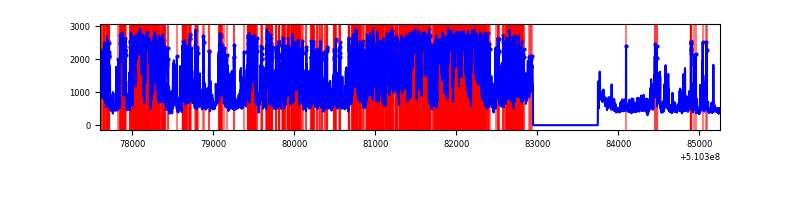 |
Top three noisy pixels from each quadrant. If the there are fewer than three noisy pixels in the level2.evt file, extra rows are filled as -1
| Pixel properties | Quadrant properties | ||||||
|---|---|---|---|---|---|---|---|
| Quadrant | DetID | PixID | Counts | Sigma | Mean | Median | Sigma |
| A | 12 | 3 | 2027671 | 11670.31 | 704 | 684 | 173.7 |
| A | 7 | 64 | 1117200 | 6428.31 | 704 | 684 | 173.7 |
| A | 12 | 194 | 273966 | 1573.41 | 704 | 684 | 173.7 |
| B | 5 | 172 | 4346518 | 29948.28 | 673 | 647 | 145.1 |
| B | 4 | 206 | 620187 | 4269.38 | 673 | 647 | 145.1 |
| B | 10 | 247 | 182681 | 1254.43 | 673 | 647 | 145.1 |
| C | 12 | 254 | 722164 | 3651.97 | 723 | 717 | 197.5 |
| C | 6 | 223 | 330274 | 1668.22 | 723 | 717 | 197.5 |
| C | 1 | 16 | 219897 | 1109.49 | 723 | 717 | 197.5 |
| D | 5 | 113 | 3390225 | 18022.05 | 672 | 643 | 188.1 |
| D | 8 | 129 | 1364280 | 7250.31 | 672 | 643 | 188.1 |
| D | 2 | 249 | 718143 | 3814.87 | 672 | 643 | 188.1 |
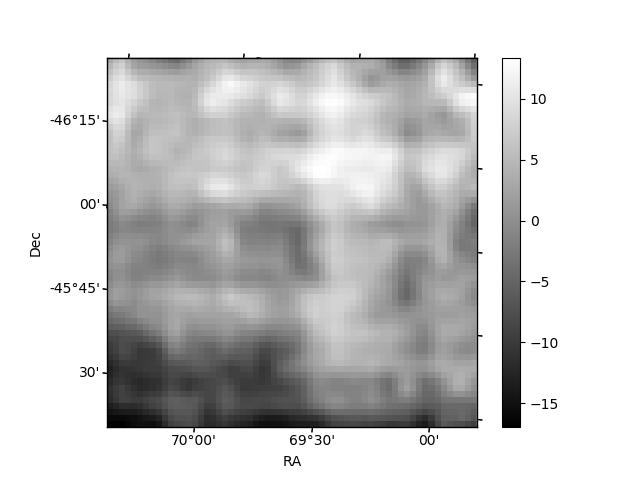
Histogram calculated using DETX and DETY for each event in the final _common_clean file
| Quadrant A |  |
 |
Quadrant B |
|---|---|---|---|
| Quadrant D | 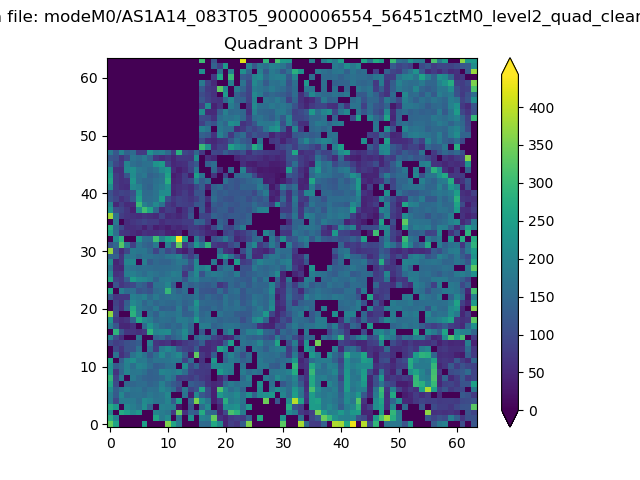 |
 |
Quadrant C |
| Plot type | Count rate plots | Images |
|---|---|---|
| Comparison with Poisson distribution Blue bars denote a histogram of data divided into 1 sec bins. Red curve is a Poisson curve with rate = median count rate of data. |
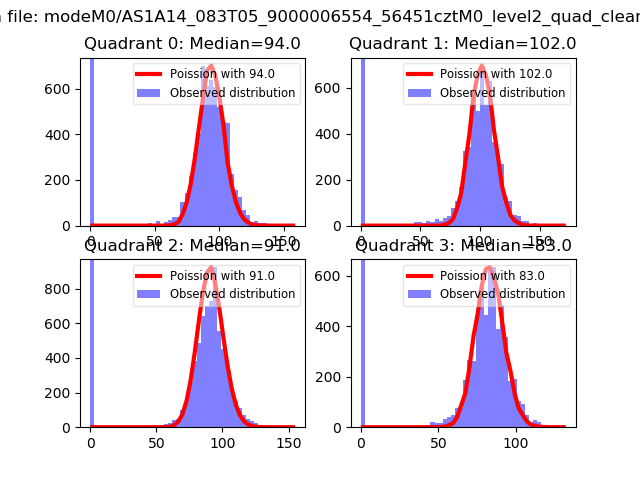 |
 |
| Quadrant-wise count rates Data is divided into 100 sec bins |
 |
|
| Module-wise count rates for Quadrant A Data is divided into 100 sec bins |
 |
 |
| Module-wise count rates for Quadrant B Data is divided into 100 sec bins |
 |
 |
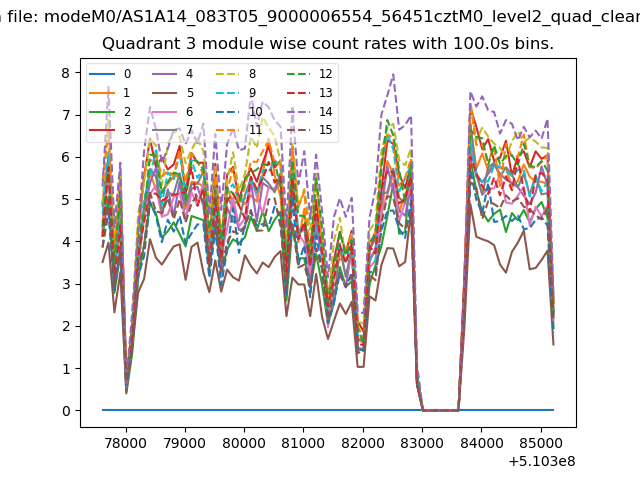
| Module-wise count rates for Quadrant C Data is divided into 100 sec bins |
 |
 |
| Module-wise count rates for Quadrant D Data is divided into 100 sec bins |
 |
 |
| Parameter | Plot |
|---|---|
| CZT HV Monitor | 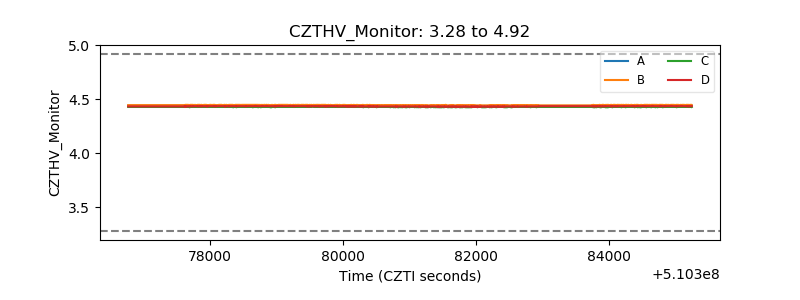 |
| D_VDD |  |
| Temperature 1 | 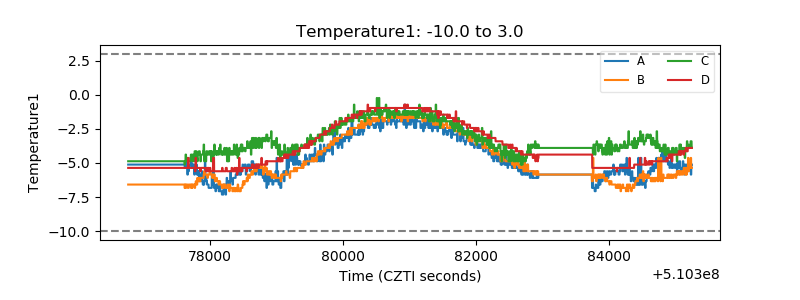 |
| Veto HV Monitor | 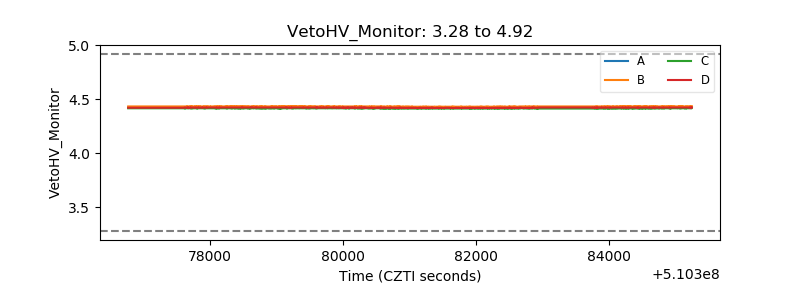 |
| Veto LLD |  |
| Alpha Counter | 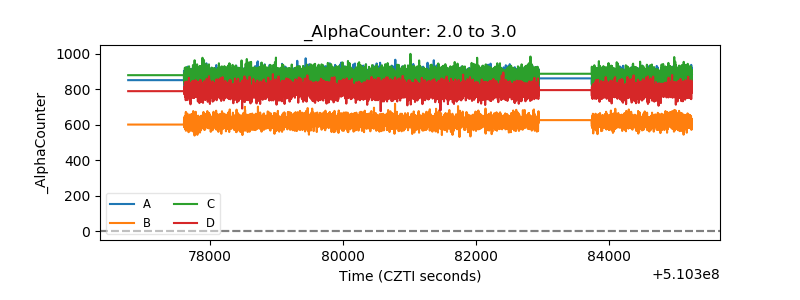 |
| _CPM_Rate |  |
| CZT Counter | 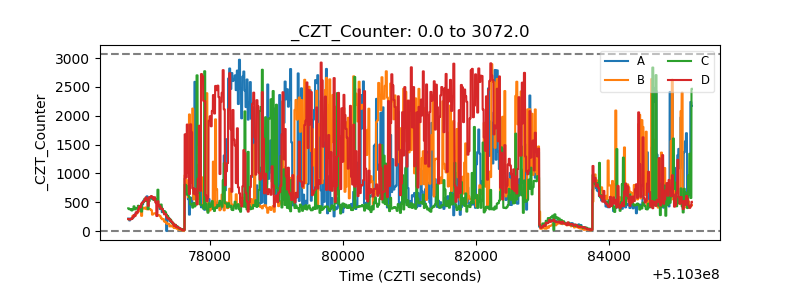 |
| +2.5 Volts monitor | 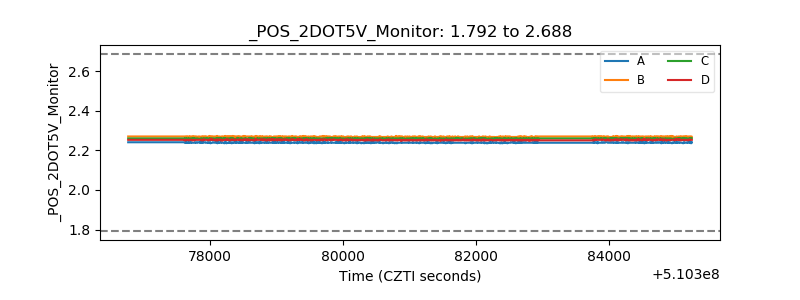 |
| +5 Volts monitor | 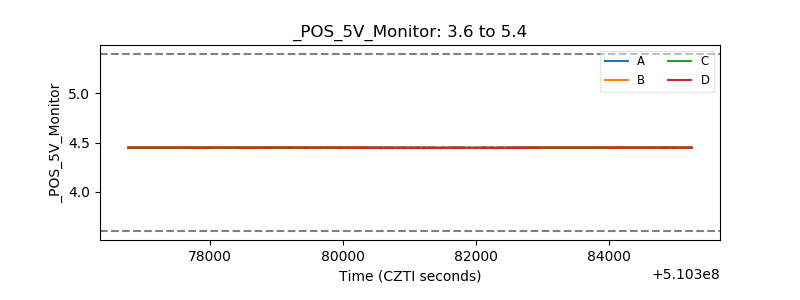 |
| _ROLL_ROT | 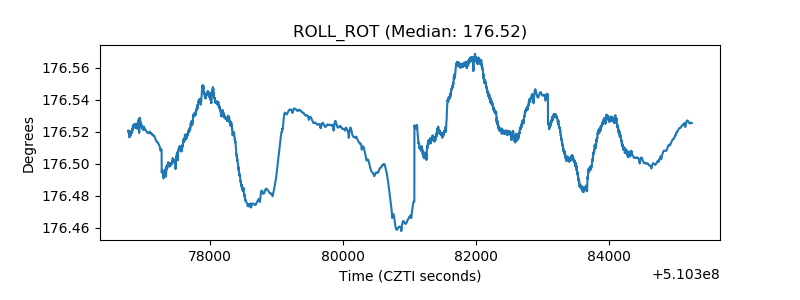 |
| _Roll_DEC | 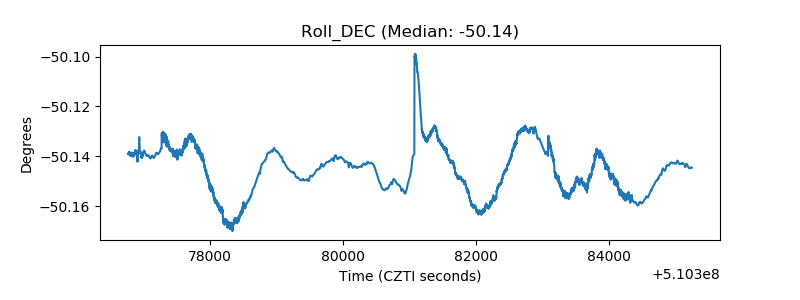 |
| _Roll_RA |  |
| Veto Counter |  |