| Param | Original file | Final file |
|---|---|---|
| Filename | modeM0/AS1A14_060T01_9000006556_56453cztM0_level2.fits | modeM0/AS1A14_060T01_9000006556_56453cztM0_level2_quad_clean.evt |
| Size (bytes) | 876,778,560 | 102,265,920 |
| Size | 836.2 MB | 97.5 MB |
| Events in quadrant A | 12,651,916 | 454,607 |
| Events in quadrant B | 6,900,019 | 745,688 |
| Events in quadrant C | 4,498,721 | 715,562 |
| Events in quadrant D | 7,784,866 | 623,059 |
| Mode M0 | |||
|---|---|---|---|
| Quadrant | BADHDUFLAG | Total packets | Discarded packets |
| A | 0 | 42867 | 1 |
| B | 0 | 25797 | 1 |
| C | 0 | 18802 | 1 |
| D | 0 | 28622 | 1 |
| Mode SS | |||
|---|---|---|---|
| Quadrant | BADHDUFLAG | Total packets | Discarded packets |
| A | 0 | 160 | 0 |
| B | 0 | 160 | 0 |
| C | 0 | 160 | 0 |
| D | 0 | 160 | 0 |
| Quadrant | Total seconds | Saturated seconds | Saturation percentage |
|---|---|---|---|
| A | 8016 | 3348 | 41.766467% |
| B | 8017 | 912 | 11.375826% |
| C | 8017 | 226 | 2.819010% |
| D | 8017 | 790 | 9.854060% |
Noise dominated data is calculated using 1-second bins in cleaned event files. If a bin has >2000 counts, and if more than 50% of those come from <1% of pixels, then it is considered to be noise-dominated and hence unusable.
| Quadrant | # 1 sec bins | Bins with >0 counts | Bins with >2000 counts | High rate bins dominated by noise | Noise dominated (total time) | Noise dominated (detector-on time) | Marked lightcurve |
|---|---|---|---|---|---|---|---|
| A | 8016 | 8016 | 3188 | 3188 | 39.77% | 39.77% |  |
| B | 8017 | 8017 | 475 | 475 | 5.92% | 5.92% |  |
| C | 8017 | 8017 | 90 | 90 | 1.12% | 1.12% |  |
| D | 8017 | 8017 | 857 | 857 | 10.69% | 10.69% | 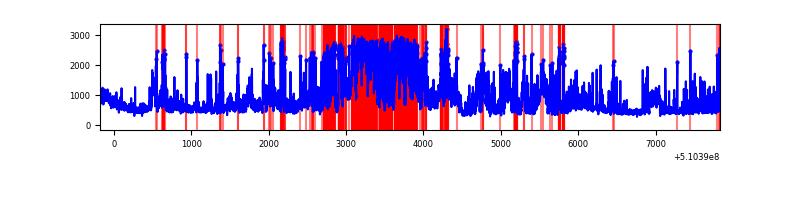 |
Top three noisy pixels from each quadrant. If the there are fewer than three noisy pixels in the level2.evt file, extra rows are filled as -1
| Pixel properties | Quadrant properties | ||||||
|---|---|---|---|---|---|---|---|
| Quadrant | DetID | PixID | Counts | Sigma | Mean | Median | Sigma |
| A | 12 | 3 | 7697822 | 46590.12 | 668 | 650 | 165.2 |
| A | 12 | 194 | 974598 | 5895.2 | 668 | 650 | 165.2 |
| A | 3 | 14 | 824742 | 4988.14 | 668 | 650 | 165.2 |
| B | 5 | 172 | 1685419 | 9172.83 | 853 | 823 | 183.7 |
| B | 4 | 206 | 1474381 | 8023.71 | 853 | 823 | 183.7 |
| B | 0 | 63 | 71526 | 384.99 | 853 | 823 | 183.7 |
| C | 12 | 254 | 505208 | 2134.98 | 865 | 859 | 236.2 |
| C | 1 | 16 | 271265 | 1144.67 | 865 | 859 | 236.2 |
| C | 6 | 223 | 122795 | 516.17 | 865 | 859 | 236.2 |
| D | 5 | 113 | 3503198 | 14867.38 | 842 | 806 | 235.6 |
| D | 2 | 249 | 389649 | 1650.61 | 842 | 806 | 235.6 |
| D | 2 | 31 | 130331 | 549.82 | 842 | 806 | 235.6 |
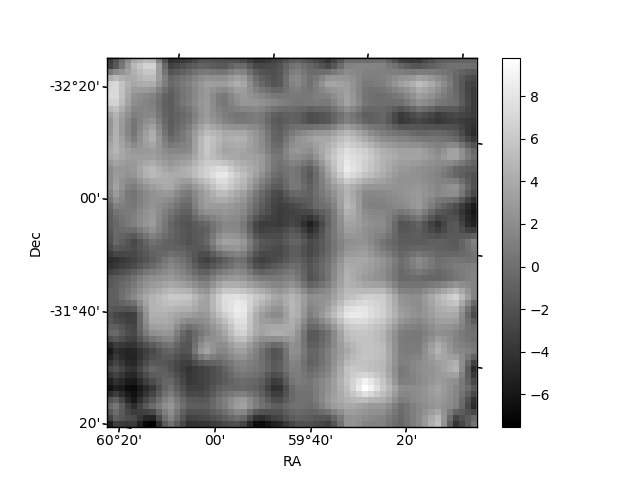
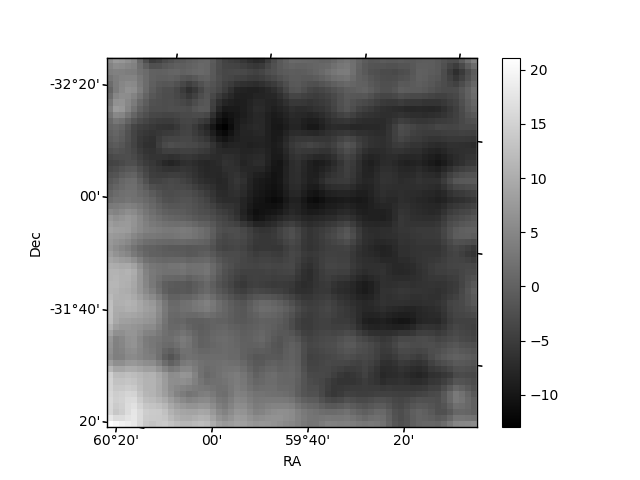
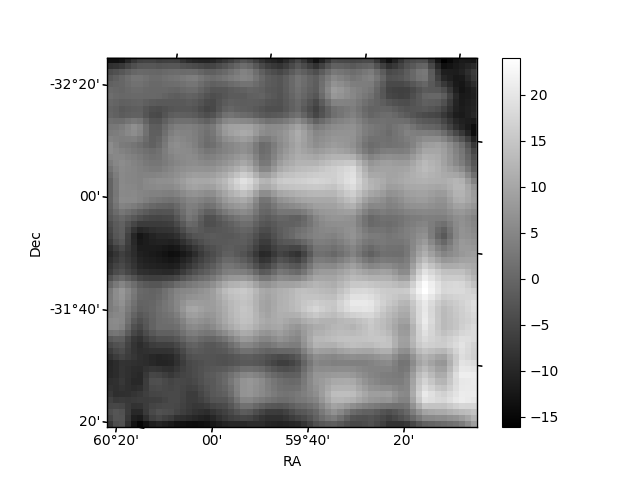
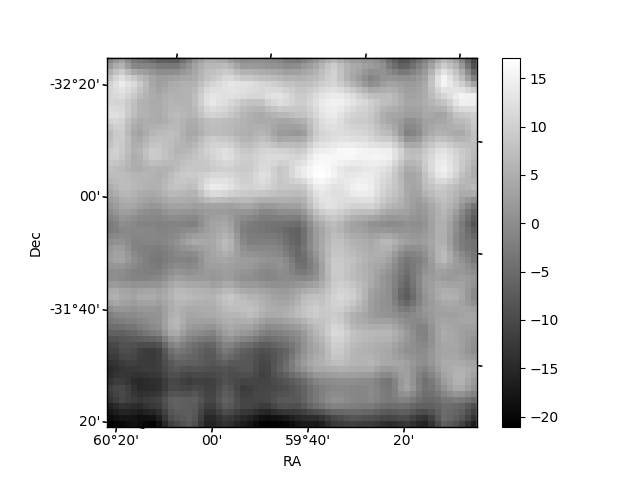
Histogram calculated using DETX and DETY for each event in the final _common_clean file
| Quadrant A | 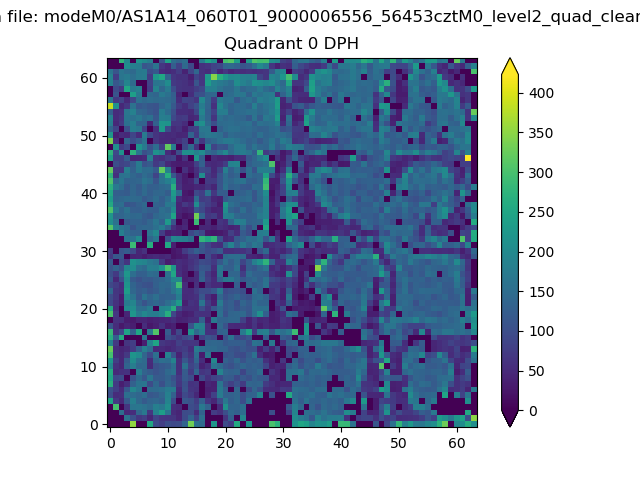 |
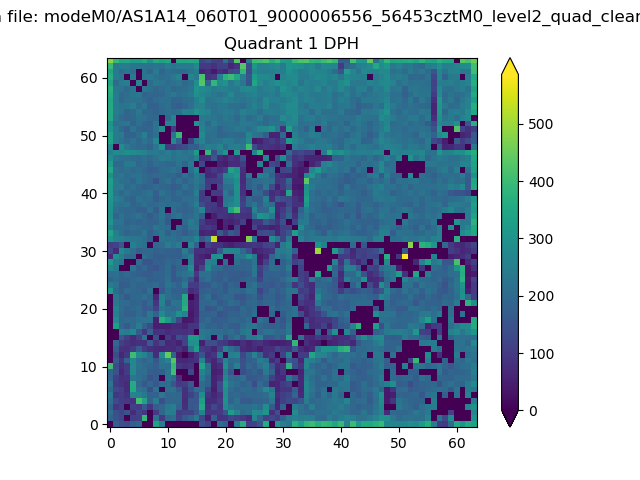 |
Quadrant B |
|---|---|---|---|
| Quadrant D | 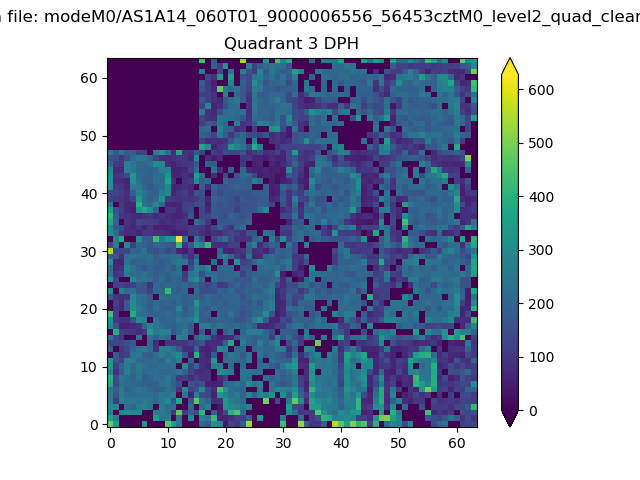 |
 |
Quadrant C |
| Plot type | Count rate plots | Images |
|---|---|---|
| Comparison with Poisson distribution Blue bars denote a histogram of data divided into 1 sec bins. Red curve is a Poisson curve with rate = median count rate of data. |
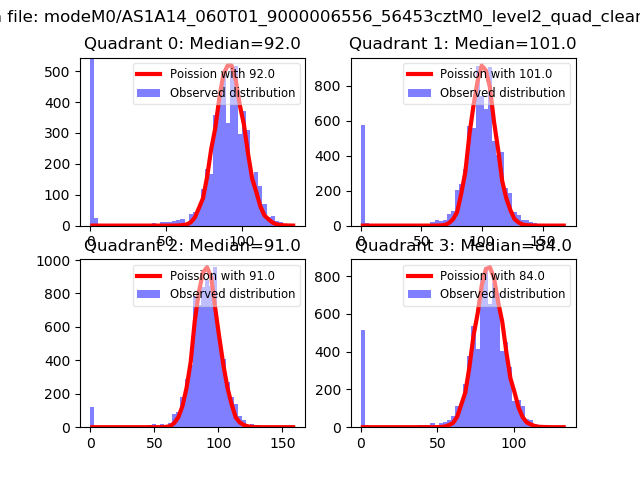 |
 |
| Quadrant-wise count rates Data is divided into 100 sec bins |
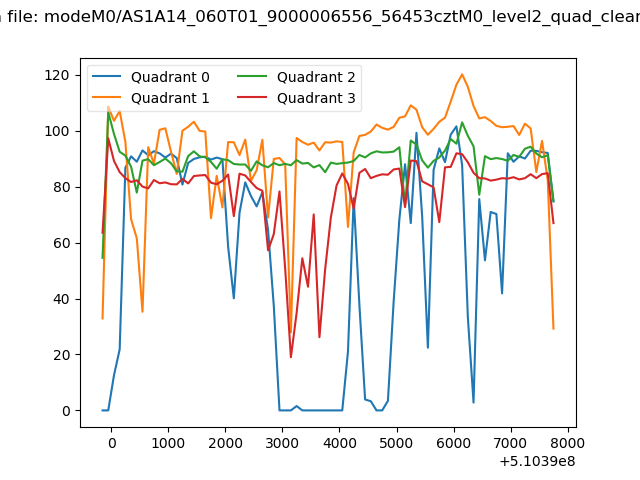 |
|
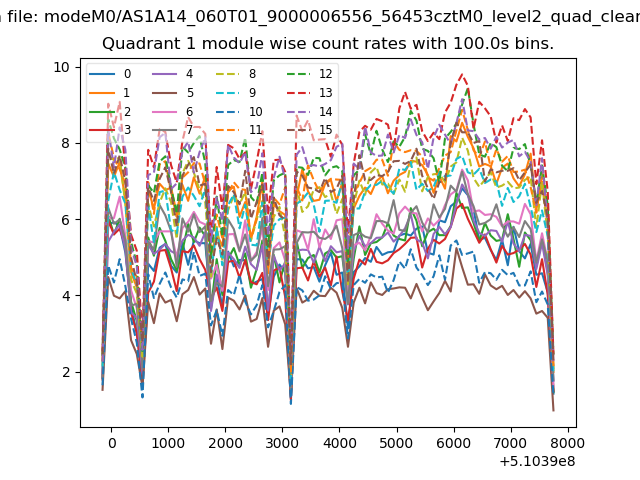
| Module-wise count rates for Quadrant A Data is divided into 100 sec bins |
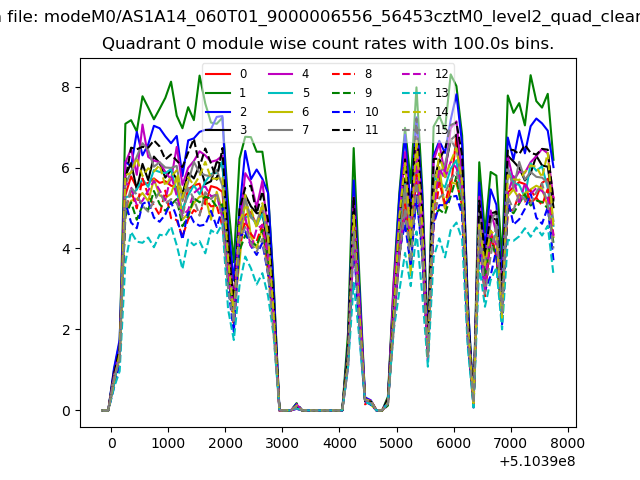 |
 |
| Module-wise count rates for Quadrant B Data is divided into 100 sec bins |
 |
 |
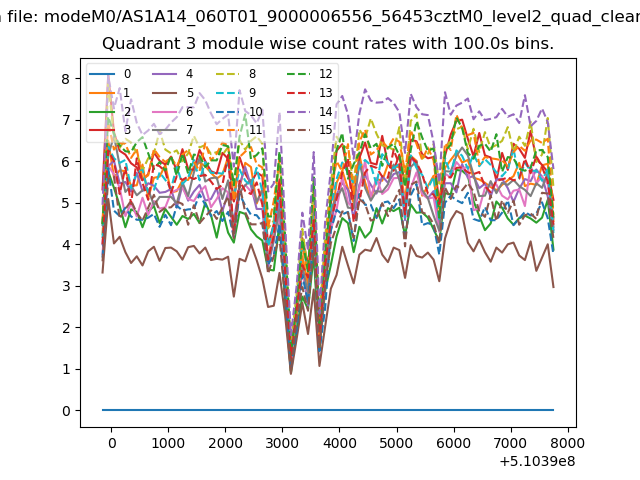
| Module-wise count rates for Quadrant C Data is divided into 100 sec bins |
 |
 |
| Module-wise count rates for Quadrant D Data is divided into 100 sec bins |
 |
 |
| Parameter | Plot |
|---|---|
| CZT HV Monitor | 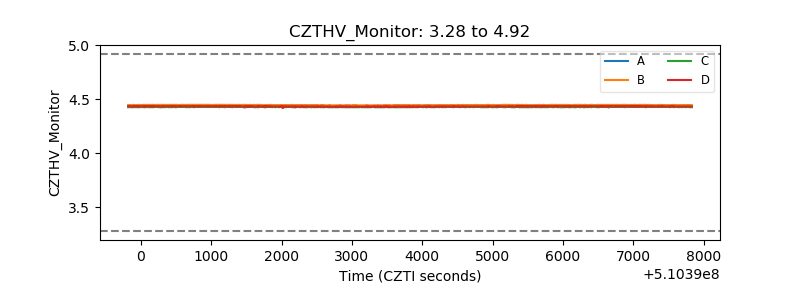 |
| D_VDD | 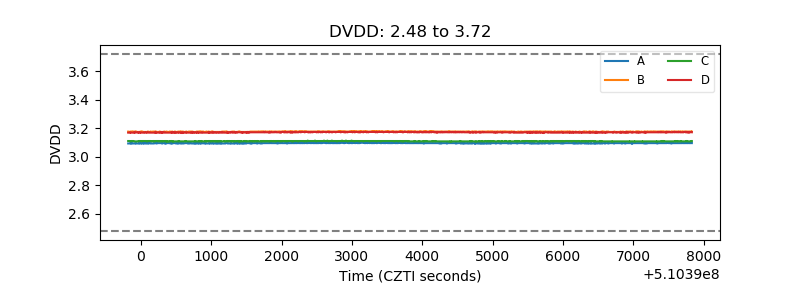 |
| Temperature 1 | 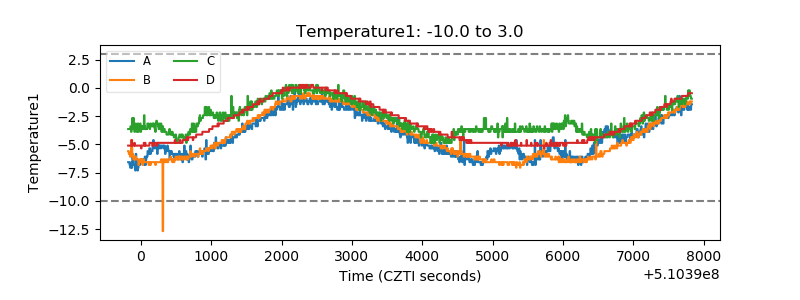 |
| Veto HV Monitor |  |
| Veto LLD |  |
| Alpha Counter | 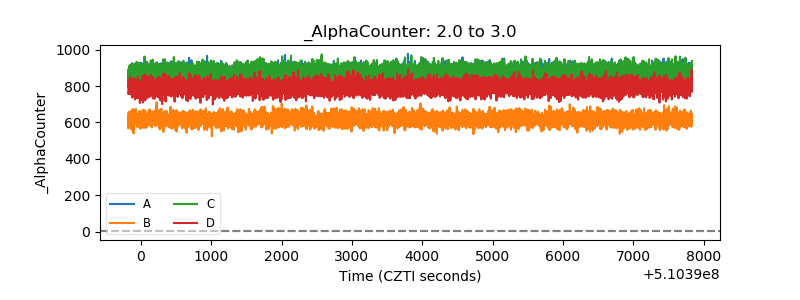 |
| _CPM_Rate | 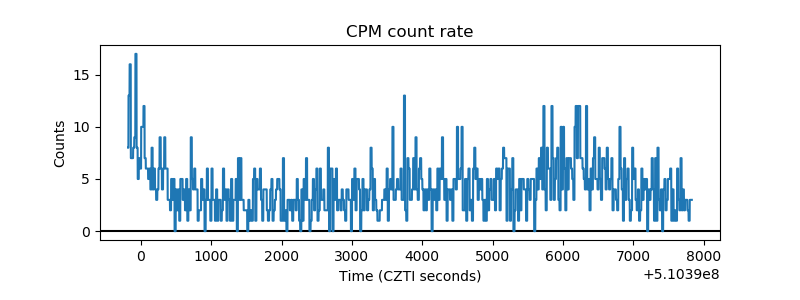 |
| CZT Counter |  |
| +2.5 Volts monitor |  |
| +5 Volts monitor |  |
| _ROLL_ROT |  |
| _Roll_DEC |  |
| _Roll_RA |  |
| Veto Counter |  |