| Param | Original file | Final file |
|---|---|---|
| Filename | modeM0/AS1A14_060T01_9000006556_56454cztM0_level2.fits | modeM0/AS1A14_060T01_9000006556_56454cztM0_level2_quad_clean.evt |
| Size (bytes) | 567,685,440 | 101,053,440 |
| Size | 541.4 MB | 96.4 MB |
| Events in quadrant A | 4,307,808 | 650,003 |
| Events in quadrant B | 5,891,562 | 670,571 |
| Events in quadrant C | 4,716,918 | 637,721 |
| Events in quadrant D | 5,541,663 | 601,912 |
| Mode M0 | |||
|---|---|---|---|
| Quadrant | BADHDUFLAG | Total packets | Discarded packets |
| A | 0 | 17748 | 2 |
| B | 0 | 22347 | 0 |
| C | 0 | 18977 | 0 |
| D | 0 | 21364 | 1 |
| Mode SS | |||
|---|---|---|---|
| Quadrant | BADHDUFLAG | Total packets | Discarded packets |
| A | 0 | 144 | 0 |
| B | 0 | 144 | 0 |
| C | 0 | 144 | 0 |
| D | 0 | 144 | 0 |
| Quadrant | Total seconds | Saturated seconds | Saturation percentage |
|---|---|---|---|
| A | 7171 | 270 | 3.765165% |
| B | 7173 | 623 | 8.685348% |
| C | 7173 | 194 | 2.704587% |
| D | 7172 | 116 | 1.617401% |
Noise dominated data is calculated using 1-second bins in cleaned event files. If a bin has >2000 counts, and if more than 50% of those come from <1% of pixels, then it is considered to be noise-dominated and hence unusable.
| Quadrant | # 1 sec bins | Bins with >0 counts | Bins with >2000 counts | High rate bins dominated by noise | Noise dominated (total time) | Noise dominated (detector-on time) | Marked lightcurve |
|---|---|---|---|---|---|---|---|
| A | 7172 | 7172 | 240 | 240 | 3.35% | 3.35% |  |
| B | 7173 | 7173 | 414 | 414 | 5.77% | 5.77% | 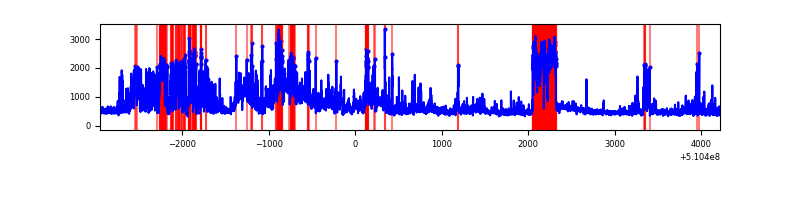 |
| C | 7173 | 7173 | 175 | 175 | 2.44% | 2.44% |  |
| D | 7172 | 7172 | 139 | 139 | 1.94% | 1.94% |  |
Top three noisy pixels from each quadrant. If the there are fewer than three noisy pixels in the level2.evt file, extra rows are filled as -1
| Pixel properties | Quadrant properties | ||||||
|---|---|---|---|---|---|---|---|
| Quadrant | DetID | PixID | Counts | Sigma | Mean | Median | Sigma |
| A | 4 | 206 | 695082 | 3671.93 | 763 | 744 | 189.1 |
| A | 12 | 3 | 149170 | 784.93 | 763 | 744 | 189.1 |
| A | 8 | 249 | 119440 | 627.71 | 763 | 744 | 189.1 |
| B | 5 | 172 | 1580331 | 9952.33 | 734 | 709 | 158.7 |
| B | 4 | 206 | 995429 | 6267.18 | 734 | 709 | 158.7 |
| B | 8 | 128 | 164481 | 1031.84 | 734 | 709 | 158.7 |
| C | 12 | 254 | 752371 | 3700.61 | 745 | 737 | 203.1 |
| C | 1 | 16 | 686866 | 3378.1 | 745 | 737 | 203.1 |
| C | 12 | 252 | 236818 | 1162.32 | 745 | 737 | 203.1 |
| D | 5 | 113 | 1533661 | 7290.04 | 746 | 714 | 210.3 |
| D | 9 | 49 | 299533 | 1421.06 | 746 | 714 | 210.3 |
| D | 3 | 12 | 219924 | 1042.47 | 746 | 714 | 210.3 |
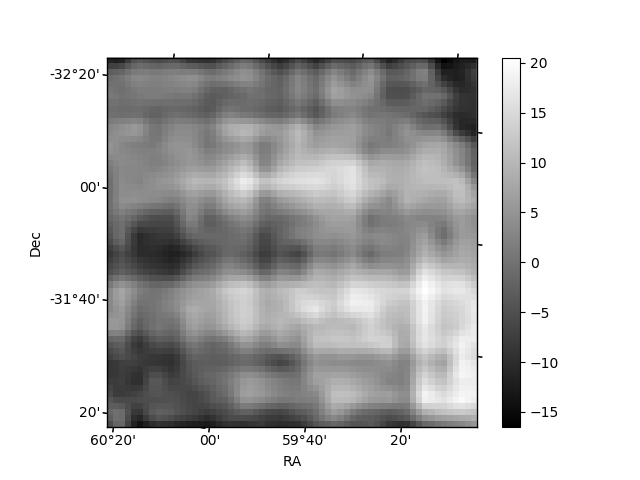
Histogram calculated using DETX and DETY for each event in the final _common_clean file
| Quadrant A | 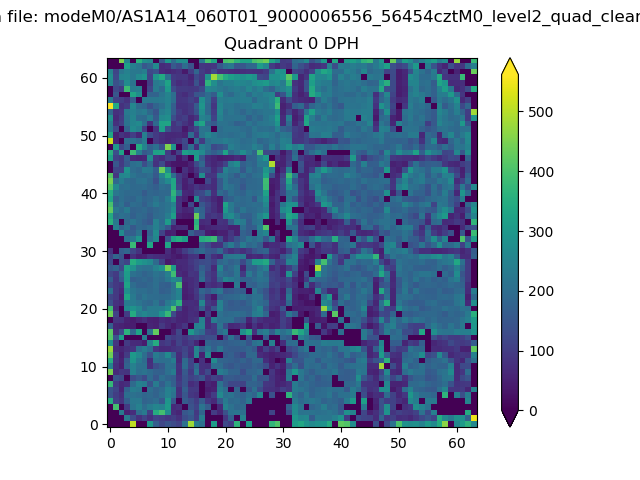 |
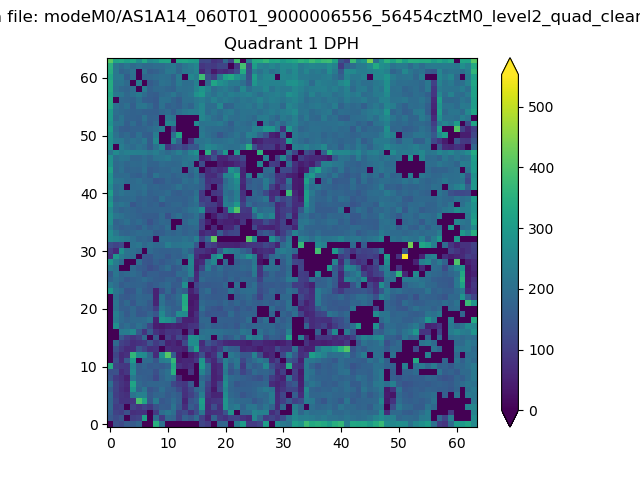 |
Quadrant B |
|---|---|---|---|
| Quadrant D | 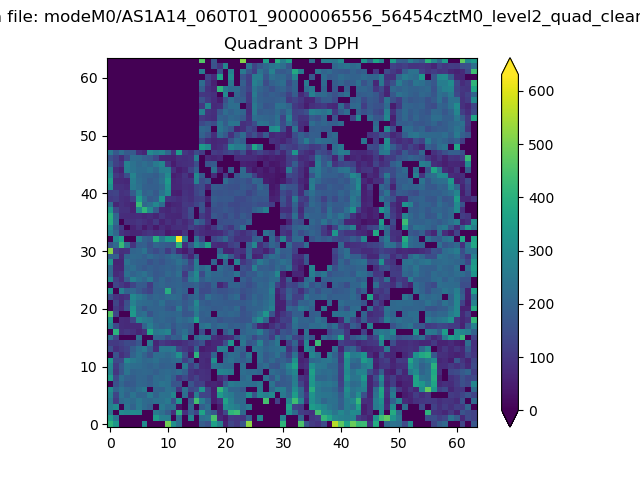 |
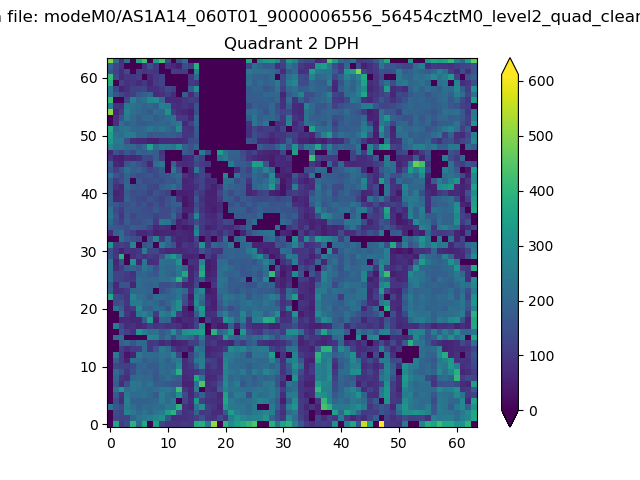 |
Quadrant C |
| Plot type | Count rate plots | Images |
|---|---|---|
| Comparison with Poisson distribution Blue bars denote a histogram of data divided into 1 sec bins. Red curve is a Poisson curve with rate = median count rate of data. |
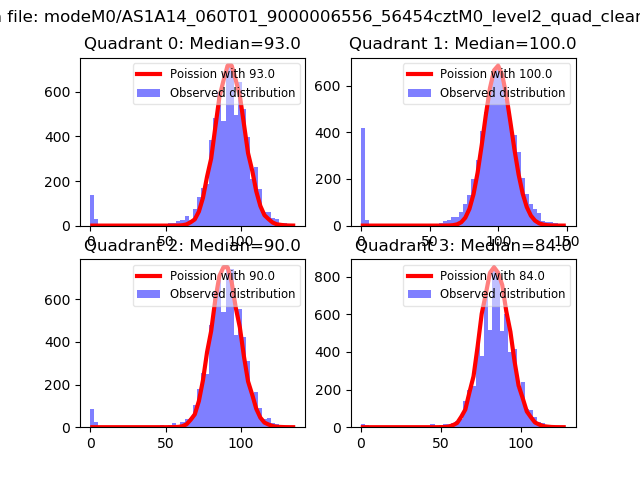 |
 |
| Quadrant-wise count rates Data is divided into 100 sec bins |
 |
|
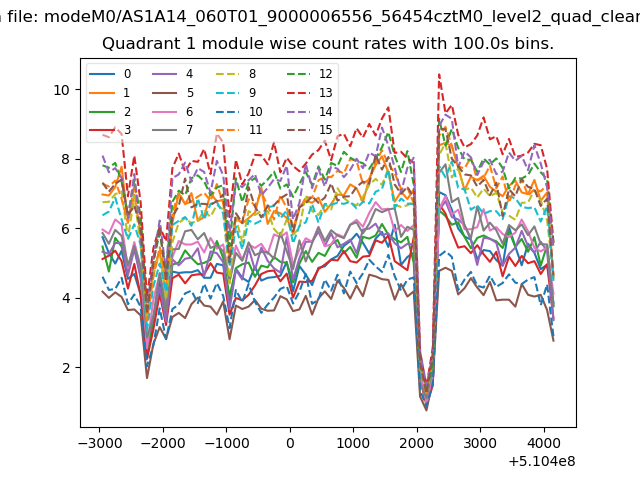
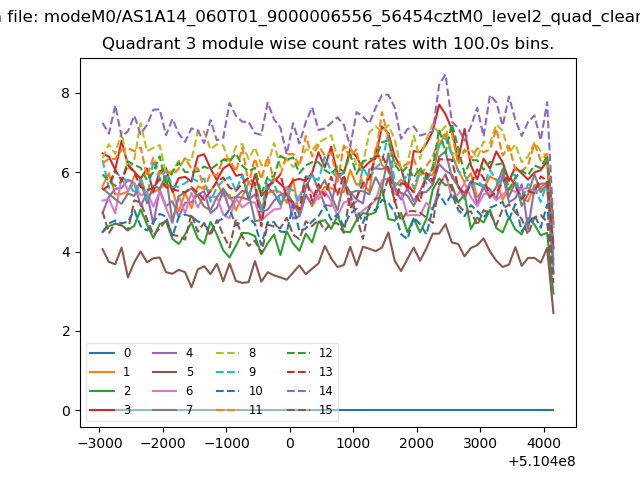
| Module-wise count rates for Quadrant A Data is divided into 100 sec bins |
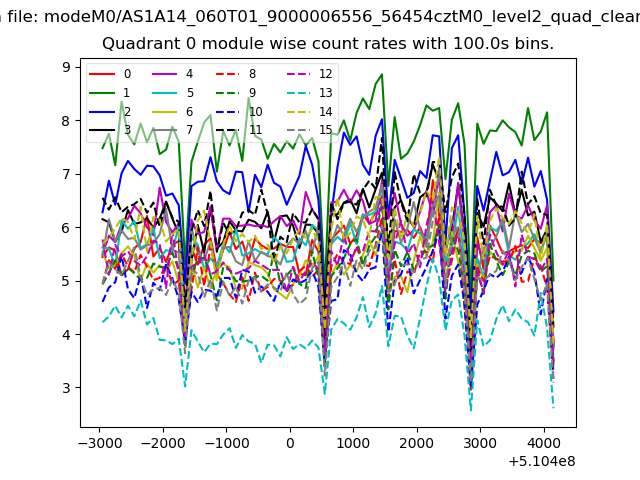 |
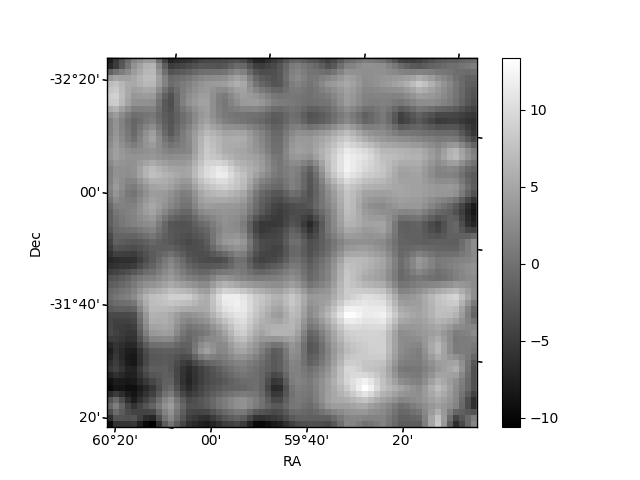 |
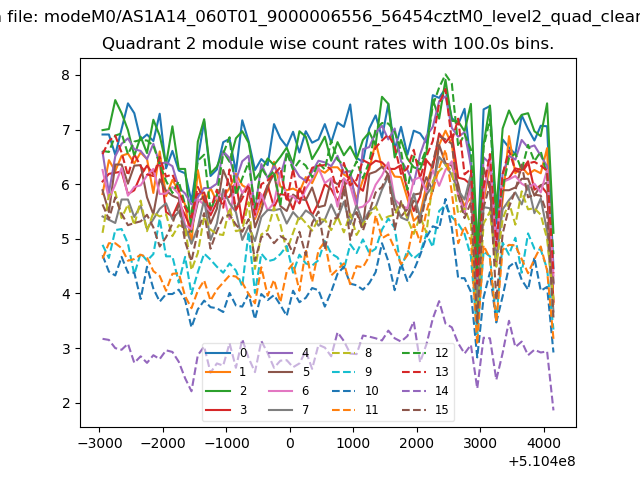
| Module-wise count rates for Quadrant B Data is divided into 100 sec bins |
 |
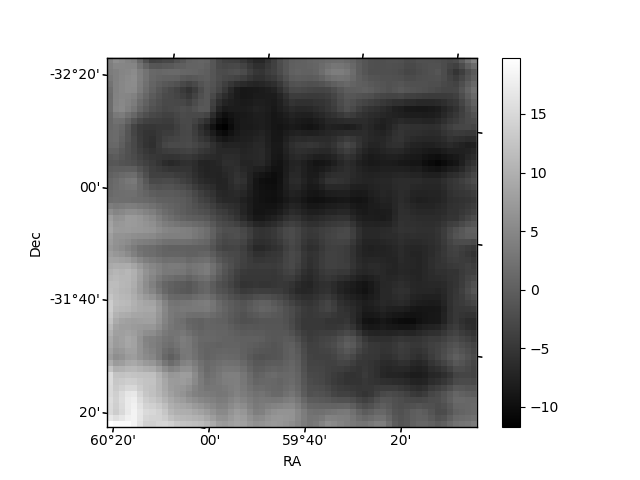 |
| Module-wise count rates for Quadrant C Data is divided into 100 sec bins |
 |
 |
| Module-wise count rates for Quadrant D Data is divided into 100 sec bins |
 |
 |
| Parameter | Plot |
|---|---|
| CZT HV Monitor | 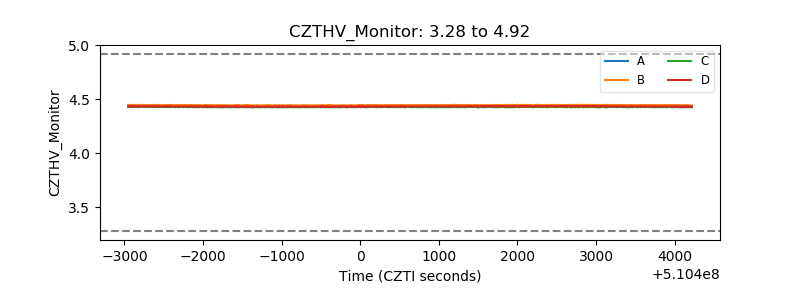 |
| D_VDD |  |
| Temperature 1 | 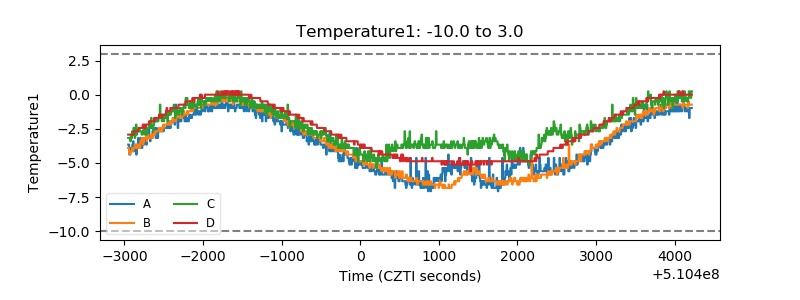 |
| Veto HV Monitor |  |
| Veto LLD |  |
| Alpha Counter | 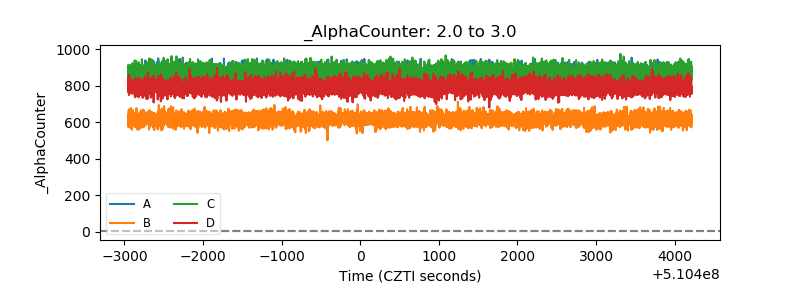 |
| _CPM_Rate | 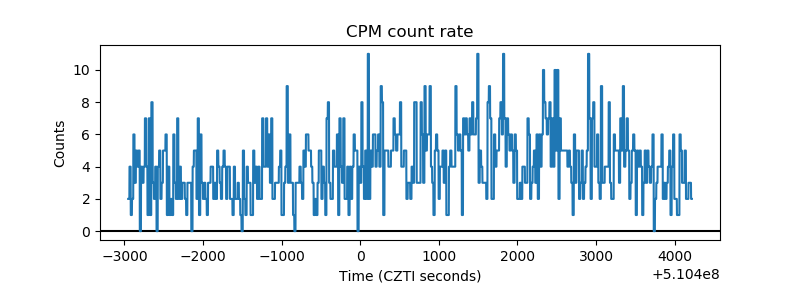 |
| CZT Counter | 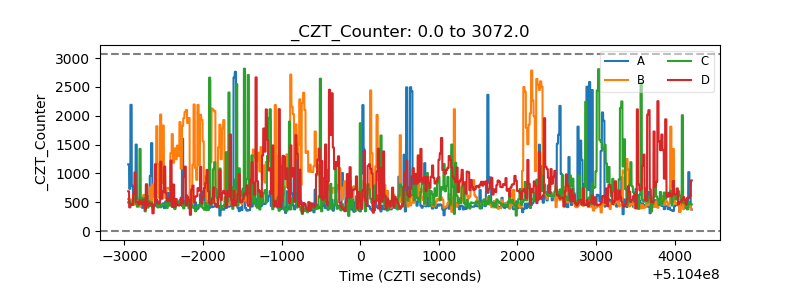 |
| +2.5 Volts monitor | 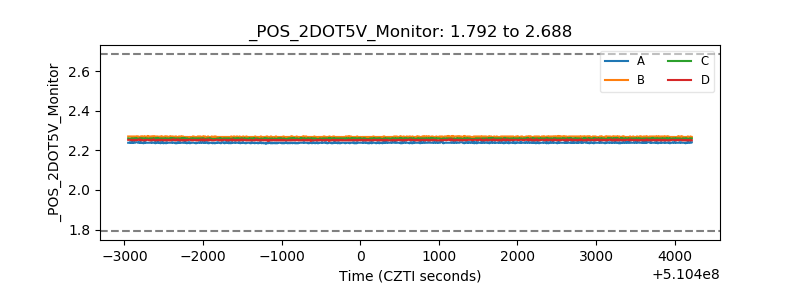 |
| +5 Volts monitor | 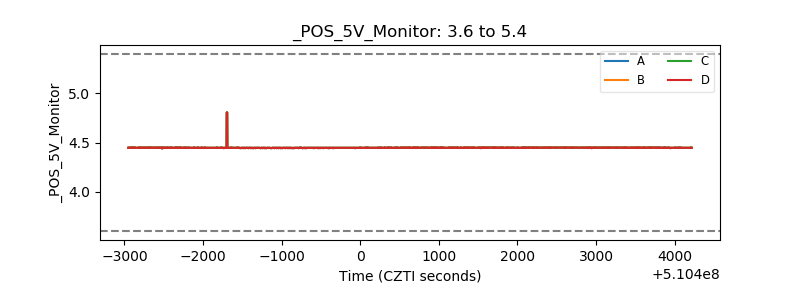 |
| _ROLL_ROT |  |
| _Roll_DEC |  |
| _Roll_RA |  |
| Veto Counter |  |