| Param | Original file | Final file |
|---|---|---|
| Filename | modeM0/AS1A14_060T01_9000006556_56457cztM0_level2.fits | modeM0/AS1A14_060T01_9000006556_56457cztM0_level2_quad_clean.evt |
| Size (bytes) | 1,449,711,360 | 188,781,120 |
| Size | 1.4 GB | 180.0 MB |
| Events in quadrant A | 12,443,714 | 1,202,108 |
| Events in quadrant B | 18,140,233 | 1,014,031 |
| Events in quadrant C | 8,219,307 | 1,316,644 |
| Events in quadrant D | 13,714,455 | 1,157,729 |
| Mode M0 | |||
|---|---|---|---|
| Quadrant | BADHDUFLAG | Total packets | Discarded packets |
| A | 0 | 47453 | 3 |
| B | 0 | 63926 | 4 |
| C | 0 | 34956 | 3 |
| D | 0 | 51049 | 3 |
| Mode M9 | |||
|---|---|---|---|
| Quadrant | BADHDUFLAG | Total packets | Discarded packets |
| A | 0 | 3 | 0 |
| B | 0 | 3 | 0 |
| C | 0 | 3 | 0 |
| D | 0 | 3 | 0 |
| Mode SS | |||
|---|---|---|---|
| Quadrant | BADHDUFLAG | Total packets | Discarded packets |
| A | 0 | 302 | 0 |
| B | 0 | 302 | 0 |
| C | 0 | 302 | 0 |
| D | 0 | 302 | 0 |
| Quadrant | Total seconds | Saturated seconds | Saturation percentage |
|---|---|---|---|
| A | 14833 | 1677 | 11.305872% |
| B | 14833 | 4837 | 32.609722% |
| C | 14834 | 212 | 1.429149% |
| D | 14833 | 1122 | 7.564215% |
Noise dominated data is calculated using 1-second bins in cleaned event files. If a bin has >2000 counts, and if more than 50% of those come from <1% of pixels, then it is considered to be noise-dominated and hence unusable.
| Quadrant | # 1 sec bins | Bins with >0 counts | Bins with >2000 counts | High rate bins dominated by noise | Noise dominated (total time) | Noise dominated (detector-on time) | Marked lightcurve |
|---|---|---|---|---|---|---|---|
| A | 15248 | 14836 | 1570 | 1570 | 10.30% | 10.58% |  |
| B | 15249 | 14837 | 4023 | 4023 | 26.38% | 27.11% |  |
| C | 15249 | 14837 | 167 | 167 | 1.10% | 1.13% |  |
| D | 15248 | 14836 | 1193 | 1193 | 7.82% | 8.04% |  |
Top three noisy pixels from each quadrant. If the there are fewer than three noisy pixels in the level2.evt file, extra rows are filled as -1
| Pixel properties | Quadrant properties | ||||||
|---|---|---|---|---|---|---|---|
| Quadrant | DetID | PixID | Counts | Sigma | Mean | Median | Sigma |
| A | 4 | 206 | 2189818 | 5736.04 | 1523 | 1480 | 381.5 |
| A | 12 | 3 | 1869808 | 4897.23 | 1523 | 1480 | 381.5 |
| A | 4 | 159 | 808105 | 2114.31 | 1523 | 1480 | 381.5 |
| B | 5 | 172 | 10962245 | 38031.08 | 1341 | 1288 | 288.2 |
| B | 4 | 206 | 1088891 | 3773.64 | 1341 | 1288 | 288.2 |
| B | 8 | 128 | 204229 | 704.14 | 1341 | 1288 | 288.2 |
| C | 1 | 16 | 568186 | 1354.55 | 1535 | 1524 | 418.3 |
| C | 12 | 254 | 498182 | 1187.21 | 1535 | 1524 | 418.3 |
| C | 12 | 252 | 409186 | 974.47 | 1535 | 1524 | 418.3 |
| D | 9 | 49 | 2298356 | 5440.1 | 1492 | 1426 | 422.2 |
| D | 8 | 129 | 1622082 | 3838.4 | 1492 | 1426 | 422.2 |
| D | 2 | 249 | 1156377 | 2735.41 | 1492 | 1426 | 422.2 |
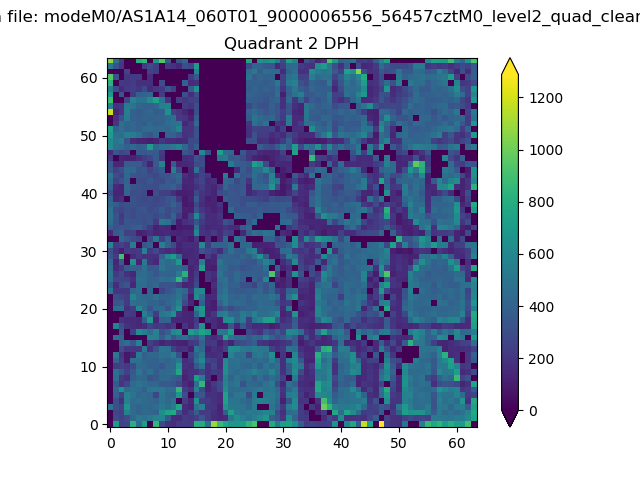
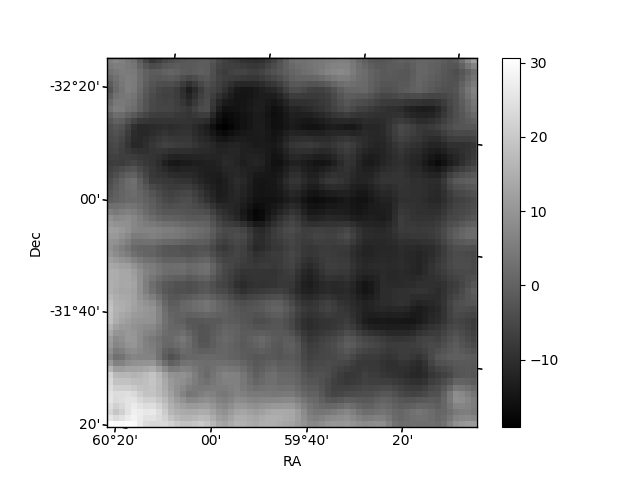
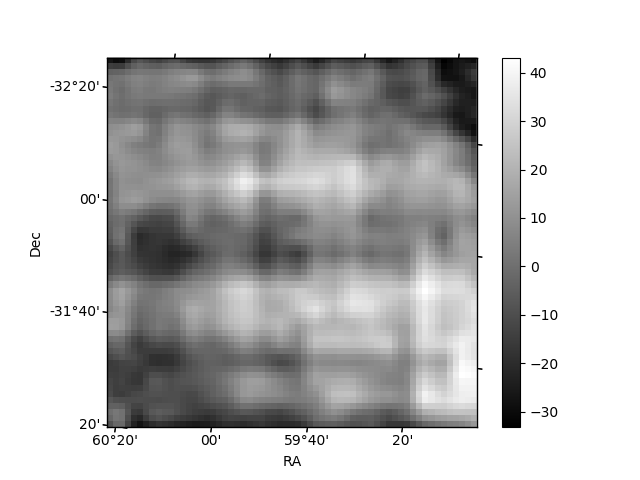
Histogram calculated using DETX and DETY for each event in the final _common_clean file
| Quadrant A | 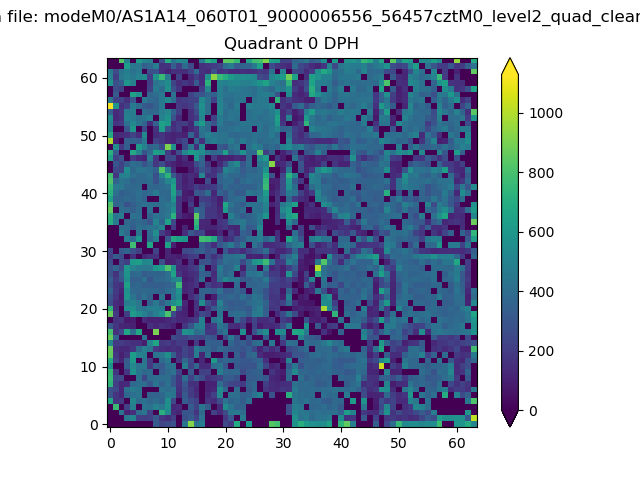 |
 |
Quadrant B |
|---|---|---|---|
| Quadrant D |  |
 |
Quadrant C |
| Plot type | Count rate plots | Images |
|---|---|---|
| Comparison with Poisson distribution Blue bars denote a histogram of data divided into 1 sec bins. Red curve is a Poisson curve with rate = median count rate of data. |
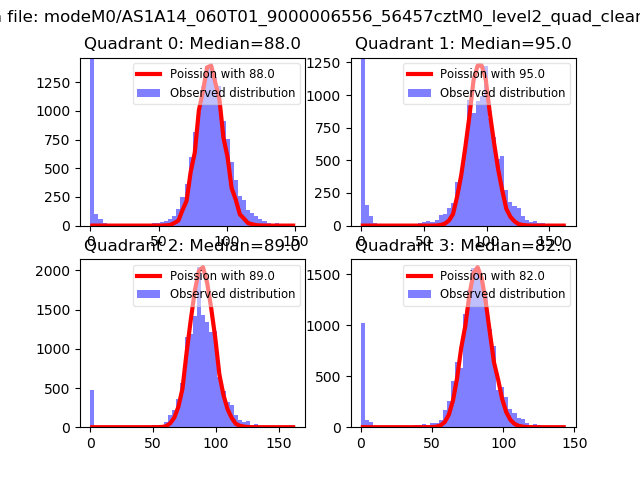 |
 |
| Quadrant-wise count rates Data is divided into 100 sec bins |
 |
|
| Module-wise count rates for Quadrant A Data is divided into 100 sec bins |
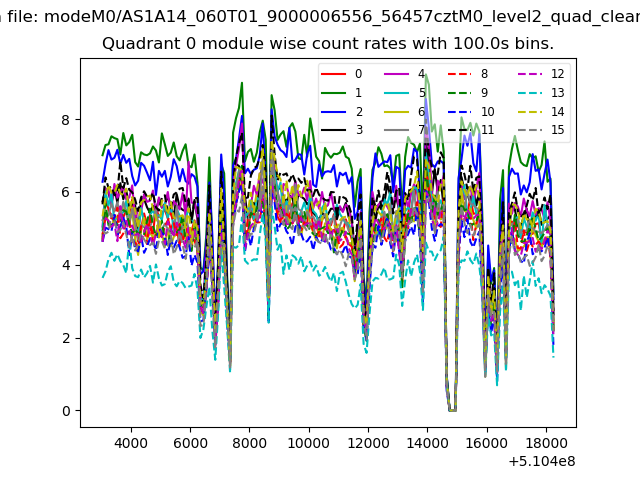 |
 |
| Module-wise count rates for Quadrant B Data is divided into 100 sec bins |
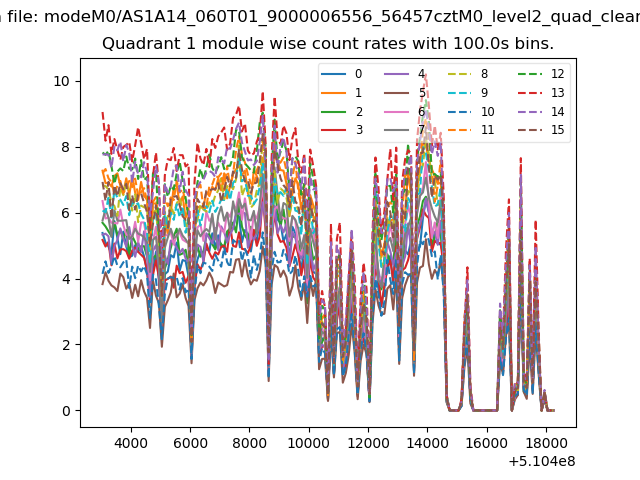 |
 |
| Module-wise count rates for Quadrant C Data is divided into 100 sec bins |
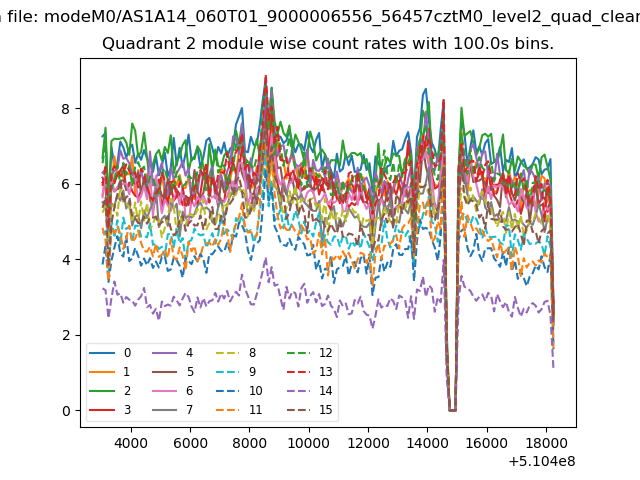 |
 |
| Module-wise count rates for Quadrant D Data is divided into 100 sec bins |
 |
 |
| Parameter | Plot |
|---|---|
| CZT HV Monitor | 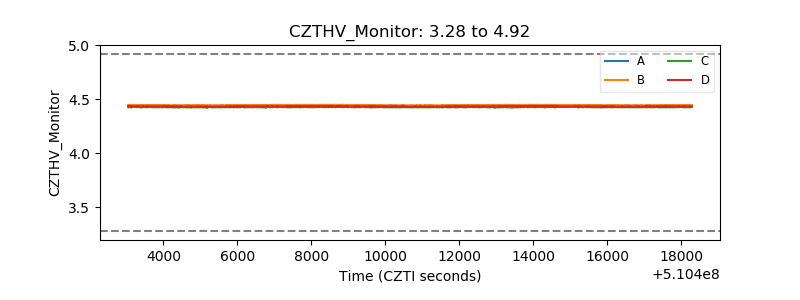 |
| D_VDD | 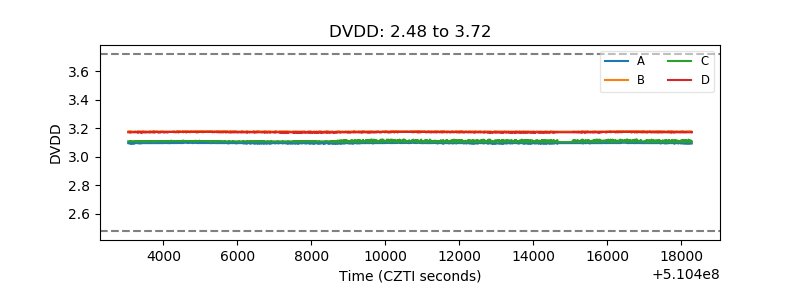 |
| Temperature 1 | 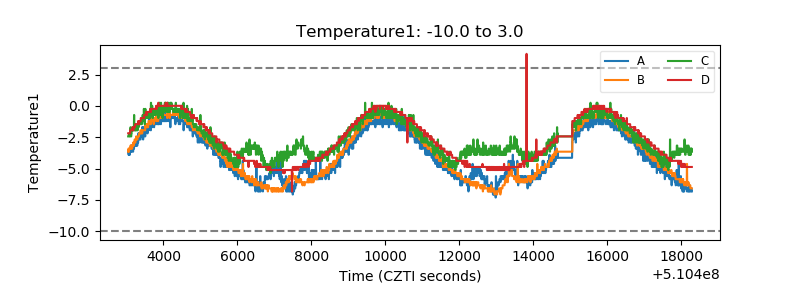 |
| Veto HV Monitor |  |
| Veto LLD |  |
| Alpha Counter | 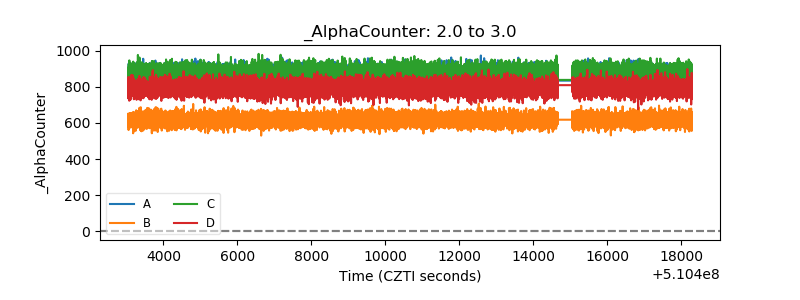 |
| _CPM_Rate | 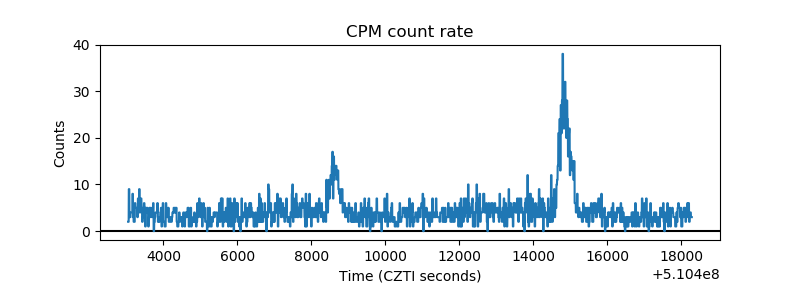 |
| CZT Counter | 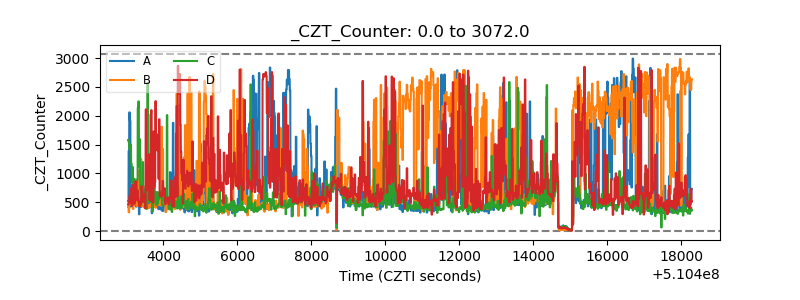 |
| +2.5 Volts monitor | 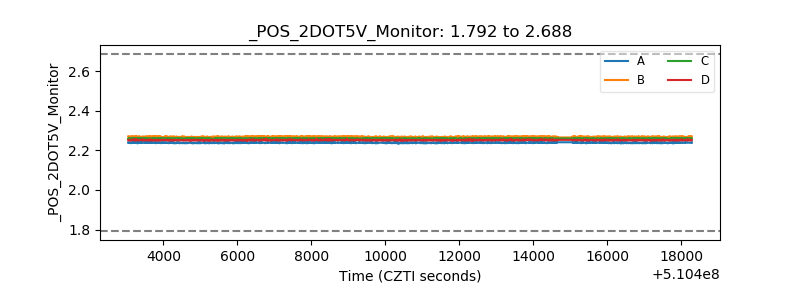 |
| +5 Volts monitor | 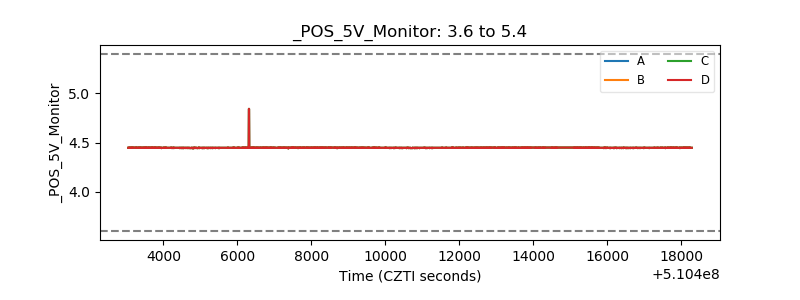 |
| _ROLL_ROT |  |
| _Roll_DEC | 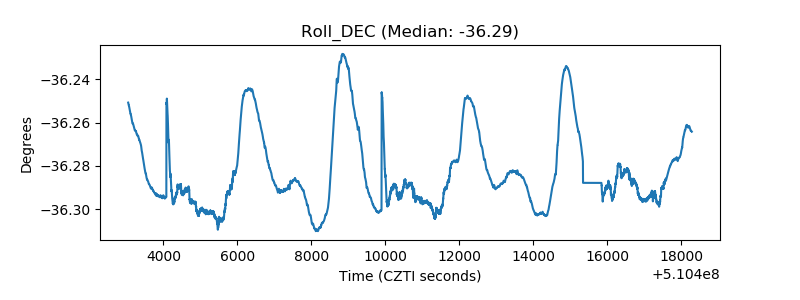 |
| _Roll_RA |  |
| Veto Counter | 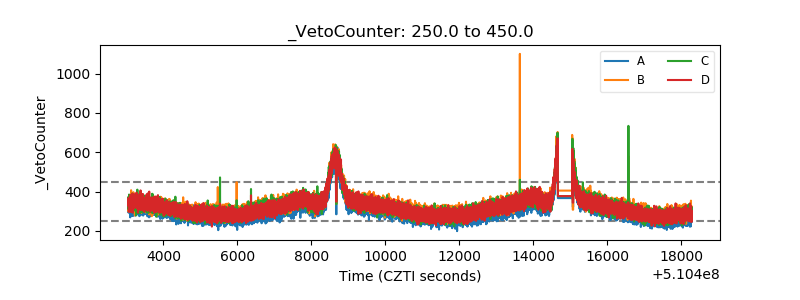 |