| Param | Original file | Final file |
|---|---|---|
| Filename | modeM0/AS1A14_060T01_9000006556_56458cztM0_level2.fits | modeM0/AS1A14_060T01_9000006556_56458cztM0_level2_quad_clean.evt |
| Size (bytes) | 909,273,600 | 124,836,480 |
| Size | 867.2 MB | 119.1 MB |
| Events in quadrant A | 9,961,777 | 707,873 |
| Events in quadrant B | 9,238,327 | 836,590 |
| Events in quadrant C | 6,363,359 | 812,557 |
| Events in quadrant D | 7,366,362 | 769,218 |
| Mode M0 | |||
|---|---|---|---|
| Quadrant | BADHDUFLAG | Total packets | Discarded packets |
| A | 0 | 36019 | 2 |
| B | 0 | 34143 | 2 |
| C | 0 | 25682 | 2 |
| D | 0 | 28444 | 3 |
| Mode M9 | |||
|---|---|---|---|
| Quadrant | BADHDUFLAG | Total packets | Discarded packets |
| A | 0 | 15 | 0 |
| B | 0 | 15 | 0 |
| C | 0 | 15 | 0 |
| D | 0 | 15 | 0 |
| Mode SS | |||
|---|---|---|---|
| Quadrant | BADHDUFLAG | Total packets | Discarded packets |
| A | 0 | 192 | 0 |
| B | 0 | 192 | 0 |
| C | 0 | 192 | 0 |
| D | 0 | 192 | 0 |
| Quadrant | Total seconds | Saturated seconds | Saturation percentage |
|---|---|---|---|
| A | 9419 | 1961 | 20.819620% |
| B | 9420 | 1372 | 14.564756% |
| C | 9420 | 486 | 5.159236% |
| D | 9419 | 406 | 4.310436% |
Noise dominated data is calculated using 1-second bins in cleaned event files. If a bin has >2000 counts, and if more than 50% of those come from <1% of pixels, then it is considered to be noise-dominated and hence unusable.
| Quadrant | # 1 sec bins | Bins with >0 counts | Bins with >2000 counts | High rate bins dominated by noise | Noise dominated (total time) | Noise dominated (detector-on time) | Marked lightcurve |
|---|---|---|---|---|---|---|---|
| A | 10894 | 9421 | 1886 | 1886 | 17.31% | 20.02% |  |
| B | 10895 | 9422 | 844 | 844 | 7.75% | 8.96% |  |
| C | 10895 | 9422 | 469 | 469 | 4.30% | 4.98% |  |
| D | 10894 | 9421 | 435 | 435 | 3.99% | 4.62% |  |
Top three noisy pixels from each quadrant. If the there are fewer than three noisy pixels in the level2.evt file, extra rows are filled as -1
| Pixel properties | Quadrant properties | ||||||
|---|---|---|---|---|---|---|---|
| Quadrant | DetID | PixID | Counts | Sigma | Mean | Median | Sigma |
| A | 12 | 3 | 4717095 | 20505.17 | 927 | 906 | 230.0 |
| A | 12 | 194 | 636277 | 2762.48 | 927 | 906 | 230.0 |
| A | 0 | 8 | 381854 | 1656.3 | 927 | 906 | 230.0 |
| B | 5 | 172 | 4368544 | 21149.99 | 958 | 923 | 206.5 |
| B | 4 | 206 | 426448 | 2060.58 | 958 | 923 | 206.5 |
| B | 0 | 63 | 299401 | 1445.37 | 958 | 923 | 206.5 |
| C | 12 | 254 | 1624868 | 6107.02 | 971 | 961 | 265.9 |
| C | 12 | 252 | 292097 | 1094.87 | 971 | 961 | 265.9 |
| C | 13 | 3 | 262024 | 981.78 | 971 | 961 | 265.9 |
| D | 9 | 49 | 1320526 | 4836.36 | 966 | 922 | 272.9 |
| D | 12 | 4 | 1164123 | 4263.14 | 966 | 922 | 272.9 |
| D | 8 | 129 | 189269 | 690.29 | 966 | 922 | 272.9 |
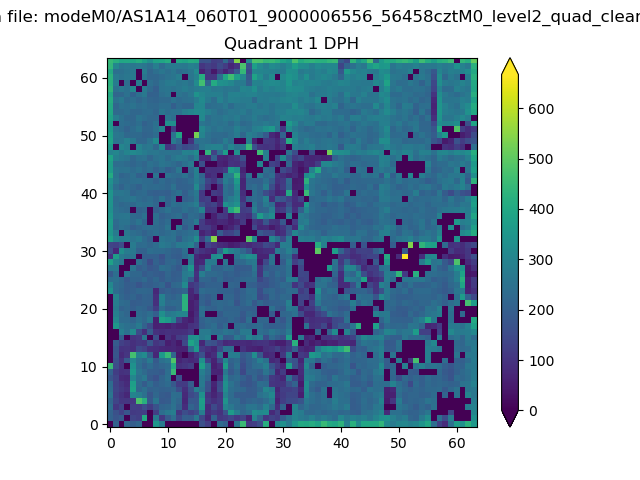
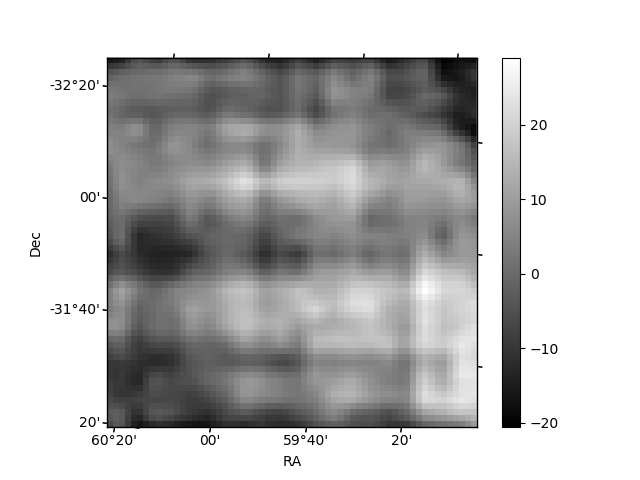
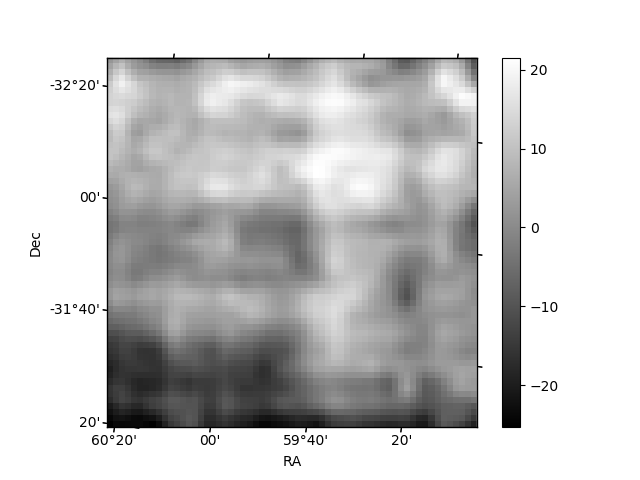
Histogram calculated using DETX and DETY for each event in the final _common_clean file
| Quadrant A |  |
 |
Quadrant B |
|---|---|---|---|
| Quadrant D |  |
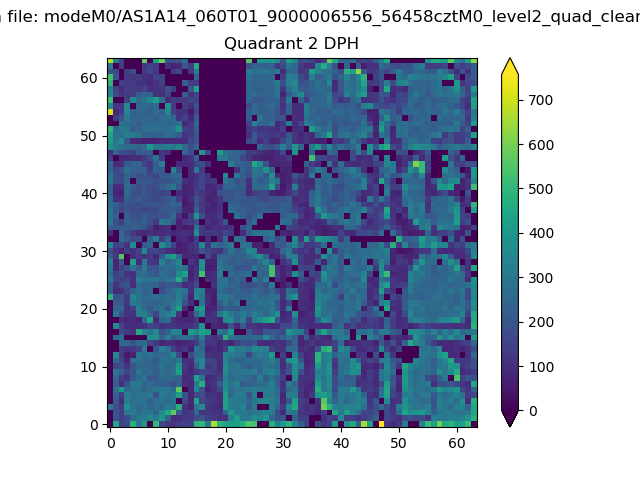 |
Quadrant C |
| Plot type | Count rate plots | Images |
|---|---|---|
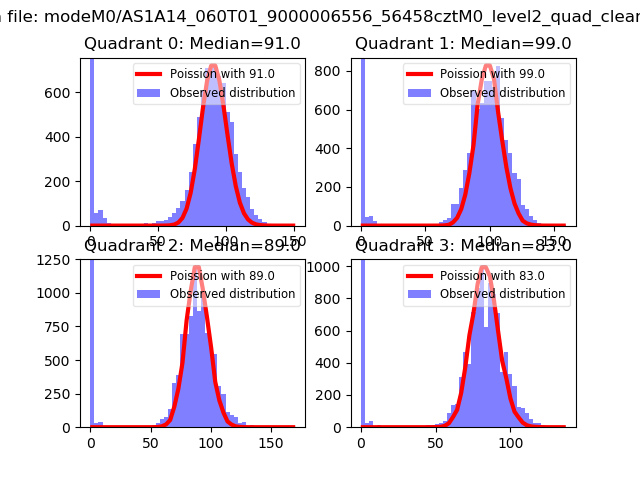
| Comparison with Poisson distribution Blue bars denote a histogram of data divided into 1 sec bins. Red curve is a Poisson curve with rate = median count rate of data. |
 |
 |
| Quadrant-wise count rates Data is divided into 100 sec bins |
 |
|
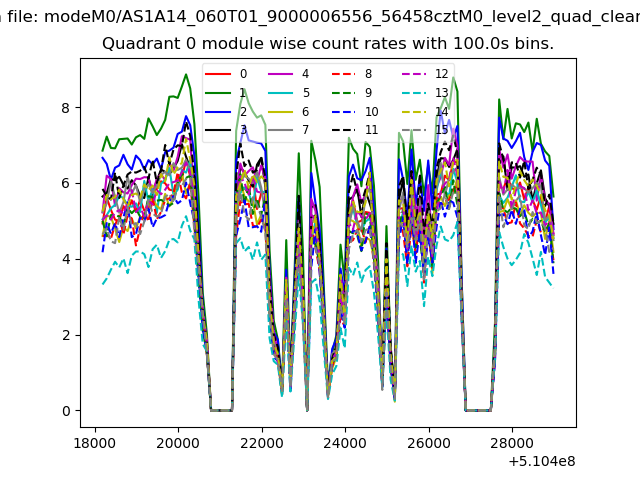
| Module-wise count rates for Quadrant A Data is divided into 100 sec bins |
 |
 |
| Module-wise count rates for Quadrant B Data is divided into 100 sec bins |
 |
 |
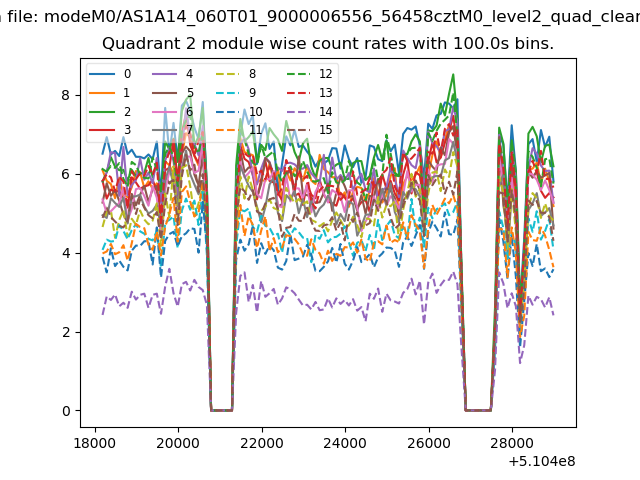
| Module-wise count rates for Quadrant C Data is divided into 100 sec bins |
 |
 |
| Module-wise count rates for Quadrant D Data is divided into 100 sec bins |
 |
 |
| Parameter | Plot |
|---|---|
| CZT HV Monitor | 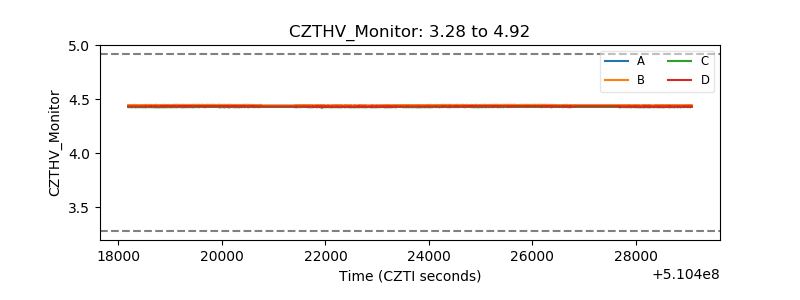 |
| D_VDD |  |
| Temperature 1 | 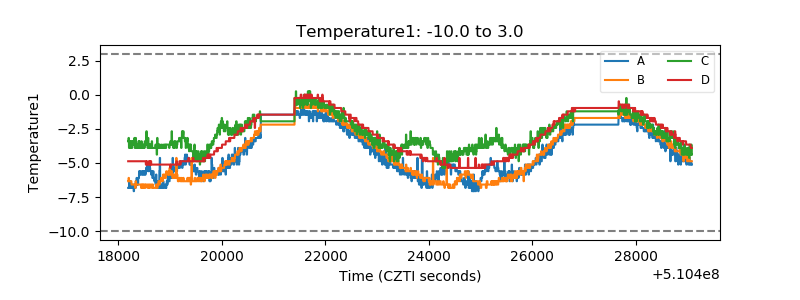 |
| Veto HV Monitor | 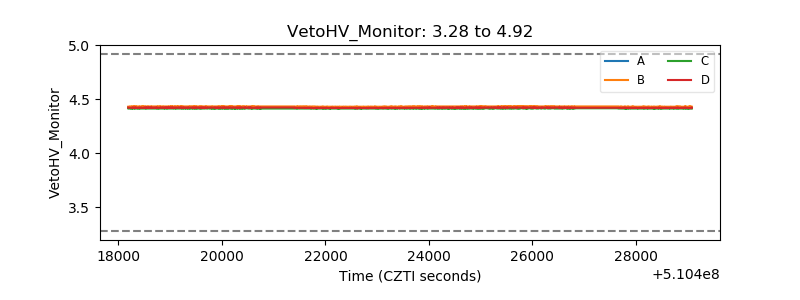 |
| Veto LLD |  |
| Alpha Counter |  |
| _CPM_Rate | 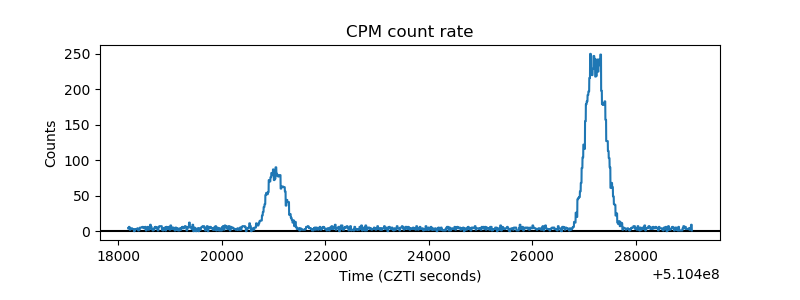 |
| CZT Counter | 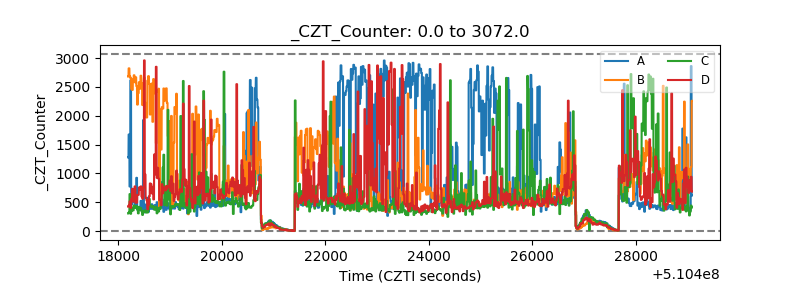 |
| +2.5 Volts monitor | 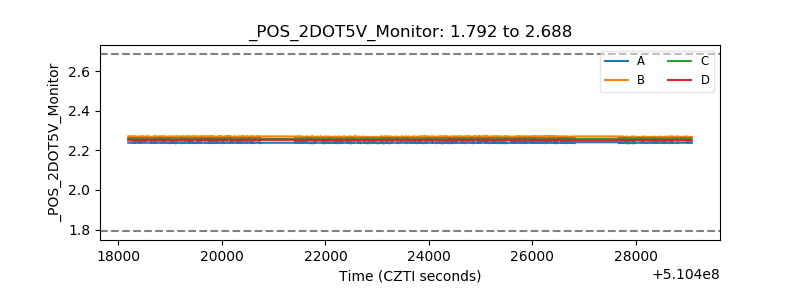 |
| +5 Volts monitor | 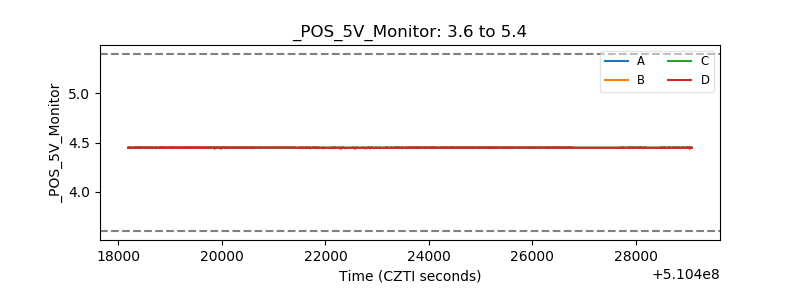 |
| _ROLL_ROT |  |
| _Roll_DEC | 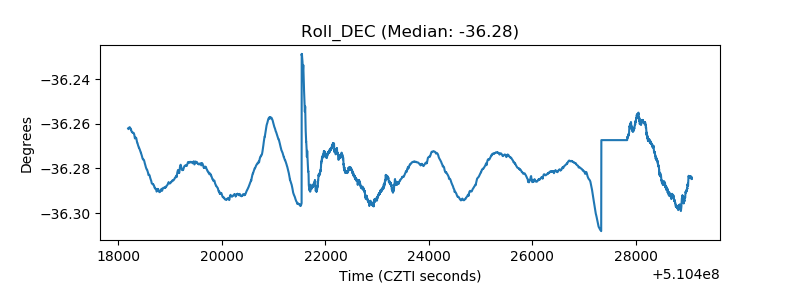 |
| _Roll_RA |  |
| Veto Counter | 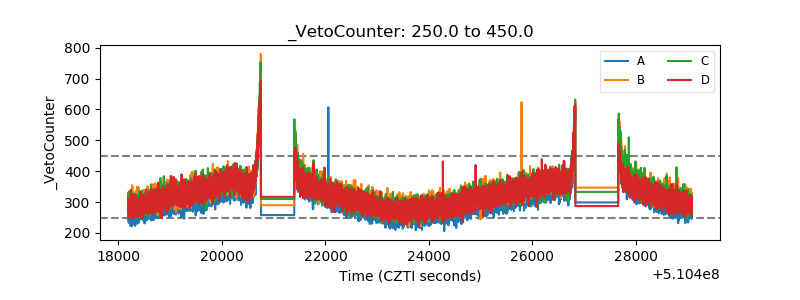 |